What is a graphic?
A graphic is a visual element displayed on a map or scene. A graphic is used to temporarily display features as points, lines, and polygons on a map or scene. For example, you can use a graphic to display a marker with your current GPS location.
You can use graphics to:
- Display points, lines, polygons, and text in a map or scene.
- Display geometry with different symbols in 2D and 3D.
- Move elements on the display.
- Display attributes in a pop-up when an element is clicked.
How a graphic works
Graphics are used to display a point, line, polygon, or text on a map or scene. They are temporary and are created at runtime by an application. For example, you can use data from a GPS to display a graphic on a map that represents the location of a device. The graphic (and data) do not persist when the application closes.
Graphics can be added to a graphics layer, graphic overlay, or view. To ensure they are always visible, they are typically added on top of all other layers. When a map view displays a map, graphics are the last to be displayed.
Figure 1: Graphics displayed on top of a basemap layer and data layers.
Graphic composition
A graphic is composed of a geometry, symbol, and attributes.
const pointGraphic = new Graphic({
geometry: point,
symbol: simpleMarkerSymbol,
attributes: attributes
});
Geometry
A graphic contains a geometry which defines its position on earth. A geometry is a geometric shape such as a point, polyline, or polygon.
const point = {
type: "point",
longitude: -118.80657463861,
latitude: 34.0005930608889
};
Symbol
A graphic contains a symbol that defines how it is displayed. A symbol contains styling information. Simple symbols have one layer and are displayed as vectors. More complex symbols can be composed of multiple layers. Marker symbols can display an image at the location of a point geometry.
To display a graphic in 2D or 3D, in most cases you can use a 2D symbol.
const simpleMarkerSymbol = {
type: "simple-marker",
color: [226, 119, 40], // orange
outline: {
color: [255, 255, 255], // white
width: 1
}
};
To display a graphic with a 3D shape, use a 3D symbol.
const simpleMarkerSymbol = {
type: "point-3d",
symbolLayers: [
{
type: "object",
width: 100,
height: 100,
resource: {
primitive: "cylinder"
},
material: {
color: "#000000",
outline: {
color: "#ffffff"
}
}
}
]
};Attributes
Graphics can also contain attributes. Attributes are field and data values that describe the graphic. For example, a graphic can contain name, ID, and type attributes. Attributes are useful for displaying information when a user clicks on a graphic.
const attributes = {
name: "Point",
description: "I am a point"
}
Code examples
Display graphics in a map
This example displays a point, line, and polygon in a map. It adds graphics to a graphics layer or an overlay. It also adds a simple pop-up when the graphic is clicked.
Steps
- Create a geometry to define the coordinates and shape.
- Create a symbol to define the style.
- Define attributes to show data when they are clicked.
- Add the graphic to a graphics layer, graphics overlay, or view.
Map
const graphicsLayer = new GraphicsLayer();
map.add(graphicsLayer);
const point = {
type: "point",
longitude: -118.80657463861,
latitude: 34.0005930608889
};
const simpleMarkerSymbol = {
type: "simple-marker",
color: [0, 0, 0],
outline: {
color: [255, 255, 255],
width: 1
}
};
const attributes = {
name: "Point",
description: "I am a point"
}
const pointGraphic = new Graphic({
geometry: point,
symbol: simpleMarkerSymbol,
attributes: attributes,
popupTemplate: {
title: attributes.name,
content: attributes.description
}
});
graphicsLayer.add(pointGraphic);
const simpleLineSymbol = {
type: "simple-line",
color: "#ff7380",
width: 2
};
const polyline = {
type: "polyline",
paths: [
[-118.821527826096, 34.0139576938577],
[-118.814893761649, 34.0080602407843],
[-118.808878330345, 34.0016642996246]
]
};
const polylineGraphic = new Graphic({
geometry: polyline,
symbol: simpleLineSymbol
})
graphicsLayer.add(polylineGraphic);
const polygon = {
type: "polygon",
rings: [
[-118.818984489994, 34.0137559967283],
[-118.806796597377, 34.0215816298725],
[-118.791432890735, 34.0163883241613],
[-118.79596686535, 34.008564864635],
[-118.808558110679, 34.0035027131376]
]
};
const simpleFillSymbol = {
type: "simple-fill",
color: [50,100,200,.5],
outline: {
color: [255, 255, 255],
width: 1
}
};
const polygonGraphic = new Graphic({
geometry: polygon,
symbol: simpleFillSymbol
});
graphicsLayer.add(polygonGraphic);
Display graphics in a scene
This example displays a point, line, and polygon in a scene. It adds graphics to a graphic layer or an overlay.
Steps
- Create a geometry to define the coordinates and shape.
- Create a symbol to define the style.
- Define attributes to show data when they are clicked.
- Add the graphic to a graphic layer, graphic overlay, or view.
Scene
const graphicsLayer = new GraphicsLayer({
elevationInfo: {
mode: "on-the-ground"
}
});
map.add(graphicsLayer);
const point = {
type: "point",
x: -118.80657463861,
y: 34.0005930608889,
z: 100 //meters
};
const pointSymbol = {
type: "point-3d",
symbolLayers: [
{
type: "object",
width: 100,
height: 100,
resource: {
primitive: "cylinder"
},
material: {
color: "#000000",
outline: {
color: "#ffffff"
}
}
}
]
};
const attributes = {
name: "Point",
description: "I am a point"
}
const pointGraphic = new Graphic({
geometry: point,
symbol: pointSymbol,
attributes: attributes,
popupTemplate: {
title: attributes.name,
content: attributes.description
}
});
graphicsLayer.add(pointGraphic);
const lineSymbol = {
type: "line-3d",
symbolLayers: [{
type: "path",
profile: "quad",
width: 5, // Path width in meters
height: 100, // Path height in meters
material: { color: "#ff7380" },
cap: "square",
profileRotation: "heading"
}]
};
const polyline = {
type: "polyline",
paths: [
[-118.821527826096, 34.0139576938577],
[-118.814893761649, 34.0080602407843],
[-118.808878330345, 34.0016642996246]
]
};
const polylineGraphic = new Graphic({
geometry: polyline,
symbol: lineSymbol
})
graphicsLayer.add(polylineGraphic);
const polygon = {
type: "polygon",
rings: [
[-118.818984489994, 34.0137559967283],
[-118.806796597377, 34.0215816298725],
[-118.791432890735, 34.0163883241613],
[-118.79596686535, 34.008564864635],
[-118.808558110679, 34.0035027131376]
]
};
const fillSymbol = {
type: "polygon-3d",
symbolLayers: [{
type: "extrude",
size: 200, // Meters in height
material: { color: [50,100,200,.5] }
}]
};
const polygonGraphic = new Graphic({
geometry: polygon,
symbol: fillSymbol
});
graphicsLayer.add(polygonGraphic);
Tutorials
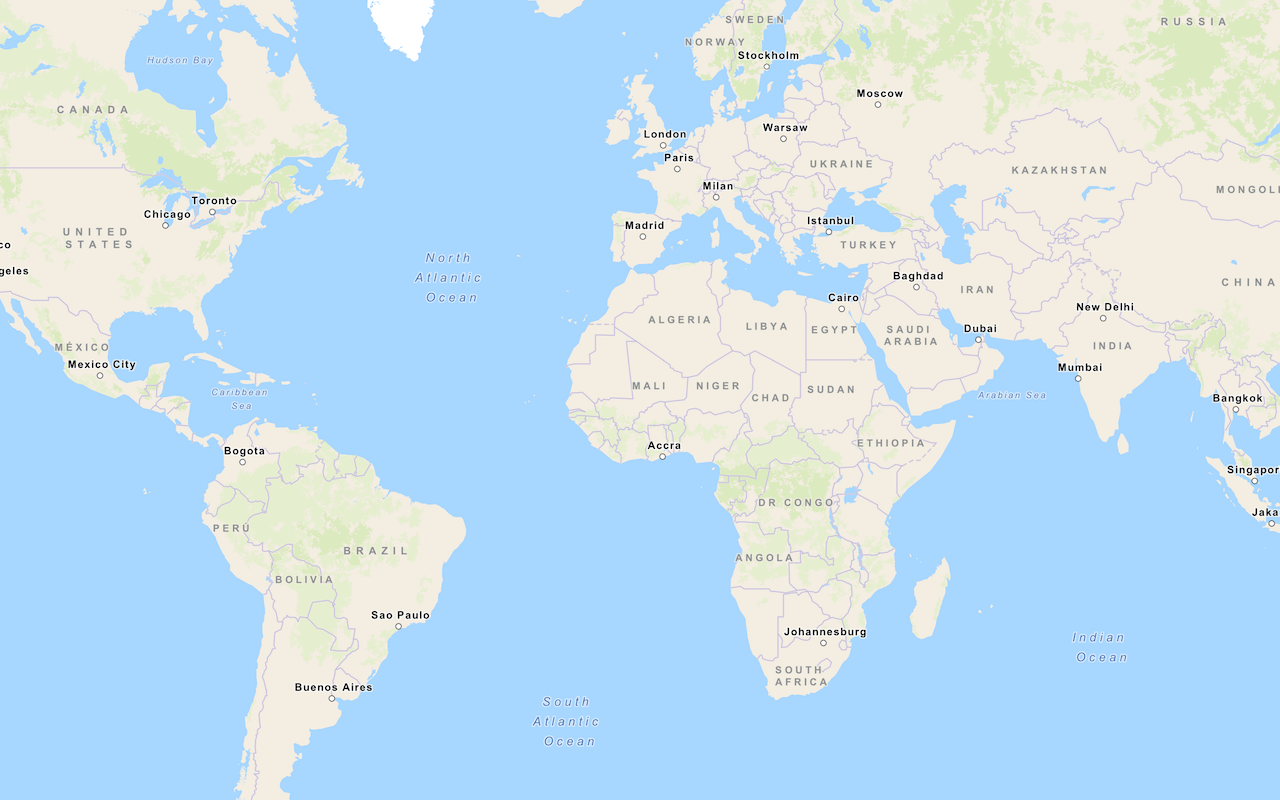
Display a map
Create and display a map with the basemap styles service.
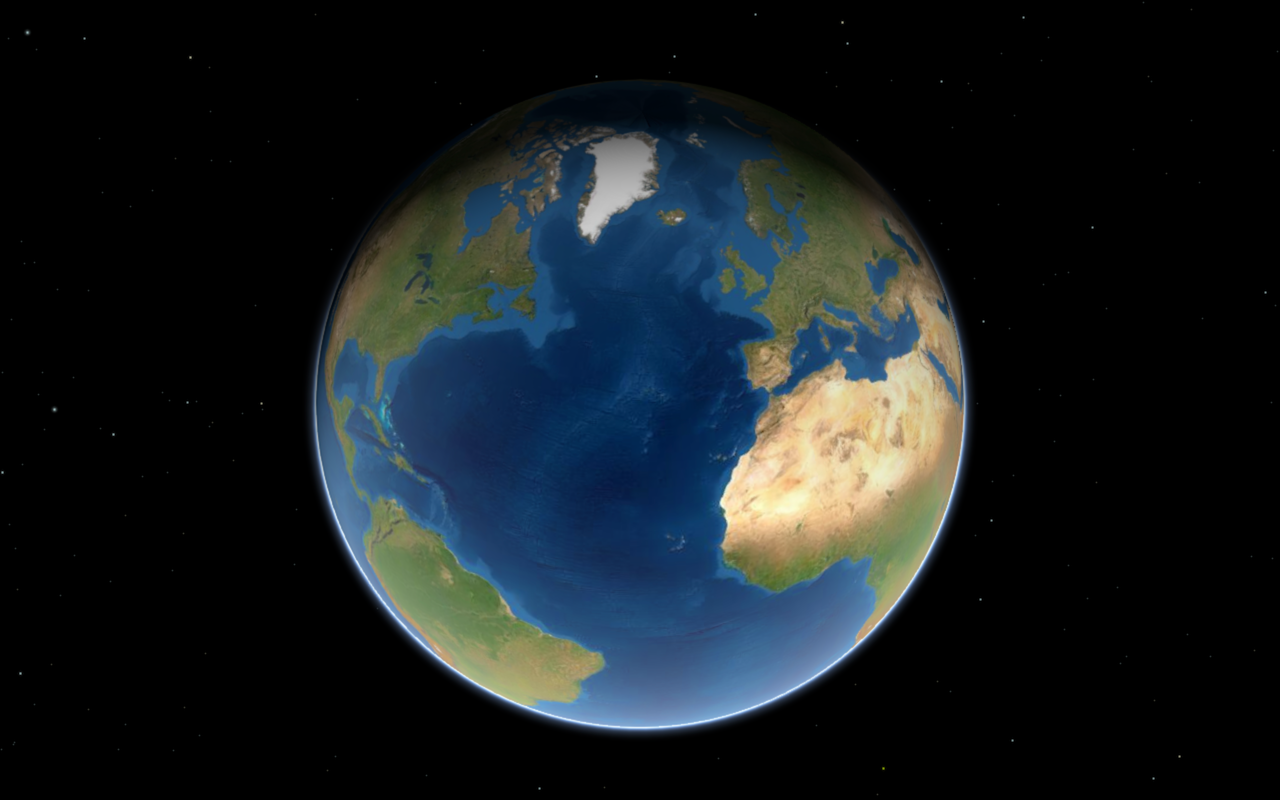
Display a scene
Display a scene with the basemap styles service.
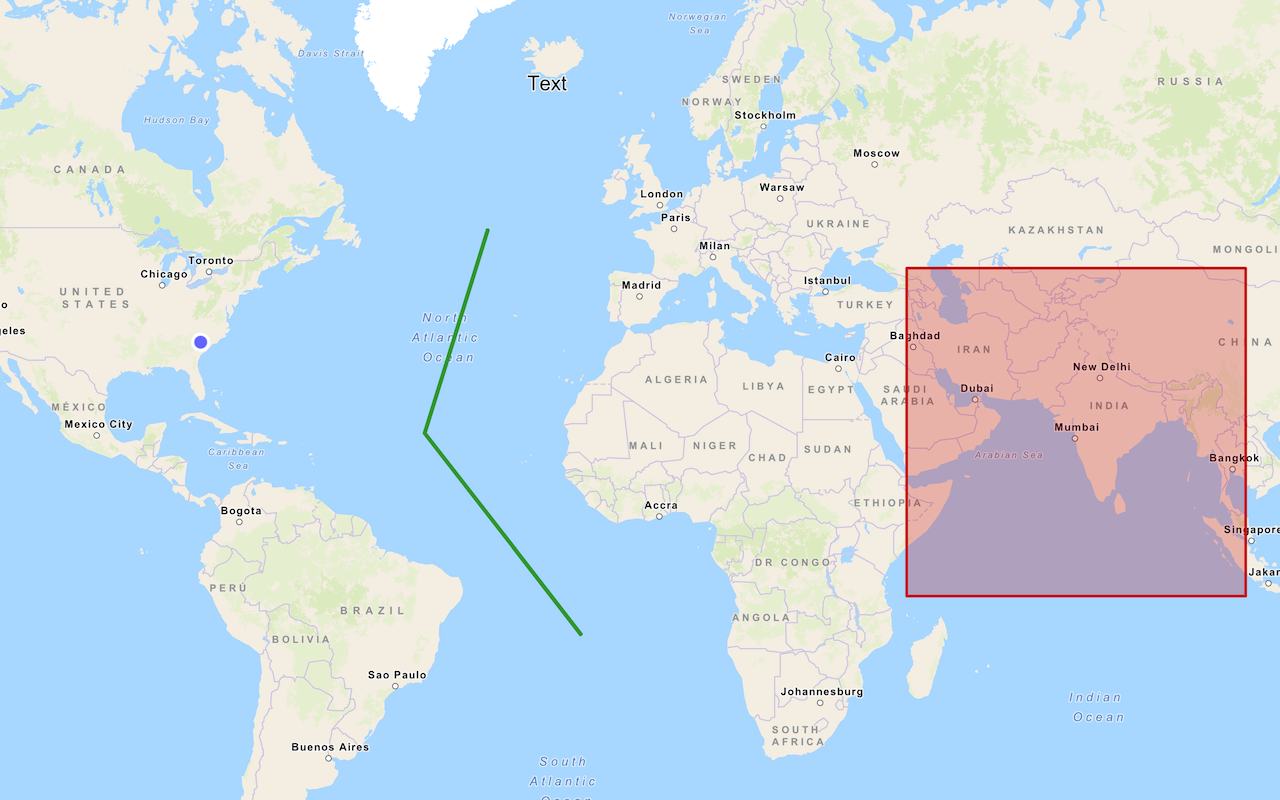
Add a point, line, and polygon
Display point, line, and polygon graphics in a map.
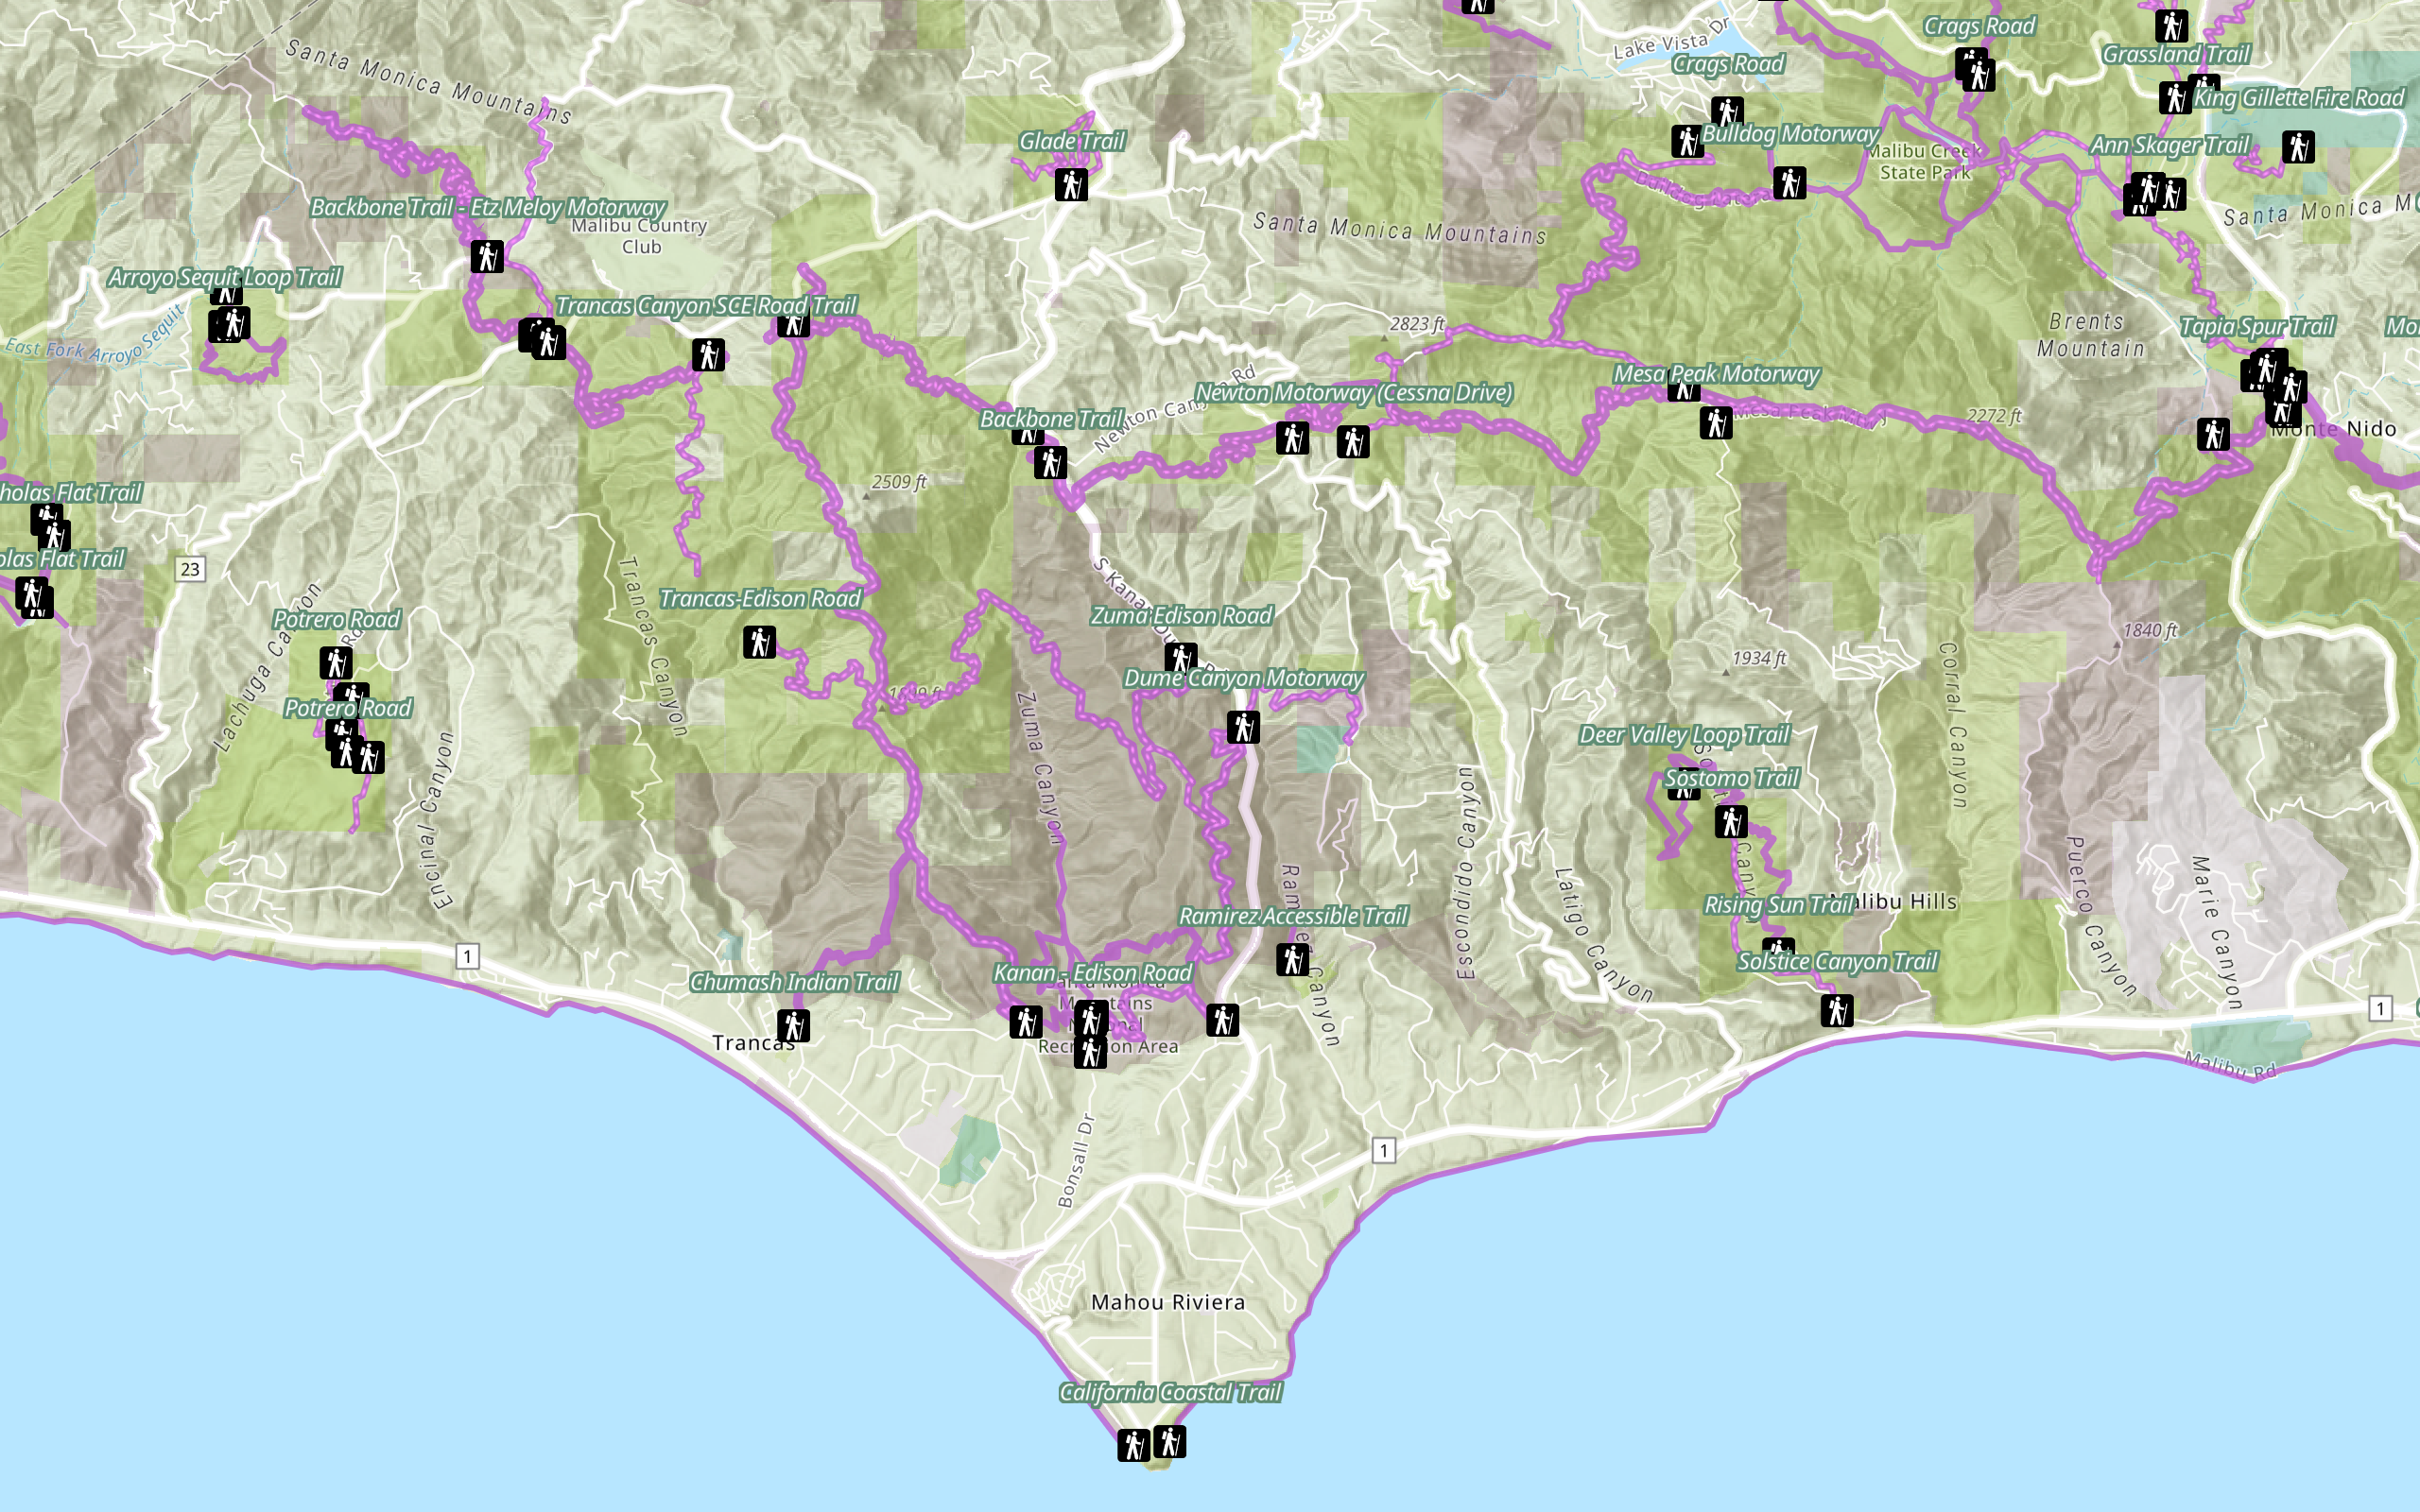
Add a feature layer
Access and display point, line, and polygon features from a feature service.
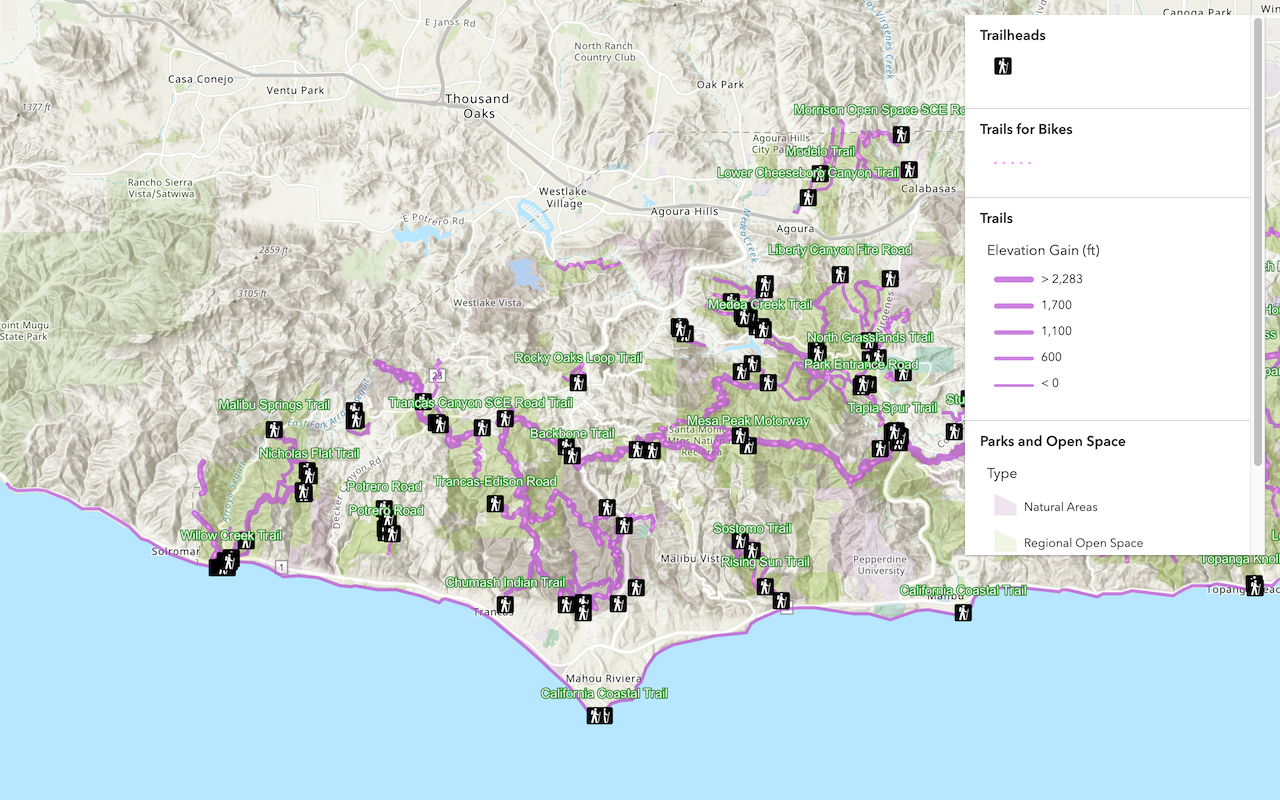
Display a web map
Create and display a map from a web map.
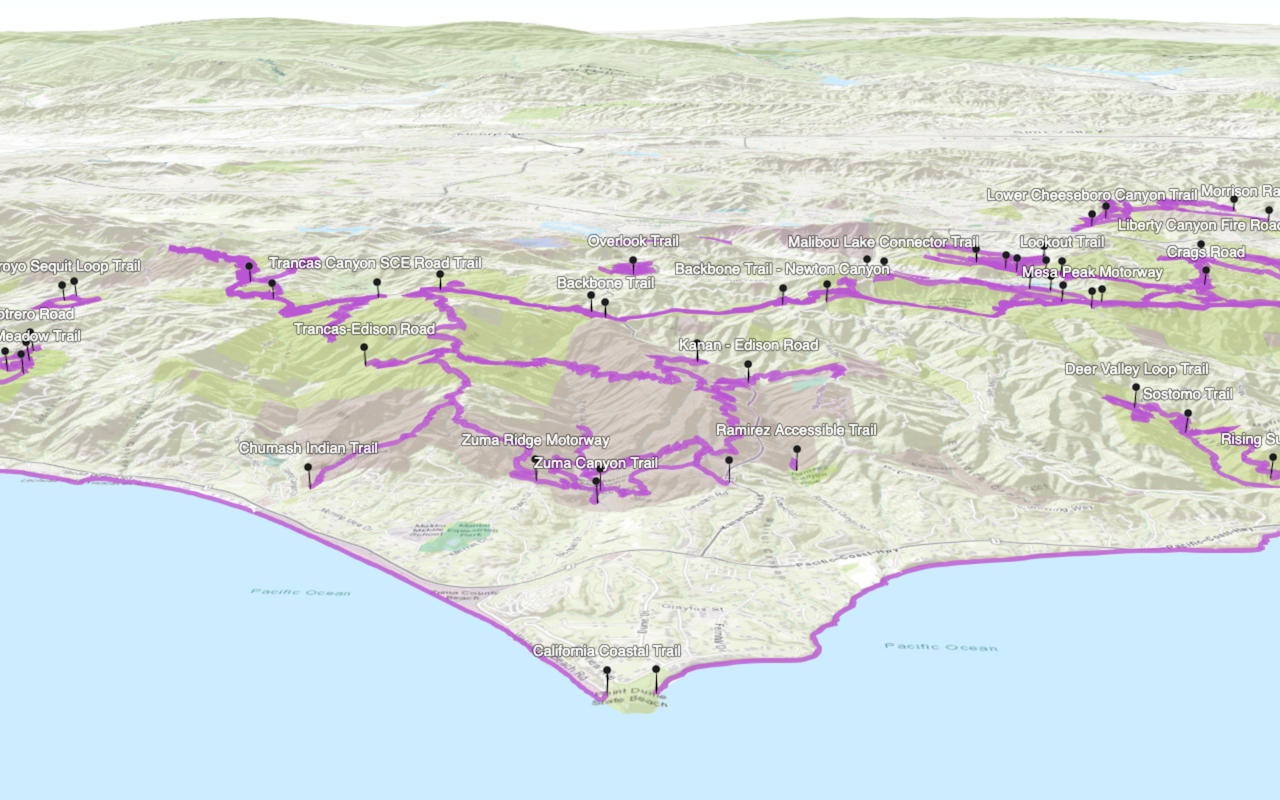
Display a web scene
Create and display a scene from a web scene.
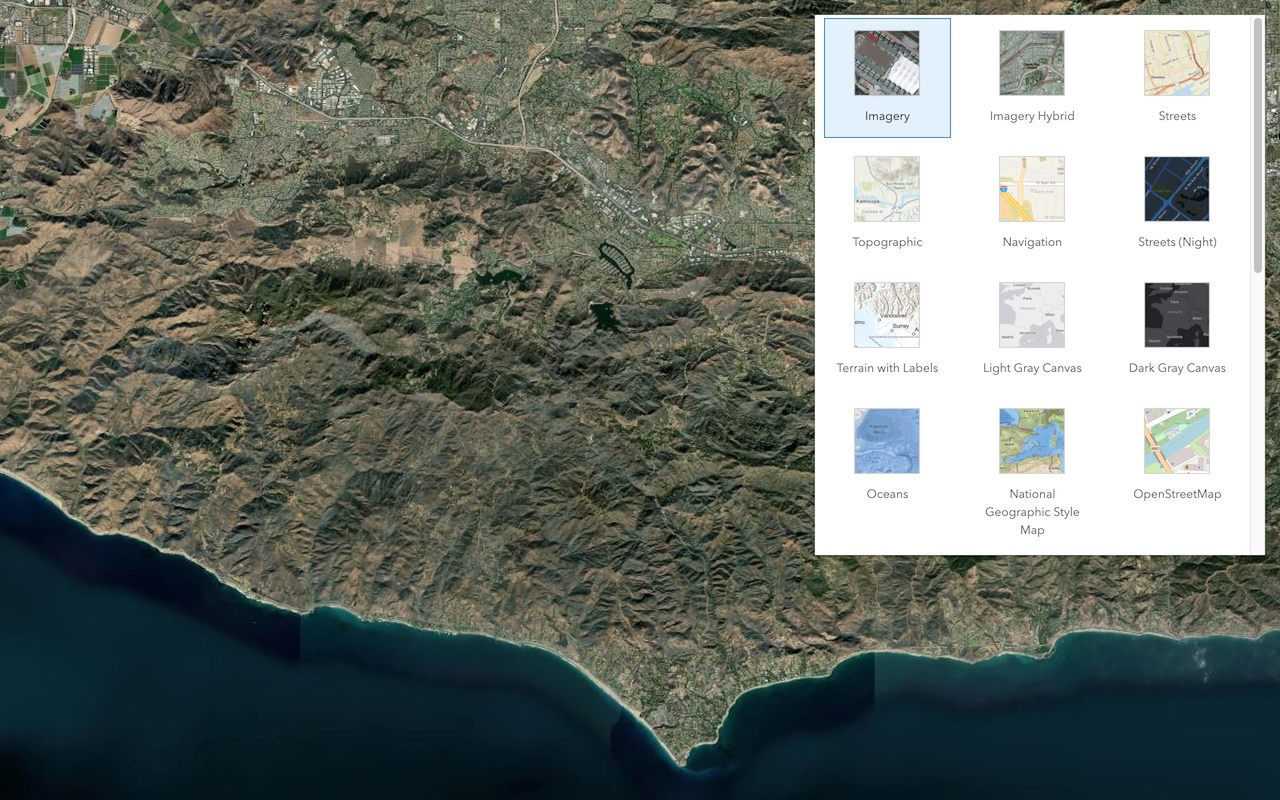
Change the basemap layer
Switch a basemap layer from streets to satellite imagery.
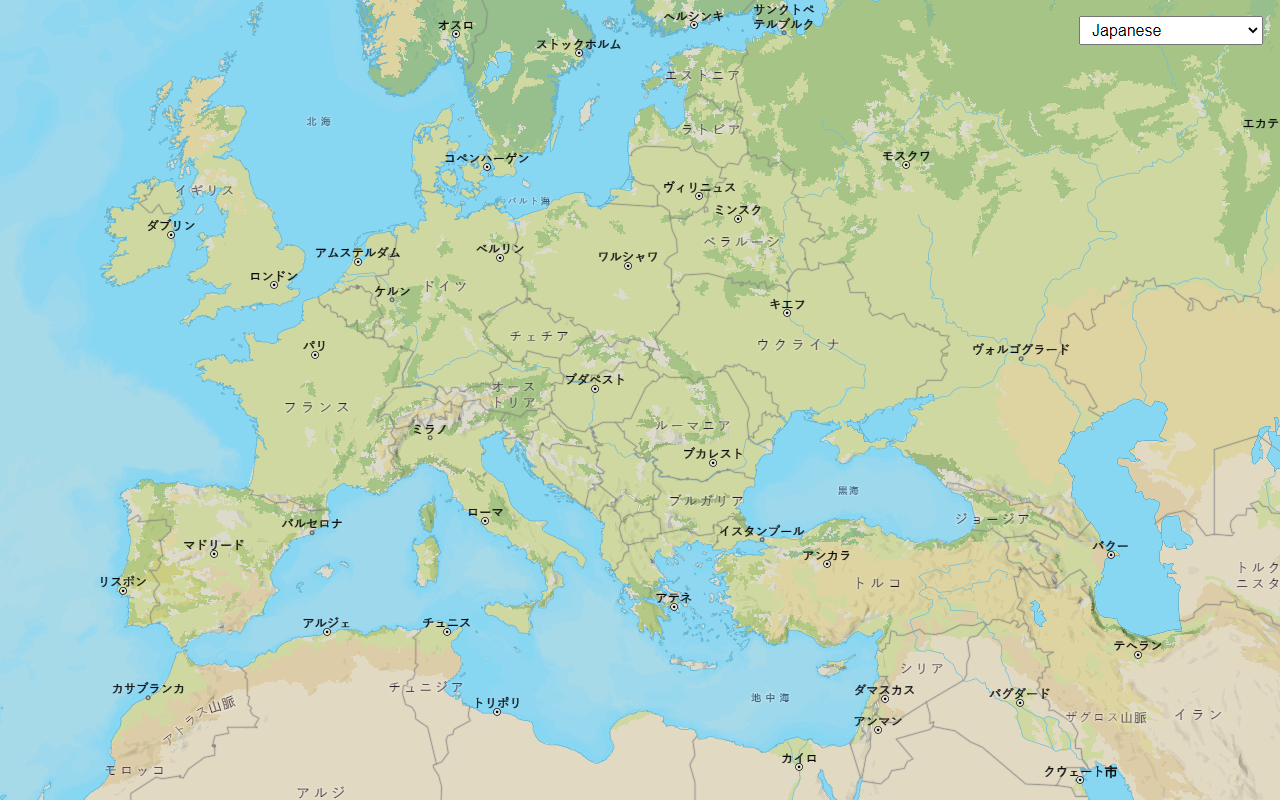
Change the place label language
Switch the language of place labels on a basemap.
Services
Basemap styles service (v1)
Access basemap styles such as streets, navigation, and imagery for maps and scenes.
API support
| 2D Display | 3D Display | Basemap layers | Basemap places | Data layers | Graphics | Web maps | Web scenes | |
|---|---|---|---|---|---|---|---|---|
| ArcGIS Maps SDK for JavaScript | 1 | |||||||
| ArcGIS Maps SDK for .NET | ||||||||
| ArcGIS Maps SDK for Kotlin | ||||||||
| ArcGIS Maps SDK for Swift | ||||||||
| ArcGIS Maps SDK for Java | ||||||||
| ArcGIS Maps SDK for Qt | ||||||||
| ArcGIS API for Python | ||||||||
| ArcGIS REST JS | 2 | 2 | ||||||
| Esri Leaflet | 3 | 4 | ||||||
| MapLibre GL JS | 3 | 4 | ||||||
| OpenLayers | 1 | 3 | 4 | |||||
| CesiumJS | 3 | 4 |
- 1. Display places only.
- 2. Access via HTTP request and authentication.
- 3. Access via Feature layer or Map tile layer.
- 4. Access via layers.