What are global and local scenes?
Global and local scenes are different viewing modes you can use to visualize 3D data. When you work with a scene, you choose whether to render the data on a globe or to project it on a plane that can be navigated in 3D space.
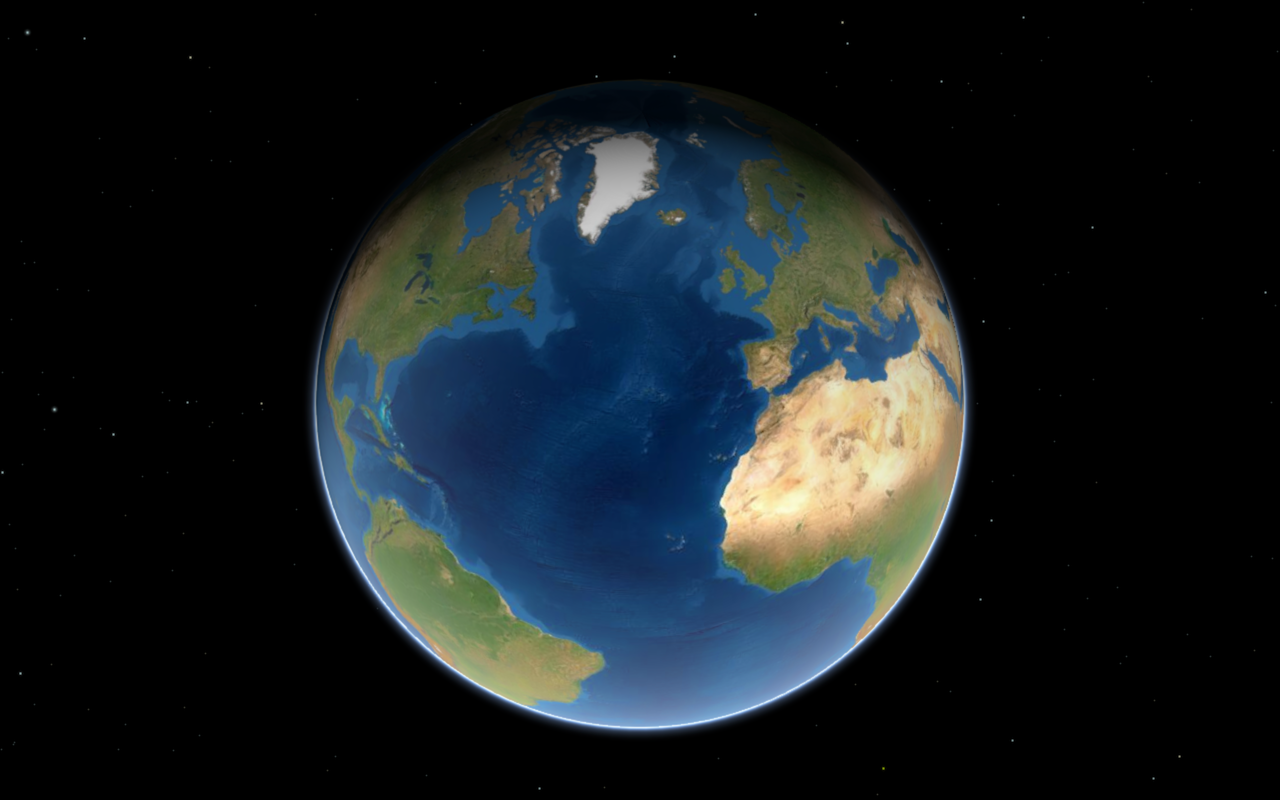
A global scene is typically used to display data that spans around the globe when viewing the curvature of the earth is important.
A local scene is a projected view of a surface that is typically used for smaller extents. It is useful when visualizing data such as a country or a city. To show only a region of interest, you can clip a local scene to an extent.
A global scene generally displays data in a geographic coordinate system, while local scenes can only display data in projected coordinate systems.
In both global and local scenes, you can display data below the ground and navigate below and above the ground.
How to create a scene
To create a global or local scene, you define the basemap layer and data layers to display and then set the camera properties.
Define the scene
The first step is to create the scene with a basemap layer and/or data layers. You can also reference an elevation service to display the scene with relief.
esriConfig.apiKey = "YOUR_API_KEY";
// In the ArcGIS Maps SDK for JavaScript, the Map class is used
// to define both maps and scenes.
const map = new Map({
basemap: "arcgis-light-gray",
ground: "world-elevation"
});
Set the camera
Now display the scene using a scene view. You set the scene view's perspective of the scene by defining the scene view's camera, specifying the camera's location (including height), heading, and tilt (or pitch).
If the API supports local scenes, you use the scene view to specify whether the viewing mode is local or global. .NET, Kotlin, Swift, Java and Qt APIs currently only support global scenes.
const sceneView = new SceneView({
map: map,
camera: {
position: [
-41.18215285,
-86.13467977,
9321113.29449
],
heading: 359.73,
tilt: 68.57
},
viewingMode: "local",
Code examples
Create a globe
This example displays earthquake data on a globe. The scene uses the Vintage Shaded Relief layer as a basemap. Additionally the earthquakes data layer is loaded as a CSV layer. .NET, Kotlin, Swift, Java and Qt API examples use a hosted feature layer. Set the scene on a scene view along with a camera position and a global viewing mode.
const map = new Map({
basemap: new Basemap({
baseLayers: [
new TileLayer({
url: "https://tiles.arcgis.com/tiles/nGt4QxSblgDfeJn9/arcgis/rest/services/VintageShadedRelief/MapServer"
})
]
}),
layers: [csvLayer]
});
const view = new SceneView({
container: "viewDiv",
map: map,
// Indicates to create a global scene
viewingMode: "global",
camera: {
position: [
-63.77153412,
20.75790715,
25512548.00000
],
heading: 0.00,
tilt: 0.10
},
Create a local scene
This example displays earthquakes in a clipped, local scene. The scene view displays a basemap and earthquake data that is displayed below the ground plane. Enable navigation below the ground to permit exploring the earthquakes. Additionally, the view uses a clipping extent to display only the area of interest.
const map = new Map({
basemap: "arcgis-topographic",
layers: [
quakesDepthLayer
],
ground: {
navigationConstraint: {
type: "none"
},
opacity: 0.8
}
});
const view = new SceneView({
container: "viewDiv",
map: map,
// Indicates to create a local scene
viewingMode: "local",
// Use the exent defined in clippingArea to define the bounds of the scene
clippingArea: {
xmax: -10834217,
xmin: -10932882,
ymax: 4493918,
ymin: 4432667,
spatialReference: {
wkid: 3857
}
},
camera: {
position: [
-98.36408160,
36.42115060,
26124.42603
],
heading: 32.37,
tilt: 78.08
},
Tutorials
Services
Feature service
Add, update, delete, and query feature data.
Scene service
Serve 3D data for maps and scenes.
API support
| Basemap styles | Point, line, and polygon styles | Data-driven visualization | 3D visualization | |
|---|---|---|---|---|
| ArcGIS Maps SDK for JavaScript | ||||
| ArcGIS Maps SDK for Kotlin | ||||
| ArcGIS Maps SDK for Swift | ||||
| ArcGIS Maps SDK for Java | ||||
| ArcGIS Maps SDK for .NET | ||||
| ArcGIS Maps SDK for Qt | ||||
| ArcGIS API for Python | 1 | 2 |
- 1. Define renderers with JavaScript.
- 2. Supports web scenes only.