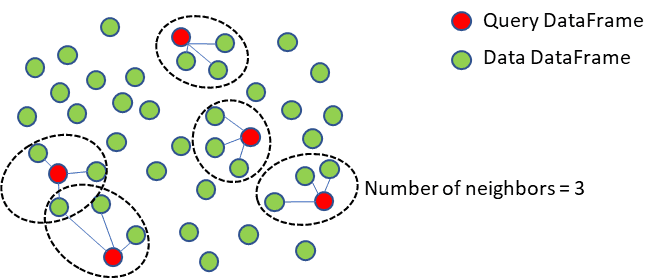
Nearest Neighbors finds the given number of neighbors to a record in a DataFrame from records in another DataFrame. The records from the input DataFrames are matched based on closest proximity.
Usage notes
-
Nearest Neighbors supports point, line ,and polygon geometry types.
-
Nearest Neighbors supports two formats for the output layout:
-
Long—Each row represents a query record with a single nearest neighbor, and the columns include rank, distance between geometries of two records, and all fields from
query_anddataframe data_. The output is organized by stacking all paired records.dataframe -
Wide—Each row represents a query record with all nearest neighbors, with the fields in
data_consolidated into one column with distance to the query record. The columns include all fields fromdataframe query_and the information for each nearest neighbor.dataframe
-
-
If you provide only one DataFrame, the DataFrame is used as both the
query_and thedataframe data_. In the output, each record will be joined with other nearby records, excluding itself. For example, if you are interested in finding the nearby cities for each city in the United States, you can provide the US-city DataFrame as the input DataFrame without specifying separatedataframe query_andData Frame data_.Data Frame -
The
setparameter determines how distances between data and query records are calculated. There are two distance methods available:Distance Method() -
Planar—Planar calculation is recommended for accurate analysis of small, local areas only. Planar calculation is the default when the input DataFrame is in a projected coordinate system.
-
Geodesic—Geodesic calculation is recommended for data in a coordinate system that is not appropriate for distance measurements (for example, Web Mercator) or for data that spans larger, global areas. Geodesic calculation is the default when the input DataFrame is in a geographic coordinate system.
If the
query_andData Frame data_have different coordinate systems, analysis will be completed in the coordinate system of theData Frame query_. To learn more about the difference between planar and geodesic calculations see Coordinate systems and transformations.Data Frame -
-
If either DataFrame has a spatial reference, the other DataFrame must also have a spatial reference or the tool will fail. If both input DataFrames have no spatial references, Nearest Neighbors can be used to calculate the planar distance and find neighbors with the assumption that the search distance and output distance have the same unit as the input coordinates. In this case, the distance method should be set to
planar, and the search distance unit should be set toNone. -
If there are multiple nearest neighbors with an equal distance to the query record, nearest neighbor will break ties by randomly selecting one or more records from the equidistant neighbors to ensure the specified number of closest neighbors. For example, if you are interested in finding two nearest neighbors when there are three records that are equidistant from the query record, two of the three records will be randomly selected and returned in the output.
-
Set a search distance to exclude neighbors further away than the search distance. This can result in fewer neighbors returned than the specified number of neighbors. For example, if you are interested in finding three nearest neighbors within a specified search distance when there are two records within the distance, only the two neighbors will be returned in the output.
Search distance is optional when using planar calculation, but required when using geodesic calculation.
-
When Nearest Neighbors finds fewer neighbors in the
data_than the specified number of neighbors, it will returndataframe Nullfor no neighbors in awide-format output, or only return rows that have a matched neighbor in along-format output.
Results
The format of the output DataFrame differs depending on the output layout type. The two options are long and wide.
Long-format layout
-
The following fields are included in the output DataFrame with the long-format layout:
- All fields from the query DataFrame
- All fields from the data DataFrame
In addition, the following fields are included in the output records:
| Field | Description |
|---|---|
near_ | The rank of the nearest neighbors. The rank is given according to ascending order distance. |
near_ | The distance between the record in the query_ to the identified nearest neighbor from the data_. |
Wide-format layout
-
The following fields are included in the output DataFrame with the wide-format layout:
- All fields from the query DataFrame
-
In addition, there is one column for each near record with the sub-fields in the output DataFrame:
near_—The distance to the query recorddistance - All fields from the data DataFrame
For example, if the number of neighbors is 3, three new fields will be appended to the result dataframe, near1, near2,
and near3. Each of the three fields include near_ and all fields from the data DataFrame.
Performance notes
Improve the performance of Nearest Neighbors by doing one or more of the following:
-
Only analyze the records in your area of interest. You can pick the records of interest by using one of the following SQL functions:
- ST_Intersection—Clip to an area of interest represented by a polygon. This will modify your input records.
- ST_BboxIntersects—Select records that intersect an envelope.
- ST_EnvIntersects—Select records having an evelope that intersects the envelope of another geometry.
- ST_Intersects—Select records that intersect another dataset or area of intersect represented by a polygon.
- Use the planar distance calculation method instead of geodesic.
- Set a search distance with
set, especially when input DataFrames are polyline or polygon geometries.Search Distance() - If the data is in geographic coordinate system but for small, local areas, project it to a local coordinate system, and then choose planar for distance calculation. You can transform your data to a projected coordinate system by using ST_Transform.
- For geodesic calculation, if the polyline or polygon geometries are small but spaced far apart, consider using ST_Centroid to get the centroid representation of the input geometry before running Nearest Neighbors.
- For geodesic calculation, consider generalizing the input polyline or polygon geometries using ST_Generalize.
- Use smaller values for
setandSearch Distance() set.N u m Neighbors()
Similar capabilities
Syntax
For more details, go to the GeoAnalytics Engine API reference for nearest neighbors.
| Setter | Description | Required |
|---|---|---|
run(query_ | Runs the Nearest Neighbors tool using the provided DataFrames. query_ is a DataFrame containing geometries whose nearest neighbors will be found, and data_ is a DataFrame containing the neighbor candidates. | Yes |
set | Sets the number of neighbors (k) to find that are nearest to the query record. | Yes |
set | Sets the method used to calculate distances between data and query records. There are two methods to choose from: 'Planar' or 'Geodesic'. See Usage notes for the default option. | No |
set | Sets a distance bound within which to search for nearest neighbors. Choose from 'Meters', 'Kilometers', 'Feet', 'Miles', 'Nautical, 'Yards', or None. It is optional for planar calculation, but required for geodesic distance method. | No |
set | Sets the output unit of the near distances for the result DataFrame. Choose from 'Meters' (default), 'Kilometers', 'Feet', 'Miles', 'Nautical, or 'Yards'. | No |
set | Sets the layout format for the result DataFrame. Choose from 'long' format (default) or 'wide' format. | No |
Examples
Run Nearest Neighbors
# Log in
import geoanalytics
geoanalytics.auth(username="myusername", password="mypassword")
# Imports
from geoanalytics.tools import NearestNeighbors, Clip
from geoanalytics.sql import functions as ST
from pyspark.sql import functions as F
# Path to the USA parks, public schools and county boundary data
parks_data_path = "https://services.arcgis.com/P3ePLMYs2RVChkJx/arcgis/rest/services/USA_Parks/FeatureServer/0"
schools_data_path = "https://services1.arcgis.com/Ua5sjt3LWTPigjyD/arcgis/rest/services/Public_School_Location_201819/FeatureServer/0"
counties_data_path = "https://services.arcgis.com/P3ePLMYs2RVChkJx/arcgis/rest/services/USA_Counties_Generalized_Boundaries/FeatureServer/0"
# Create DataFrames for park data and school data in Los Angeles County
la_df = spark.read.format("feature-service").load(counties_data_path) \
.where("NAME == 'Los Angeles County'") \
.withColumn("shape", ST.transform("shape", 6423))
schools_df = spark.read.format("feature-service").load(schools_data_path) \
.withColumn("shape", ST.transform("shape", 6423)) \
.select("NCESSCH","NAME","STREET","CITY","shape")
parks_df = spark.read.format("feature-service").load(parks_data_path) \
.withColumn("shape", ST.transform("shape", 6423)) \
.select("FID","NAME","SQMI","FEATTYPE","shape")
schools_la = Clip().run(schools_df, la_df).select("NCESSCH","NAME","STREET",F.col("clip_geometry").alias("shape"))
parks_la = Clip().run(parks_df, la_df).select("FID","NAME","FEATTYPE",F.col("clip_geometry").alias("shape"))
# Run Nearest Neighbors tool to identify the 4 closest parks near each school within 1 kilometer
print("This is the long-format layout for the output:")
result_long = NearestNeighbors() \
.setNumNeighbors(4) \
.setSearchDistance(1, "Kilometer") \
.setResultLayout("long") \
.run(schools_la, parks_la)
result_long.select("NCESSCH","NAME","STREET","shape","near_rank","FID","NAME1","FEATTYPE","shape1",
F.round("near_distance", 3).alias("near_distance")) \
.where("NCESSCH == '062271003393'").sort("near_rank").show()
print("This is the wide-format layout for the output:")
result_wide = NearestNeighbors() \
.setNumNeighbors(4) \
.setSearchDistance(1, "Kilometer") \
.setResultLayout("wide") \
.run(schools_la, parks_la)
result_wide.select("NCESSCH","NAME","STREET","shape",
F.round(F.col("near1").near_distance, 3).alias("near1_distance"),
F.round(F.col("near2").near_distance, 3).alias("near2_distance"),
F.round(F.col("near3").near_distance, 3).alias("near2_distance")) \
.where("NCESSCH == '062271003393'").show()
This is the long-format layout for the output:
+------------+--------------------+----------------+--------------------+---------+----+--------------------+----------+--------------------+-------------+
| NCESSCH| NAME| STREET| shape|near_rank| FID| NAME1| FEATTYPE| shape1|near_distance|
+------------+--------------------+----------------+--------------------+---------+----+--------------------+----------+--------------------+-------------+
|062271003393|Tenth Street Elem...|1000 Grattan St.|{"x":1974761.5562...| 1|7182| Hope and Peace Park|Local park|{"rings":[[[19744...| 561.105|
|062271003393|Tenth Street Elem...|1000 Grattan St.|{"x":1974761.5562...| 2|7160|Alvarado Terrace ...|Local park|{"rings":[[[19740...| 653.913|
|062271003393|Tenth Street Elem...|1000 Grattan St.|{"x":1974761.5562...| 3|7159| MacArthur Park|Local park|{"rings":[[[19744...| 969.462|
+------------+--------------------+----------------+--------------------+---------+----+--------------------+----------+--------------------+-------------+
This is the wide-format layout for the output:
+------------+--------------------+----------------+--------------------+--------------+--------------+--------------+
| NCESSCH| NAME| STREET| shape|near1_distance|near2_distance|near2_distance|
+------------+--------------------+----------------+--------------------+--------------+--------------+--------------+
|062271003393|Tenth Street Elem...|1000 Grattan St.|{"x":1974761.5562...| 561.105| 653.913| 969.462|
+------------+--------------------+----------------+--------------------+--------------+--------------+--------------+Plot results
result_sample = result_long.where("NAME = 'Rise Kohyang Middle'") \
.withColumn("buffer", ST.buffer("shape", 1000))
school_area = result_sample.st.plot(geometry="buffer",
facecolor="none",
edgecolor="lightblue",
figsize=(16, 10))
school_area.set(xlim=(1.9715e6, 1.9755e6), ylim=(561000, 563750))
school_plot = result_sample.st.plot(geometry="shape", legend=True, label='Rise Kohyang Middle School', ax=school_area)
result_plot = result_sample.st.plot(geometry="shape1",
is_categorical=True,
cmap_values="NAME1",
cmap="Greens",
basemap="light",
legend=True,
label='Parks',
ax=school_area)
result_plot.set_title("Searching for four nearest parks around Rise Kohyang Middle School within 1 Km search distance")
result_plot.set_xlabel("X (Meters)")
result_plot.set_ylabel("Y (Meters)")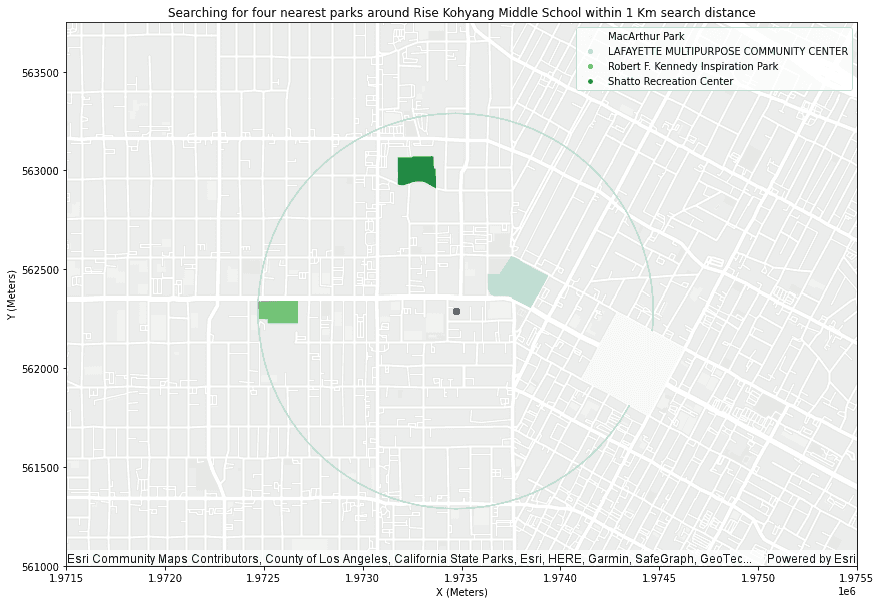
Version table
| Release | Notes |
|---|---|
1.1.0 | Tool introduced |
1.2.0 | Added support for geodesic distance method. |