 Hide Table of Contents
 Analysis
 Dynamic Layers
 Editing
 Feature Layers
 Feature Table
 Graphics
 Map
Map
 Mobile
 Online and Portal
 Popups and Info Windows
 Query and Select
 Renderers, Symbols, Visualization
 Search

Convex hull
Explore in the sandbox
Open in CodePen
View live sample
Description
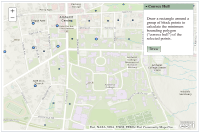
This sample shows how to use the Geometry Service convex hull operation to calculate the minimum bounding geometry for a set of points. The convex hull is typically a polygon but can be a polyline or point in cases where the points are collinear. The convex hull operation takes an input array of geometries and returns the geometry that defines the convex hull. It is recommended that you create a geometry service for use within your applications.
Code
<!DOCTYPE html>
<html>
  <head>
    <meta http-equiv="Content-Type" content="text/html; charset=utf-8">

    <meta name="viewport" content="initial-scale=1, maximum-scale=1,user-scalable=no">
    <title>Convex Hull</title>

    <link rel="stylesheet" href="https://js.arcgis.com/3.46/dijit/themes/claro/claro.css">
    <link rel="stylesheet" href="https://js.arcgis.com/3.46/esri/css/esri.css">
    <style>
      html, body { height: 100%; width: 100%; margin: 0; padding: 0; }
      #mapu { padding:0; }
      #titlePane {
        width:200px;
        height:300px;
      }
      .claro .dijitTitlePaneTitle {
        background: #A4BDA7;
        font-weight:600;
        color:#33292B;
      }
      .dijitButtonNode {
        background-color: #A4BDA7 !important;
        border: 1px solid #646750 !important;
        color:#33292B !important;
      }
    </style>

    <script>var dojoConfig = {parseOnLoad: true};</script>
    <script src="https://js.arcgis.com/3.46/"></script>
    <script>
      dojo.require("dijit.layout.BorderContainer");
      dojo.require("dijit.layout.ContentPane");
      dojo.require("dijit.TitlePane");
      dojo.require("esri.map");
      dojo.require("esri.layers.FeatureLayer");
      dojo.require("esri.toolbars.draw");
      dojo.require("esri.tasks.geometry");

      var map;
      var toolbar;
      var geometryService;
      var featureLayer;

      function init() {
        geometryService = new esri.tasks.GeometryService("https://utility.arcgisonline.com/ArcGIS/rest/services/Geometry/GeometryServer");

        map = new esri.Map("map", {
          basemap: "topo-vector",
          center: [-117.18, 34.05],
          zoom: 12
        });

        //add a point layer to the map
        featureLayer = new esri.layers.FeatureLayer("https://services.arcgis.com/V6ZHFr6zdgNZuVG0/arcgis/rest/services/DrinkingWaterOSM_viewlayer/FeatureServer/0",{
          mode: esri.layers.FeatureLayer.MODE_ONDEMAND
        });

        //define a selection symbol for the feature layer
        var symbol = new esri.symbol.SimpleMarkerSymbol(esri.symbol.SimpleMarkerSymbol.STYLE_SQUARE, 12, new esri.symbol.SimpleLineSymbol(esri.symbol.SimpleLineSymbol.STYLE_SOLID, new dojo.Color([247, 0, 171, 0.9]), 2), new dojo.Color([247, 0, 171, 0.5]));
        featureLayer.setSelectionSymbol(symbol);

        map.addLayer(featureLayer);

        dojo.connect(map, 'onLoad', function(theMap) {
          //create the draw toolbar
          toolbar = new esri.toolbars.Draw(map);
          dojo.connect(toolbar,"onDrawEnd",drawEndHandler);
        });
      }
      function activateToolbar(){
        toolbar.activate(esri.toolbars.Draw.EXTENT);
      }
      function drawEndHandler(geometry){
        toolbar.deactivate();
        map.graphics.clear();
        //select the points within the extent
        var query = new esri.tasks.Query();
        query.geometry = geometry;
        featureLayer.selectFeatures(query,esri.layers.FeatureLayer.SELECTION_NEW,function(features){
          //calculate the convex hull
          var points = dojo.map(features,function(feature){
            return feature.geometry;
          });
          geometryService.convexHull(points,function(result){
            var symbol;
            switch(result.type){
              case "point":
                symbol = new esri.symbol.SimpleMarkerSymbol();
                break;
              case "polyline":
                symbol = new esri.symbol.SimpleLineSymbol();
                break;
              case "polygon":
                symbol = new esri.symbol.SimpleFillSymbol();
                break;
            }
            map.graphics.add(new esri.Graphic(result,symbol));
          },function(error){
            console.log("An error occured during convex hull calculation");
          });
        });
      }
      dojo.ready(init);
    </script>
  </head>

  <body class="claro">
    <div data-dojo-type="dijit.layout.BorderContainer" data-dojo-props="gutters:'false',design:'headline'" style="width: 100%; height: 100%;">
      <div id="map" data-dojo-type="dijit.layout.ContentPane" data-dojo-props="region:'center'"  style="overflow:hidden;">
      <div style="position:absolute; right:20px; top:10px; z-Index:999;">
        <div id="titlePane" data-dojo-type="dijit.TitlePane" data-dojo-props="title:'Convex Hull', closable:'false', open:'true'">
            <p style="padding:5px 2px;color:#33292B;">Draw a rectangle around a group of block points to calculate the
              minimum bounding polygon ("convex hull") of the selected points.</p>
            <button data-dojo-type="dijit.form.Button" data-dojo-props="onClick:activateToolbar">Draw</button>
        </div>
      </div>
      </div>
    </div>
  </body>
</html>