Follow step-by-step instructions to build applications with different mapping APIs and ArcGIS location services. Learn how to use tools such as the developer dashboard, ArcGIS Online, and ArcGIS Vector Tile Style Editor to prepare data for your applications.
Security and authentication
Learn how to securely access ArcGIS resources using API keys and OAuth 2.0.
Create and manage an API key
Create and configure an API key to access ArcGIS resources.
Register an OAuth 2.0 application
Register an application in the developer dashboard.
Implement user authentication
Authenticate ArcGIS users with OAuth 2.0
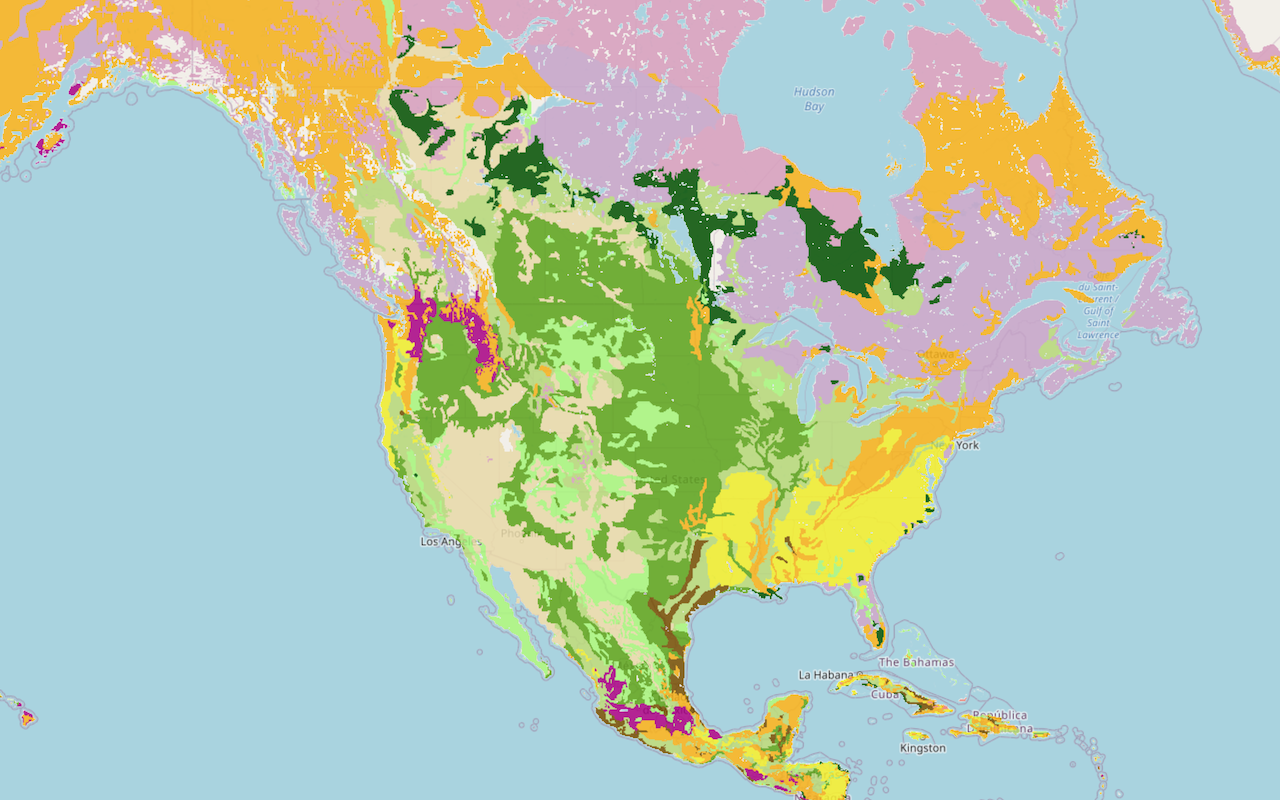
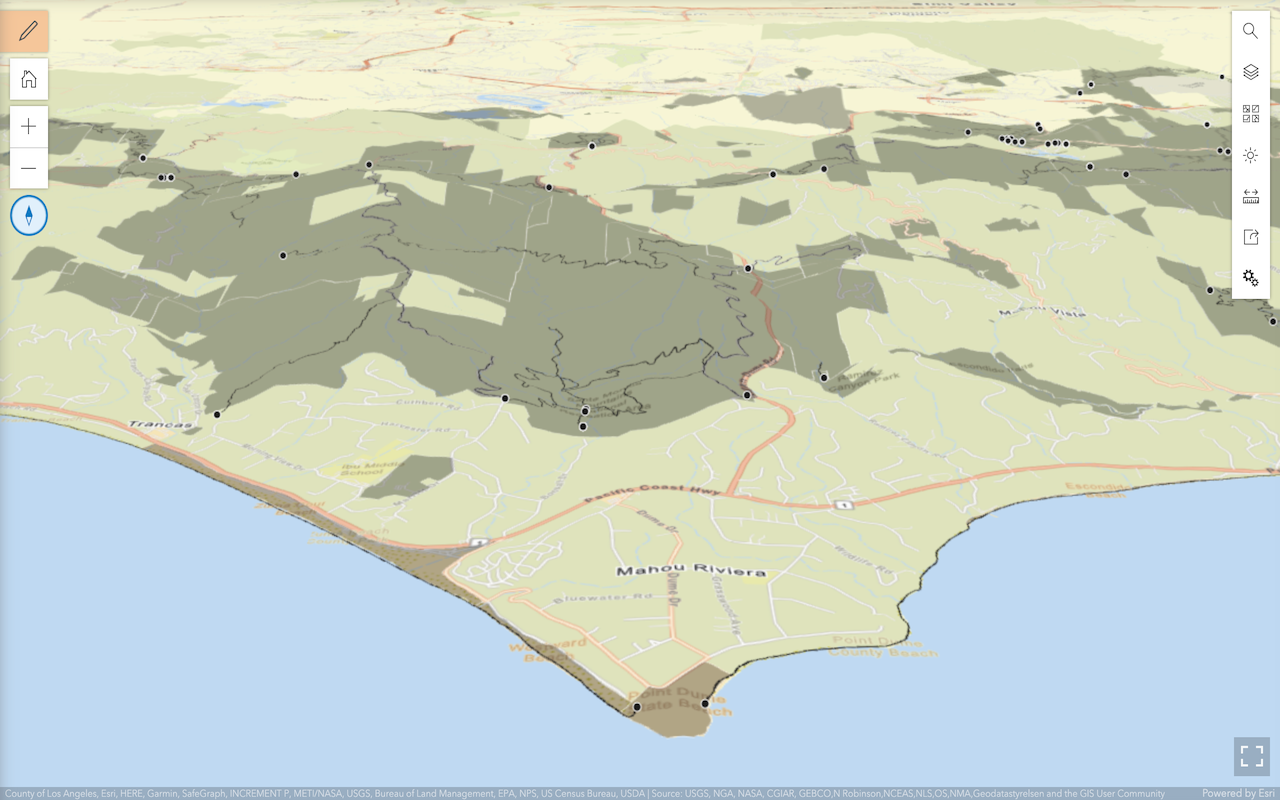
Mapping
Display maps and layers using the basemap styles service and data services.
Basemap layers
Display a map
Create and display a map with the basemap styles service.
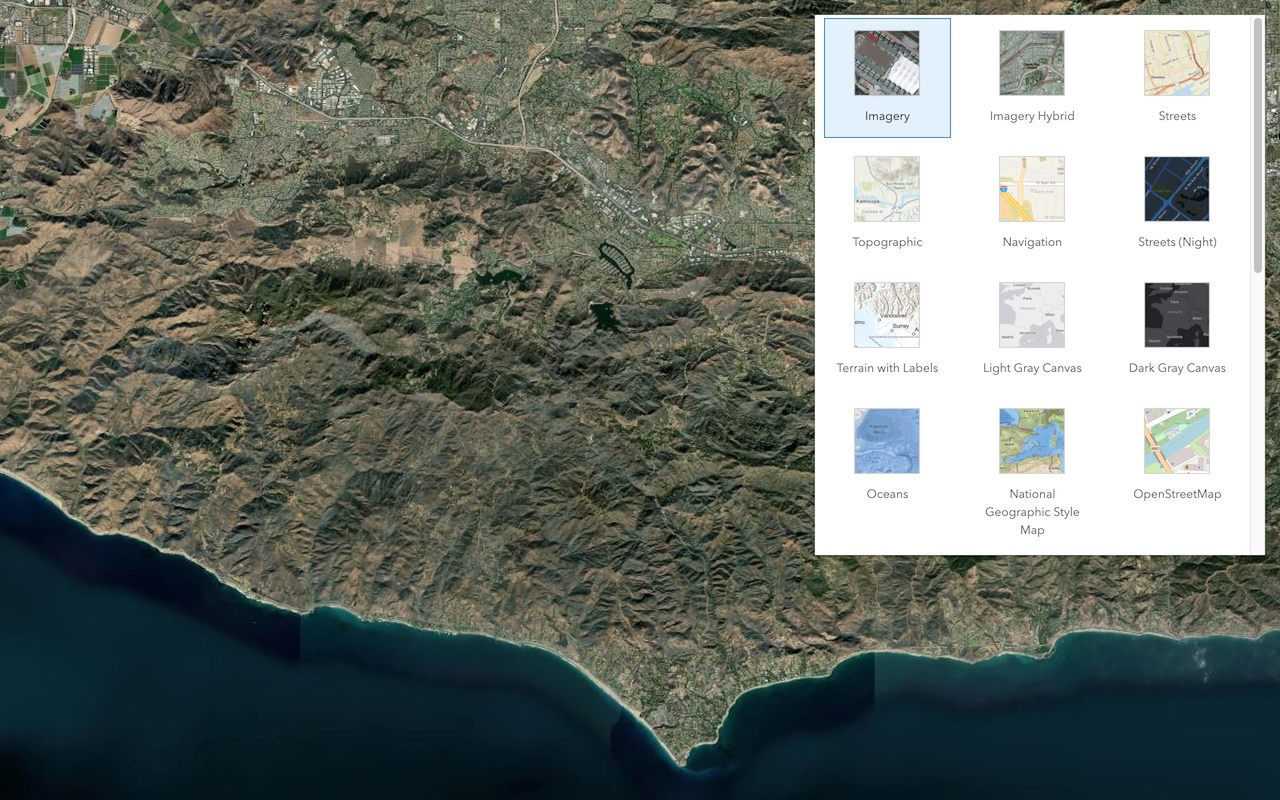
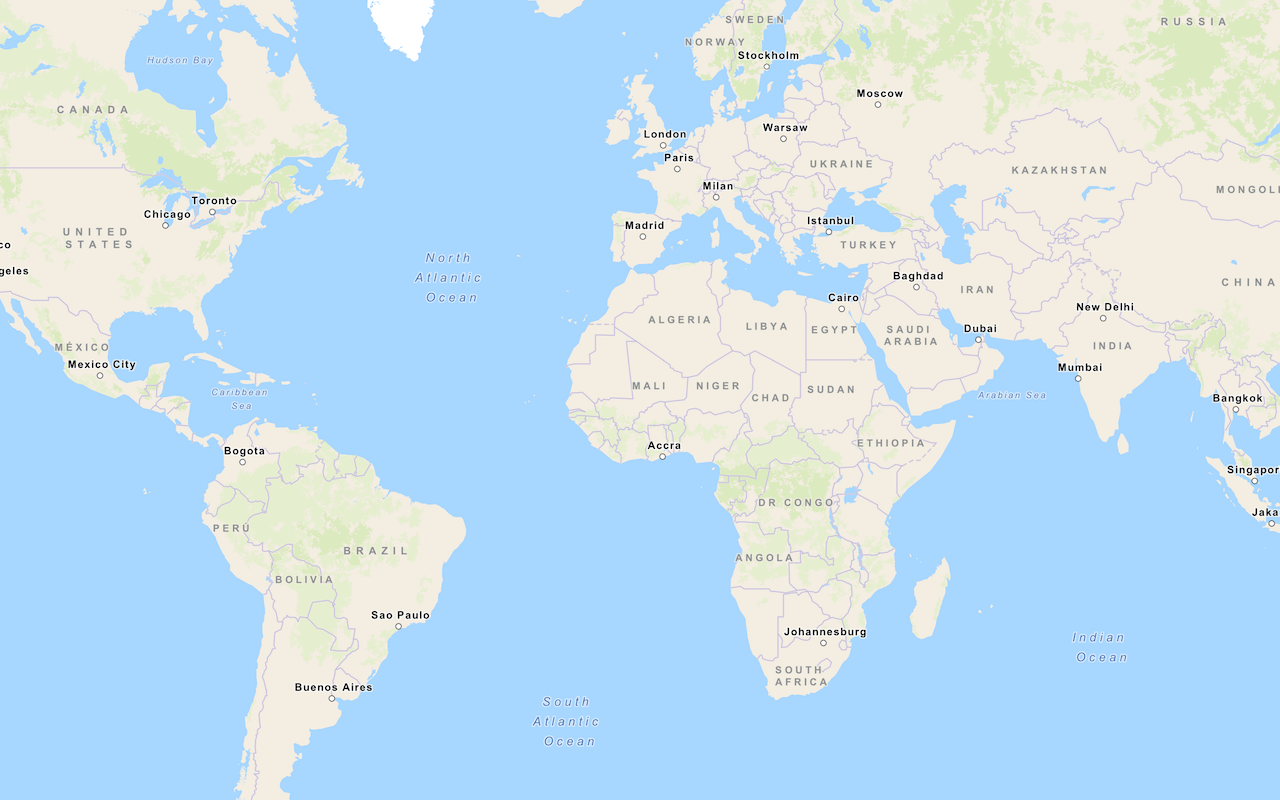
Change the basemap layer
Switch a basemap layer from streets to satellite imagery.
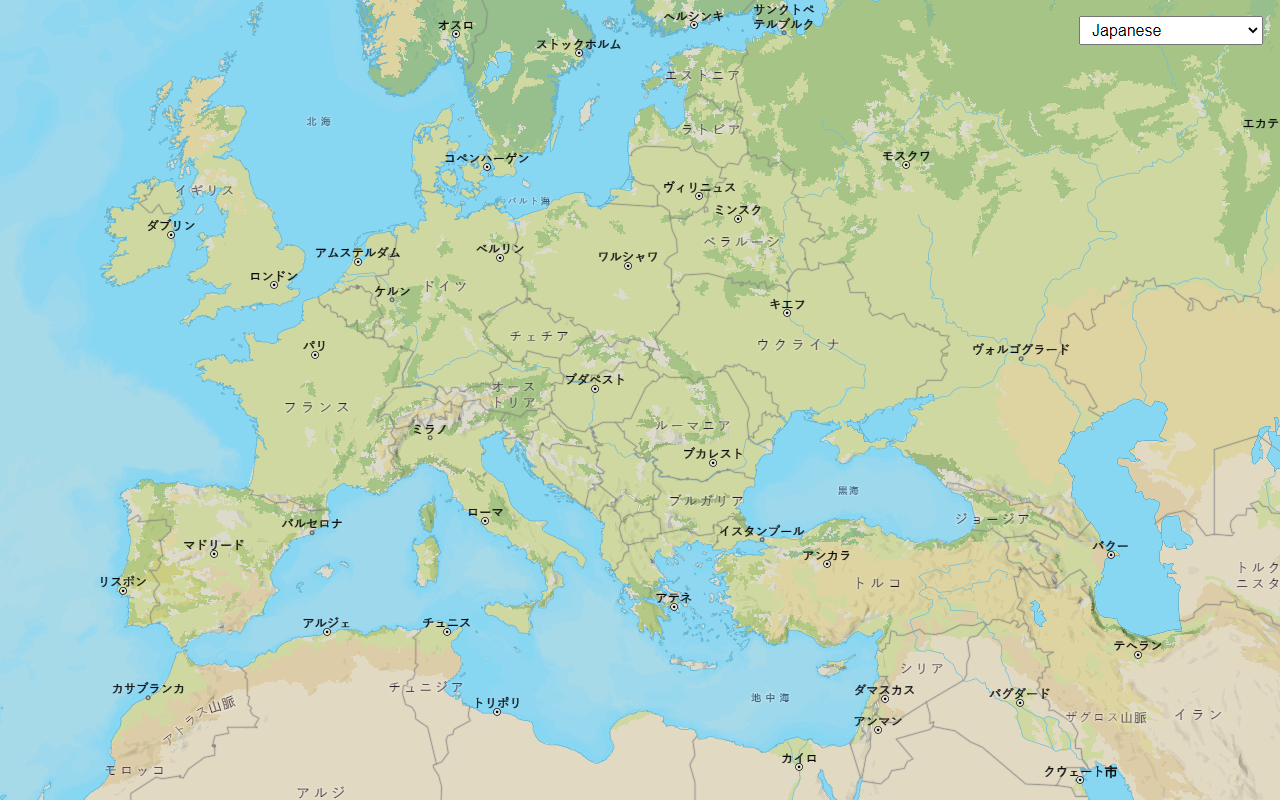
Change the place label language
Switch the language of place labels on a basemap.
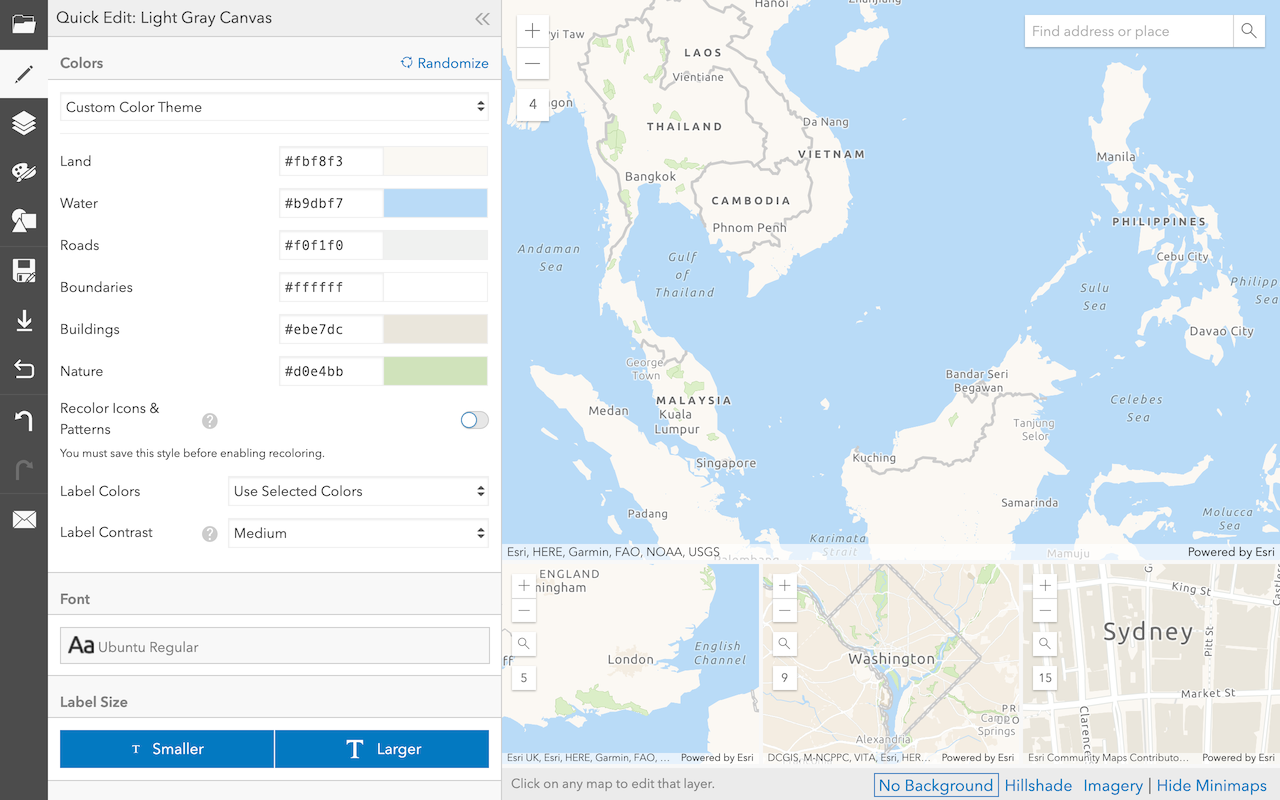
Create a custom basemap style
Use the Vector tile style editor to style a vector tile basemap layer.
Display a custom basemap style
Add and display a styled vector tile basemap layer.

Display a scene
Display a scene with the basemap styles service.
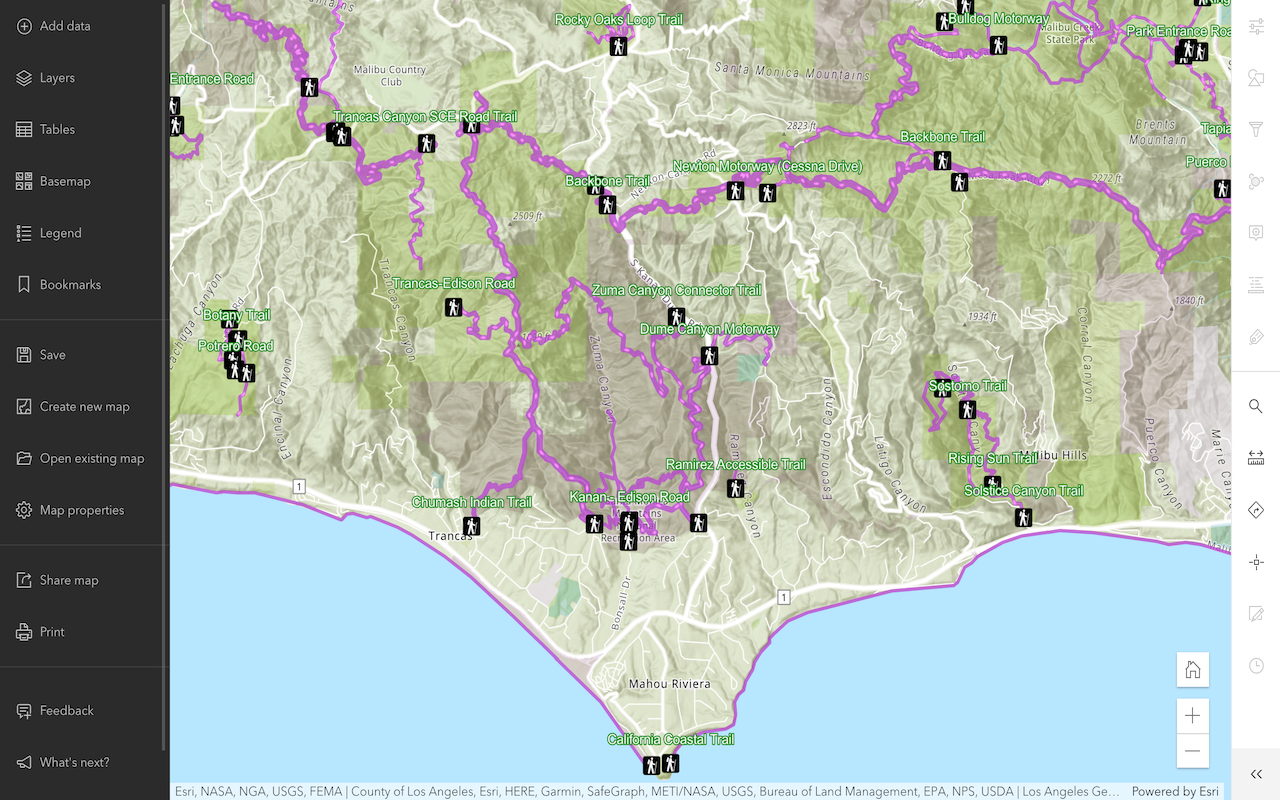
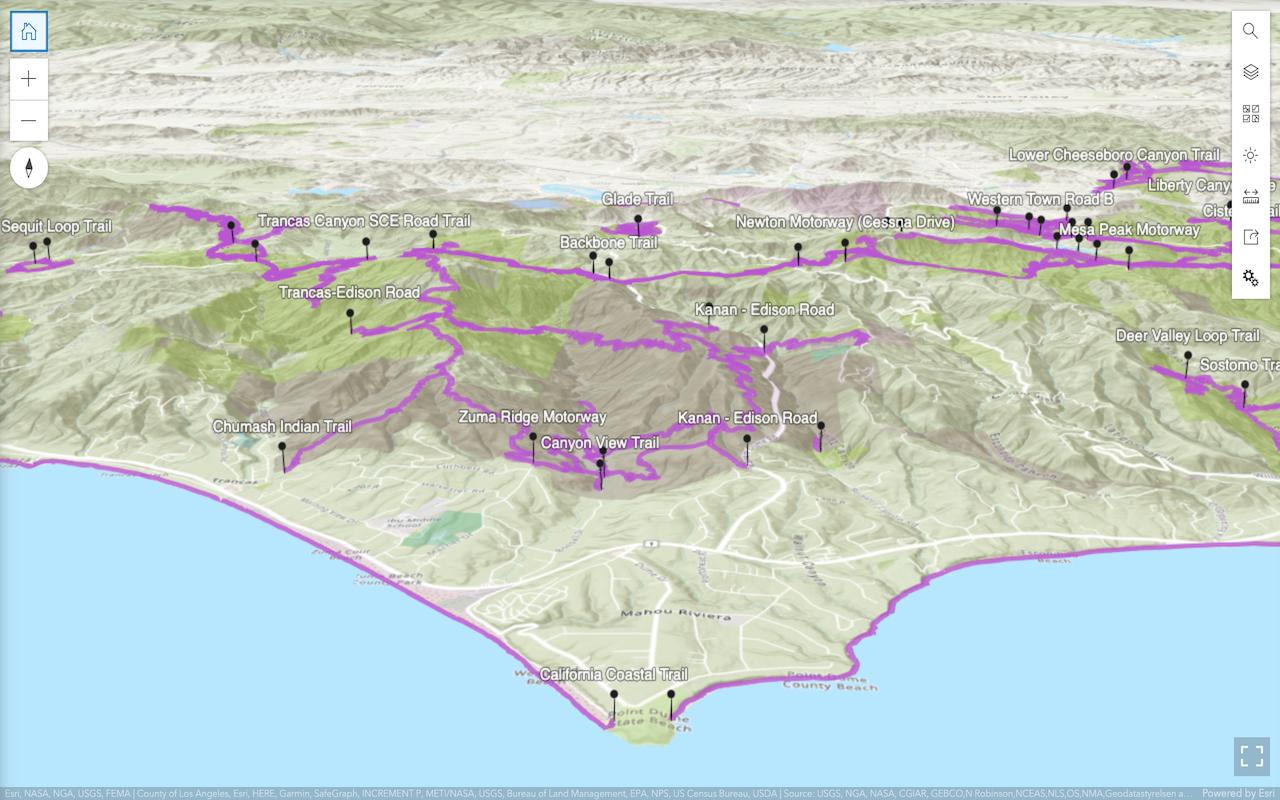
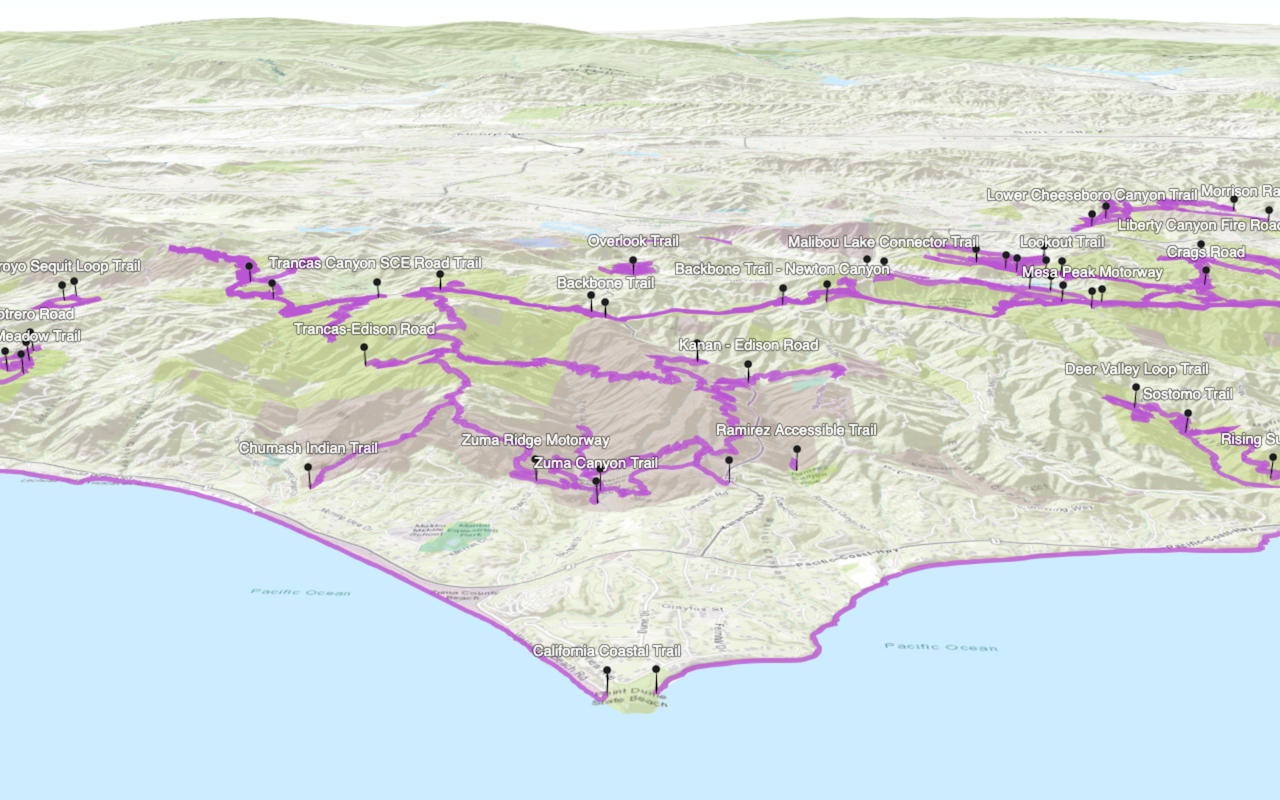
Data layers
Add a point, line, and polygon
Display point, line, and polygon graphics in a map.
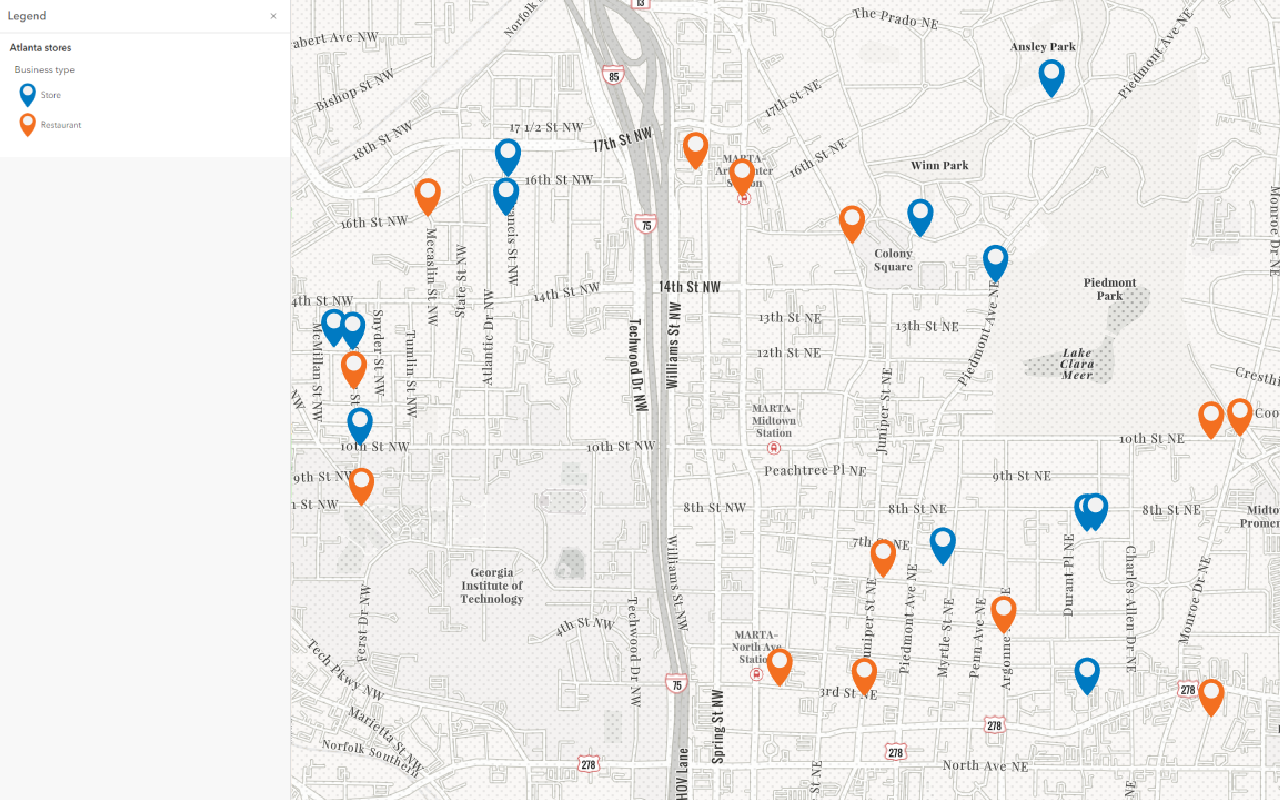
Add a feature layer
Access and display point, line, and polygon features from a feature service.
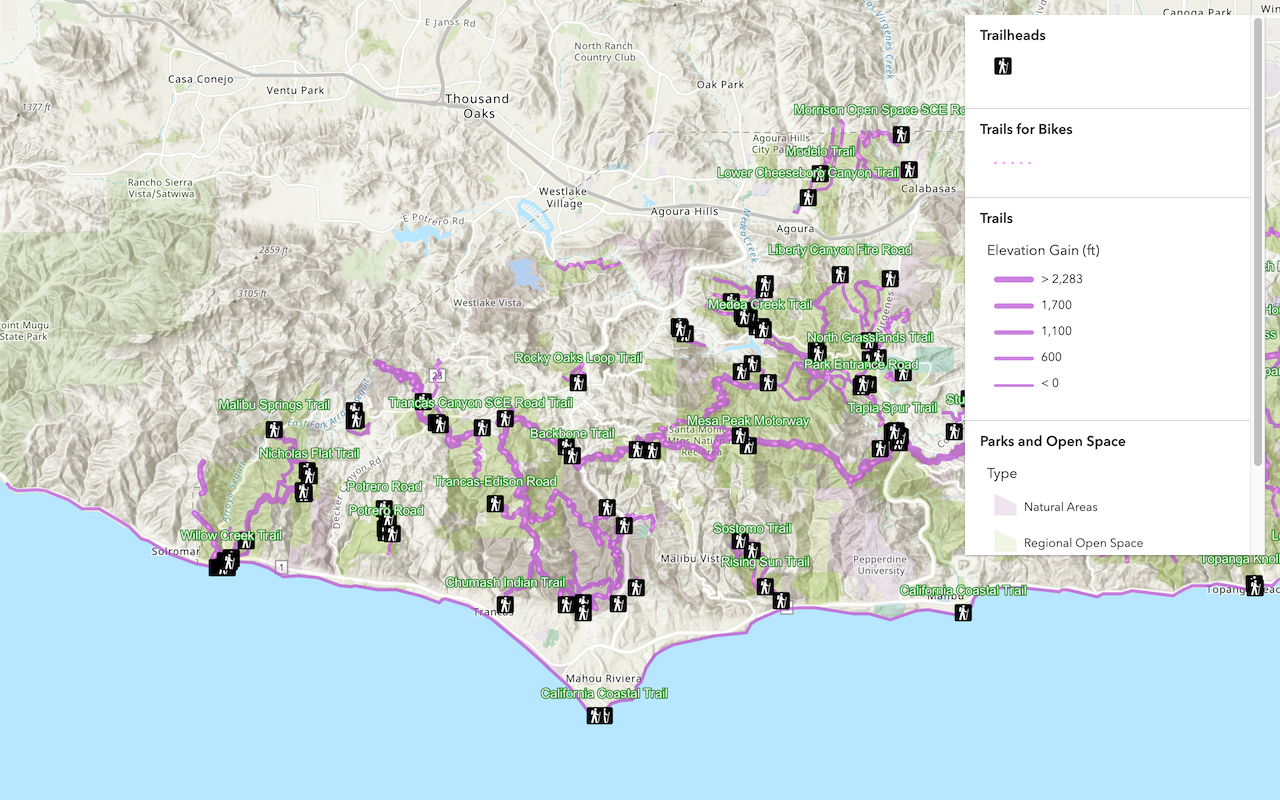
Style a feature layer
Use symbols and renderers to style feature layers.
Add a vector tile layer
Access and display a vector tile layer in a map.
Add a map tile layer
Access and display a map tile layer in a map.

Add a scene layer
Access and display hosted I3S layers from a scene service
Query a feature layer (spatial)
Execute a spatial query to get features from a feature layer.
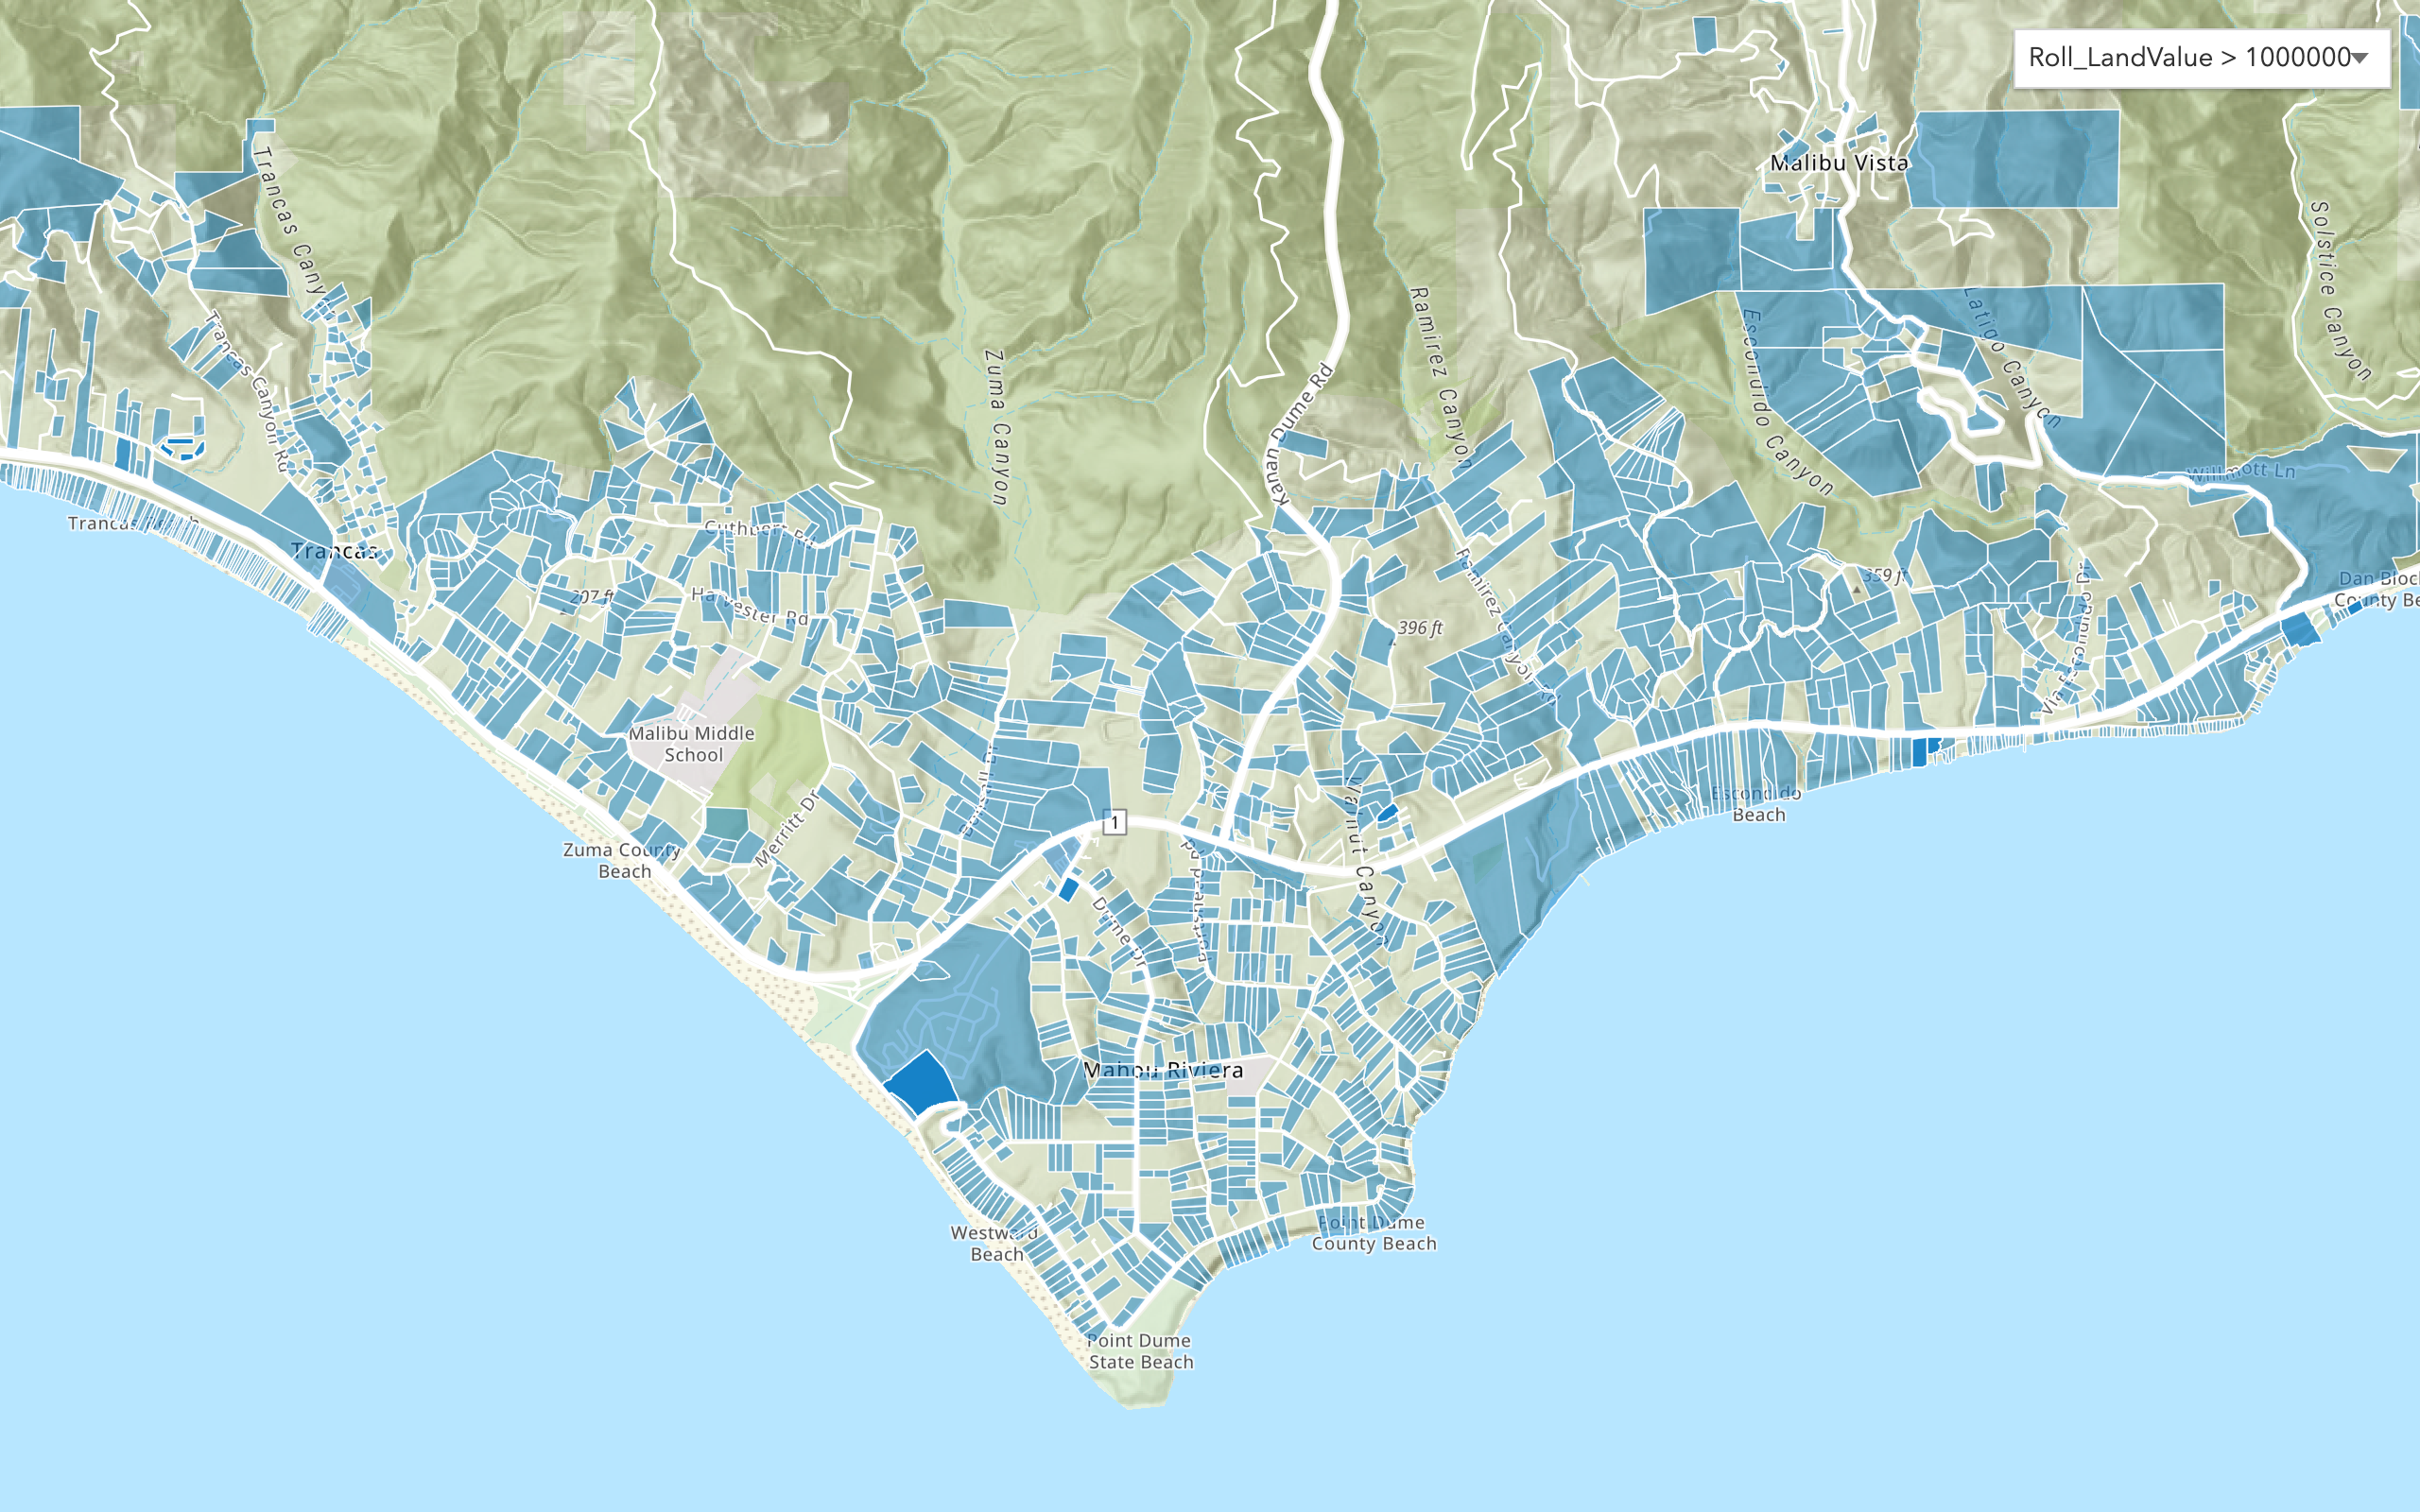
Query a feature layer (SQL)
Execute a SQL query to access polygon features from a feature layer.
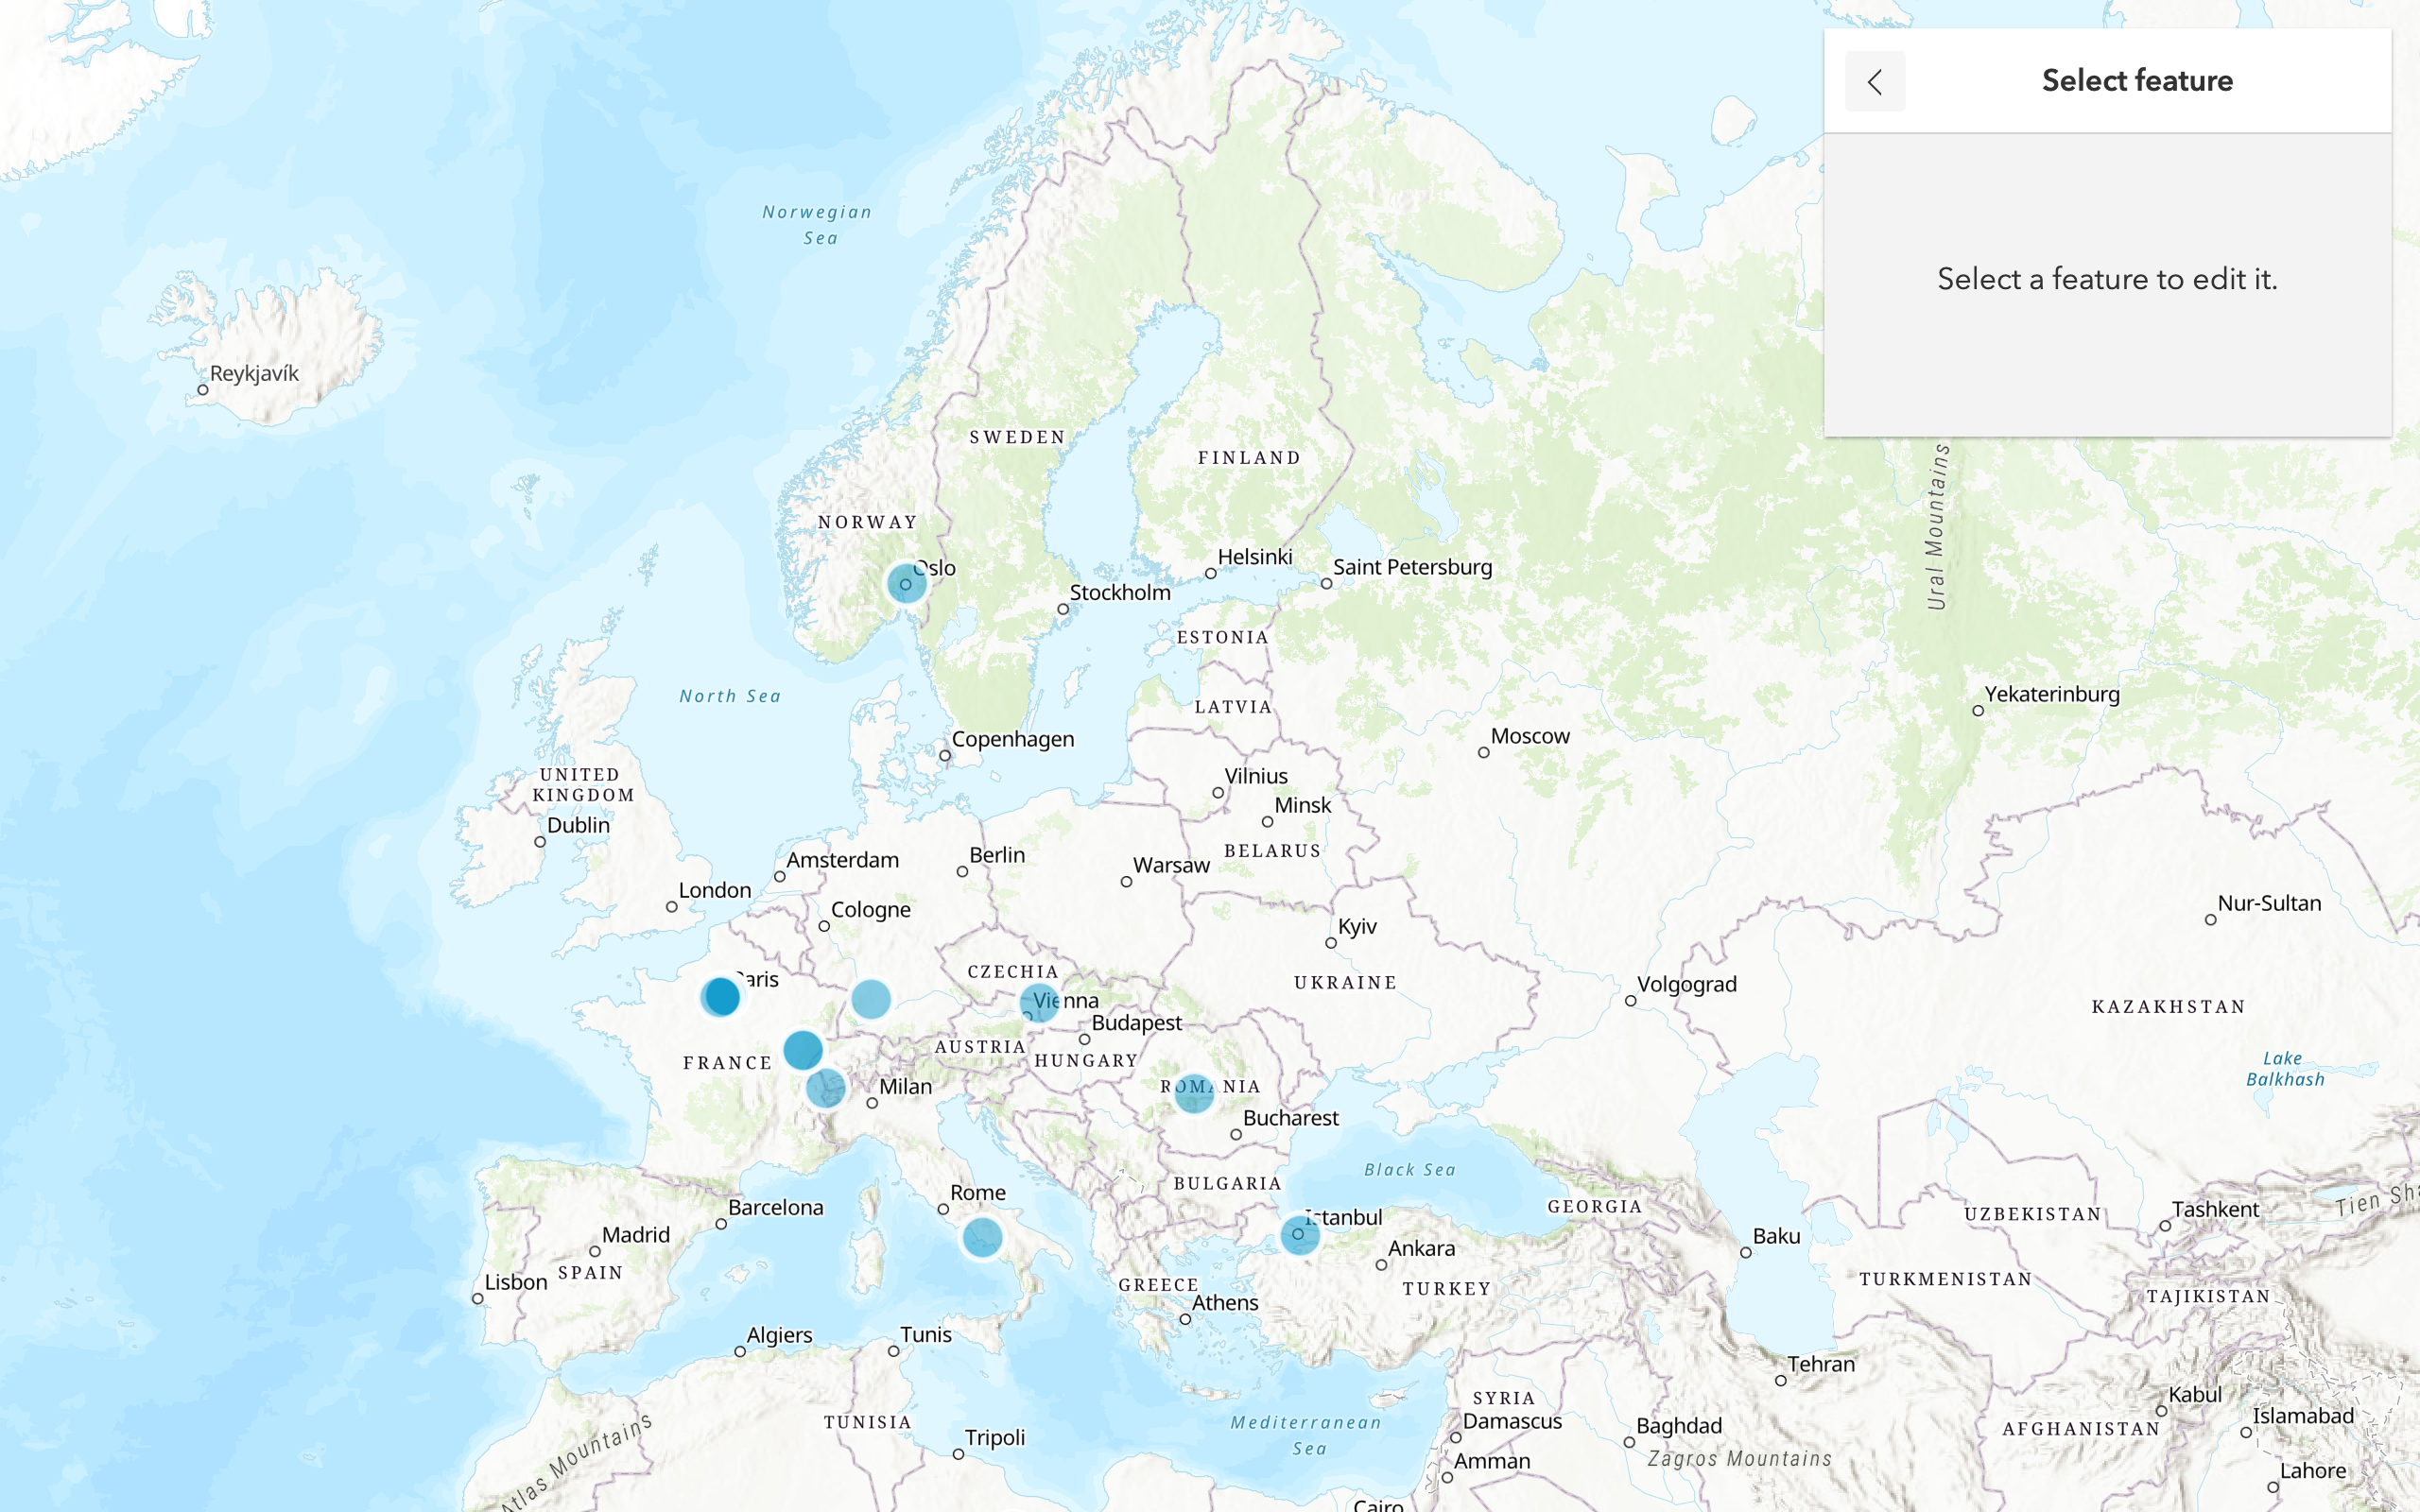
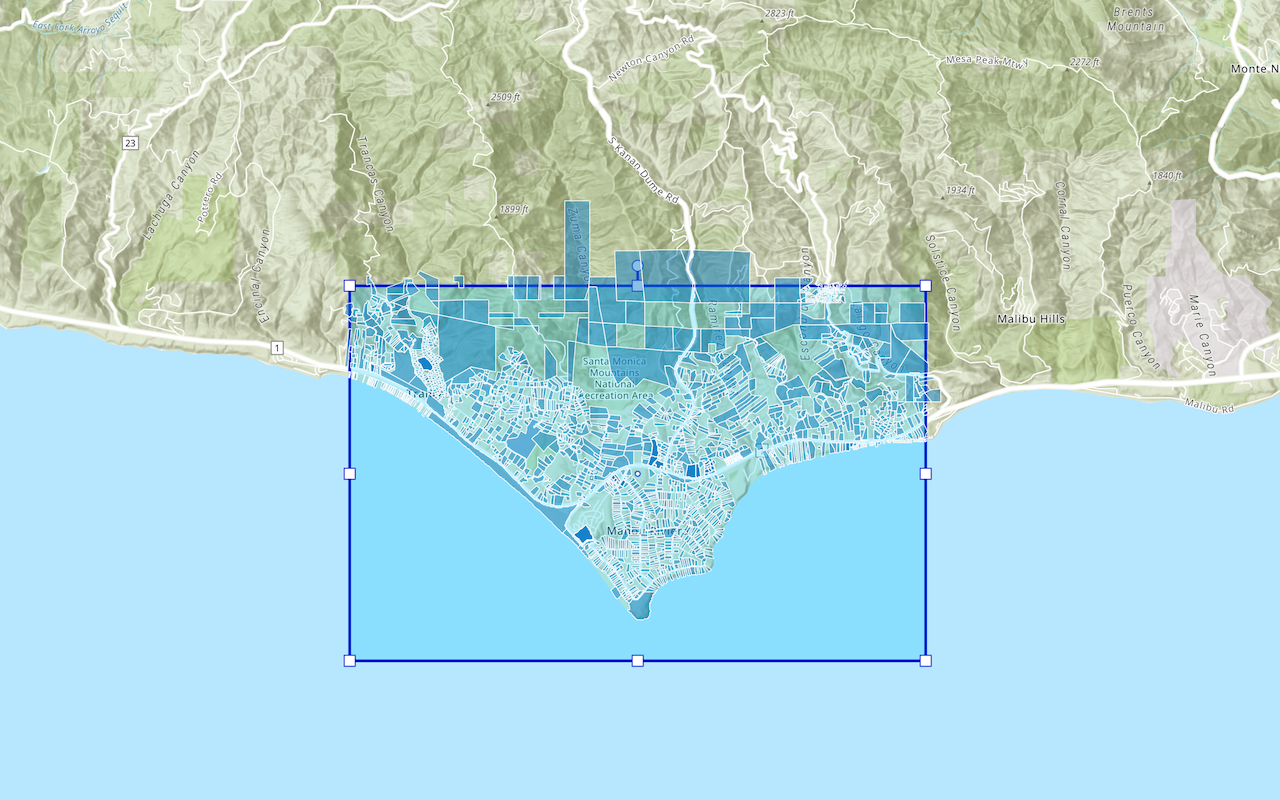
Edit feature data
Add, update, and delete features in a feature service.
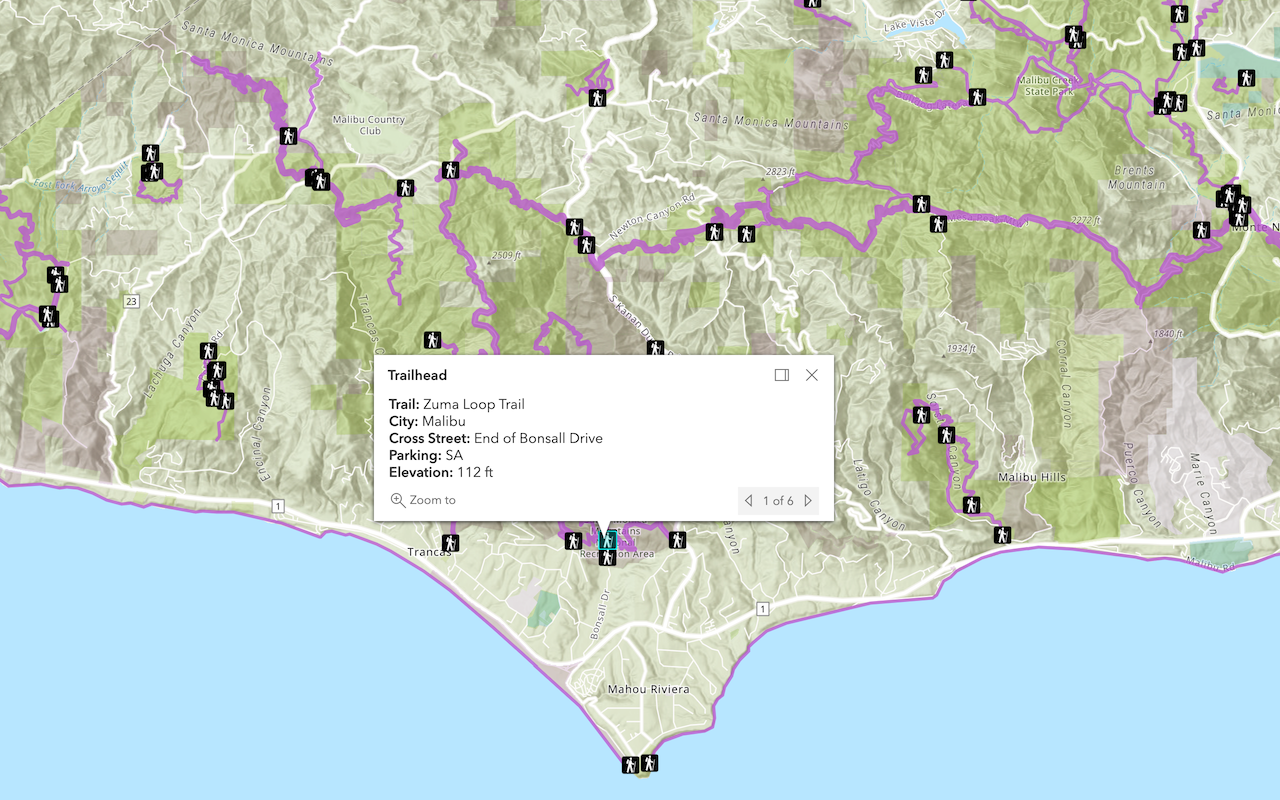
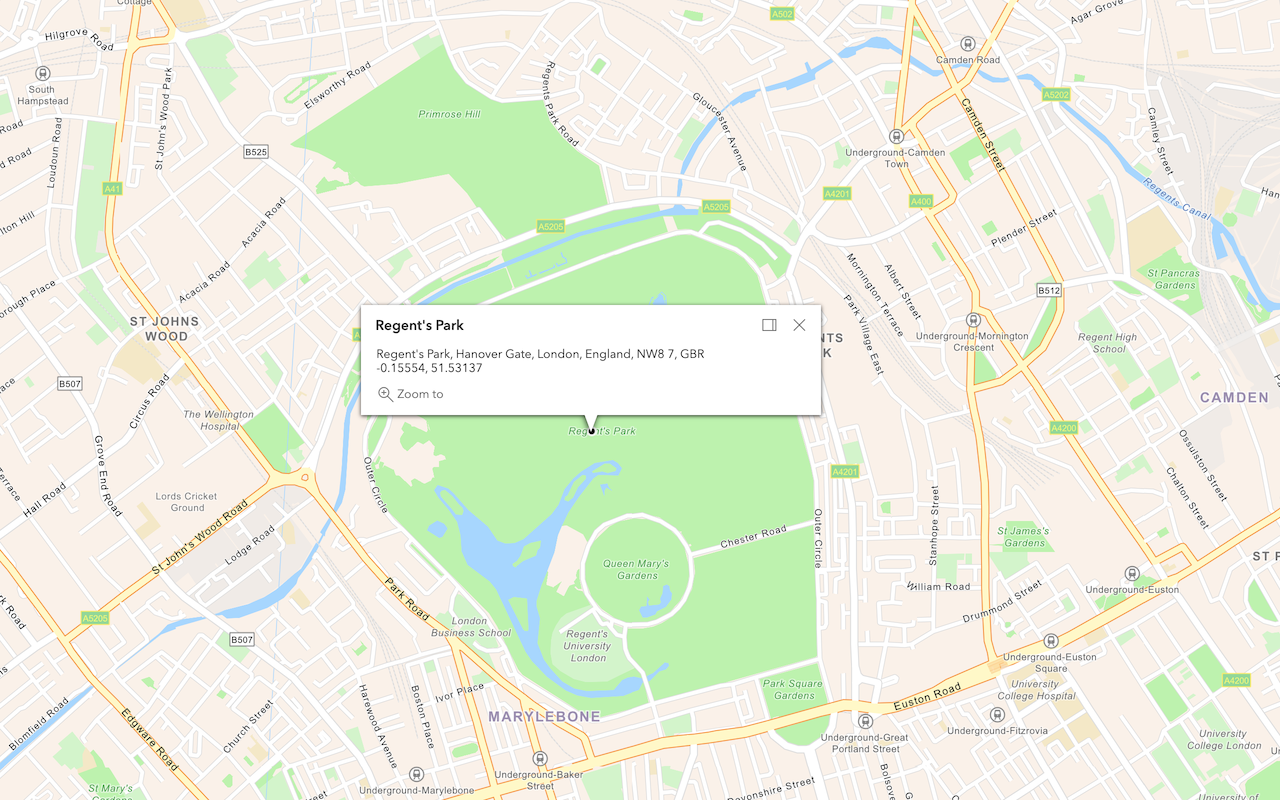
Display a popup
Format a popup to show attributes in a feature layer.
Web maps
Create a web map
Use Map Viewer to create a web map for your application.
Style layers in a web map
Use Map Viewer to style layers in a web map.
Display a web map
Create and display a map from a web map.
Web scenes
Create a web scene
Use Scene Viewer to create a web scene for your application.
Style layers in a web scene
Use Scene Viewer to style layers in a web scene.
Display a web scene
Create and display a scene from a web scene.
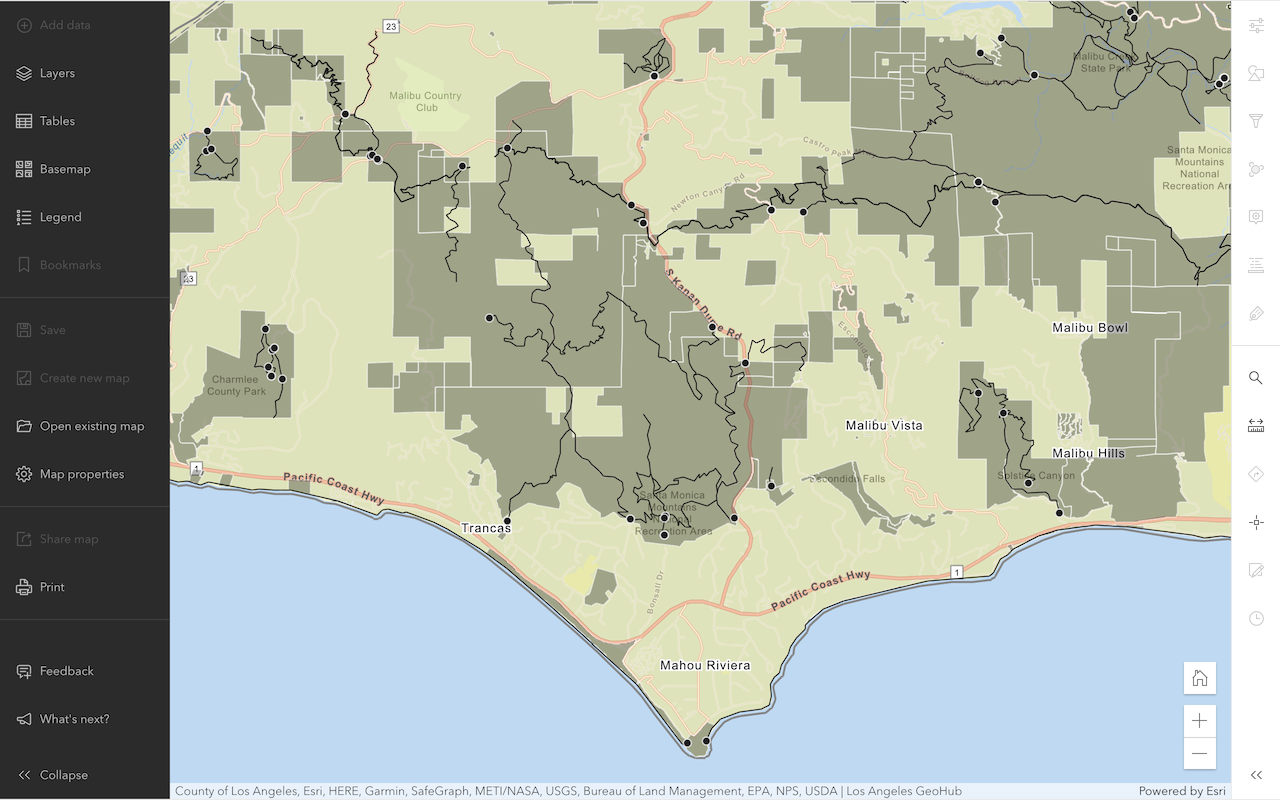
Data hosting
Use tools to host data in ArcGIS and access data services with your applications.
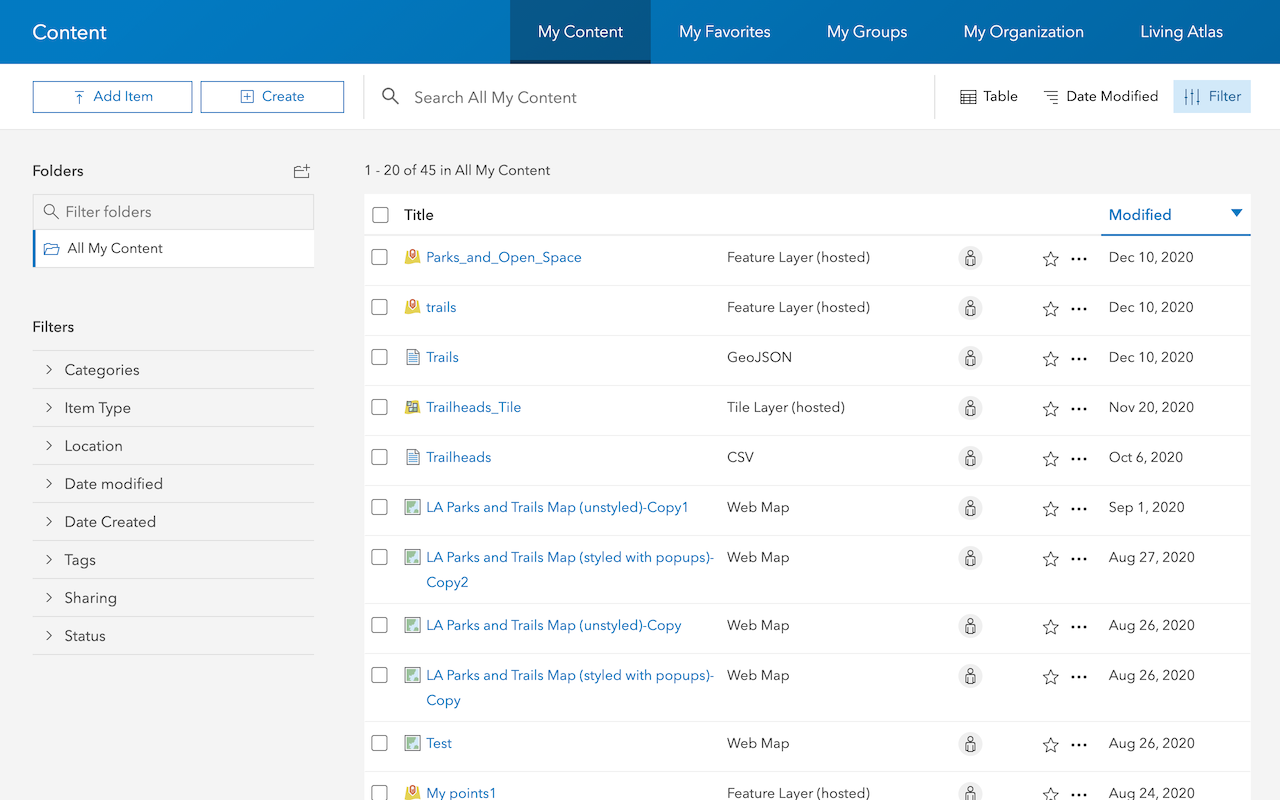
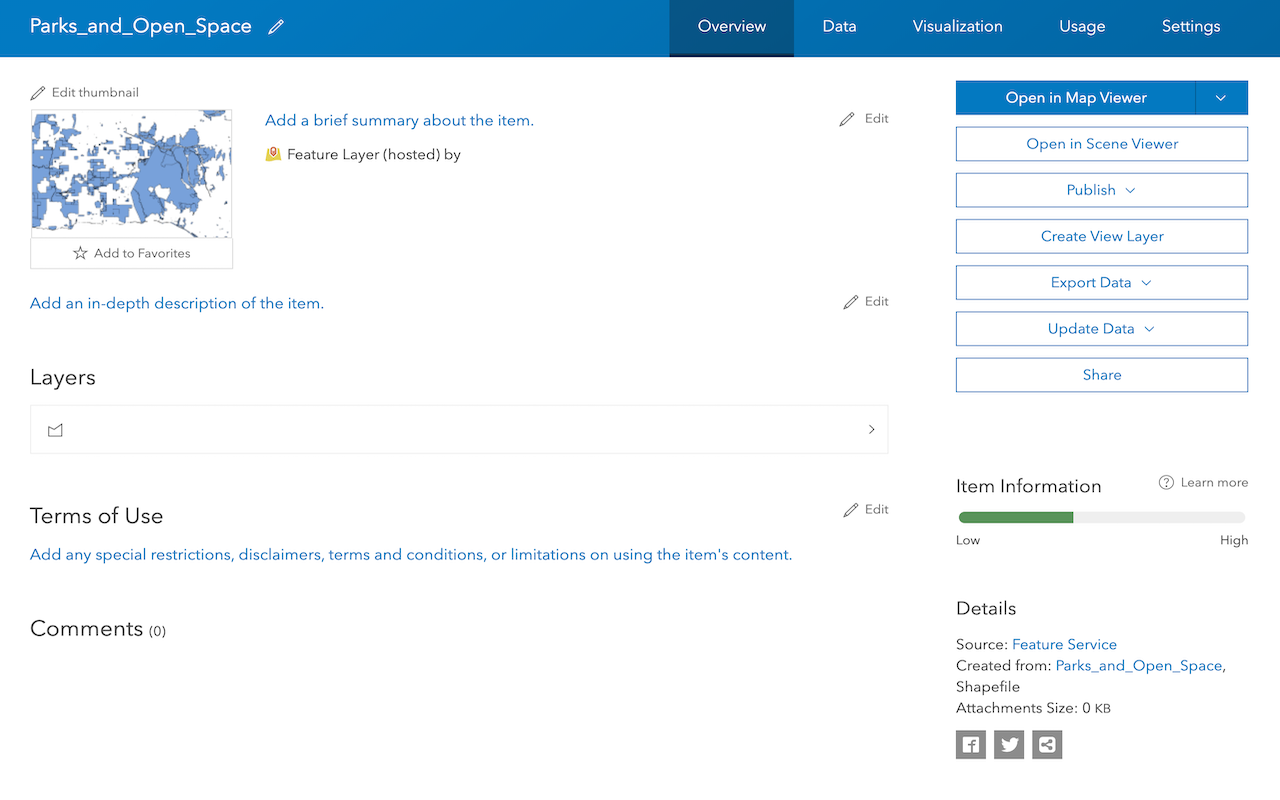
Import data to create a feature layer
Use data management tools to import files and create a feature layer in a feature service.
Manage a feature layer
Use a hosted feature layer item to set the properties and settings of a feature layer in a feature service.
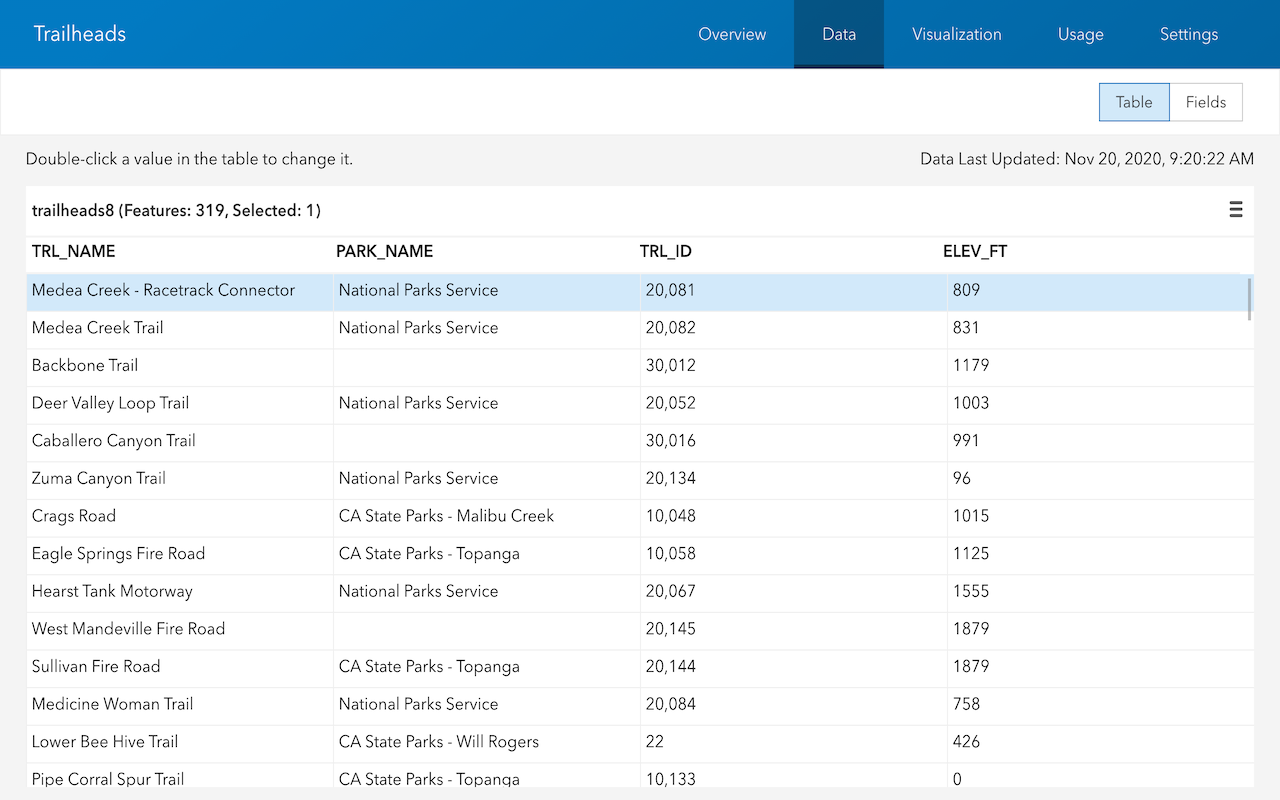
Access features in a feature service
Use ArcGIS Online tools to access and display features in a feature layer.
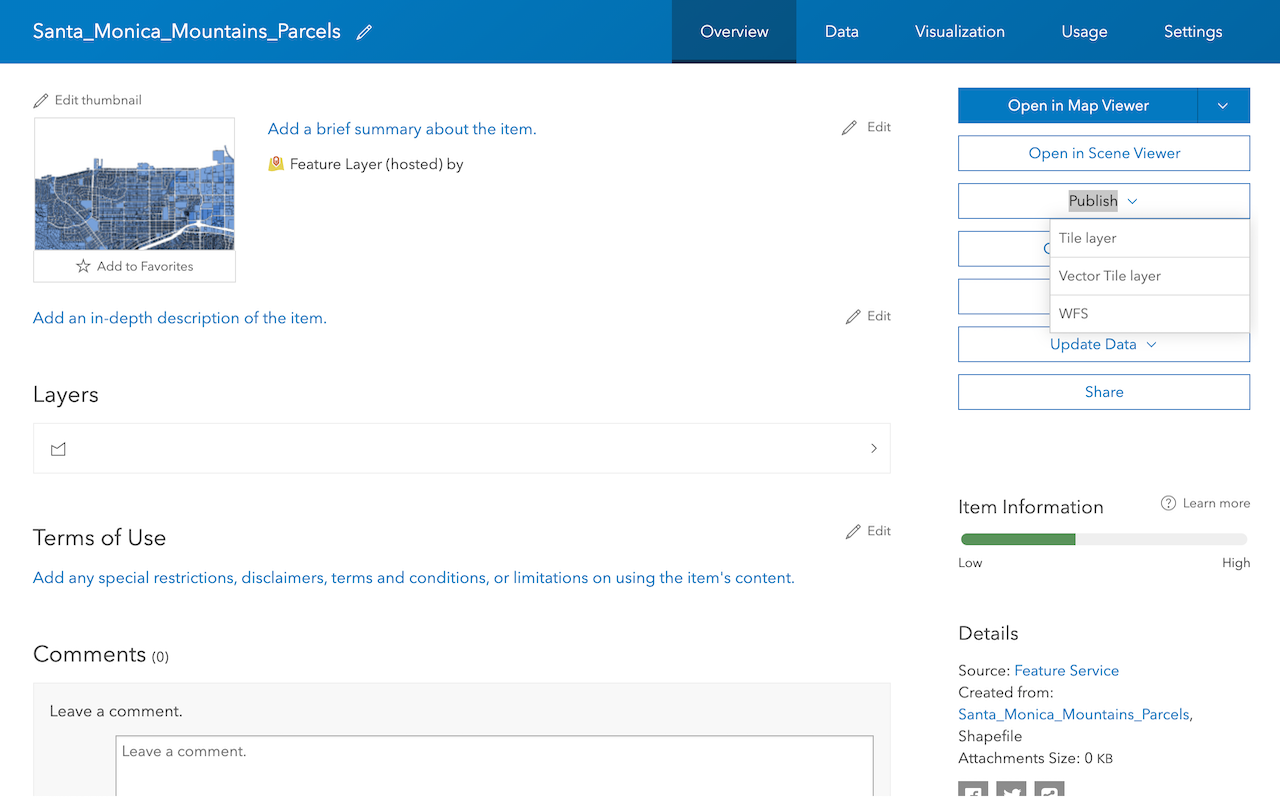
Create a vector tile service
Use data management tools to create a new vector tile service from a feature service.
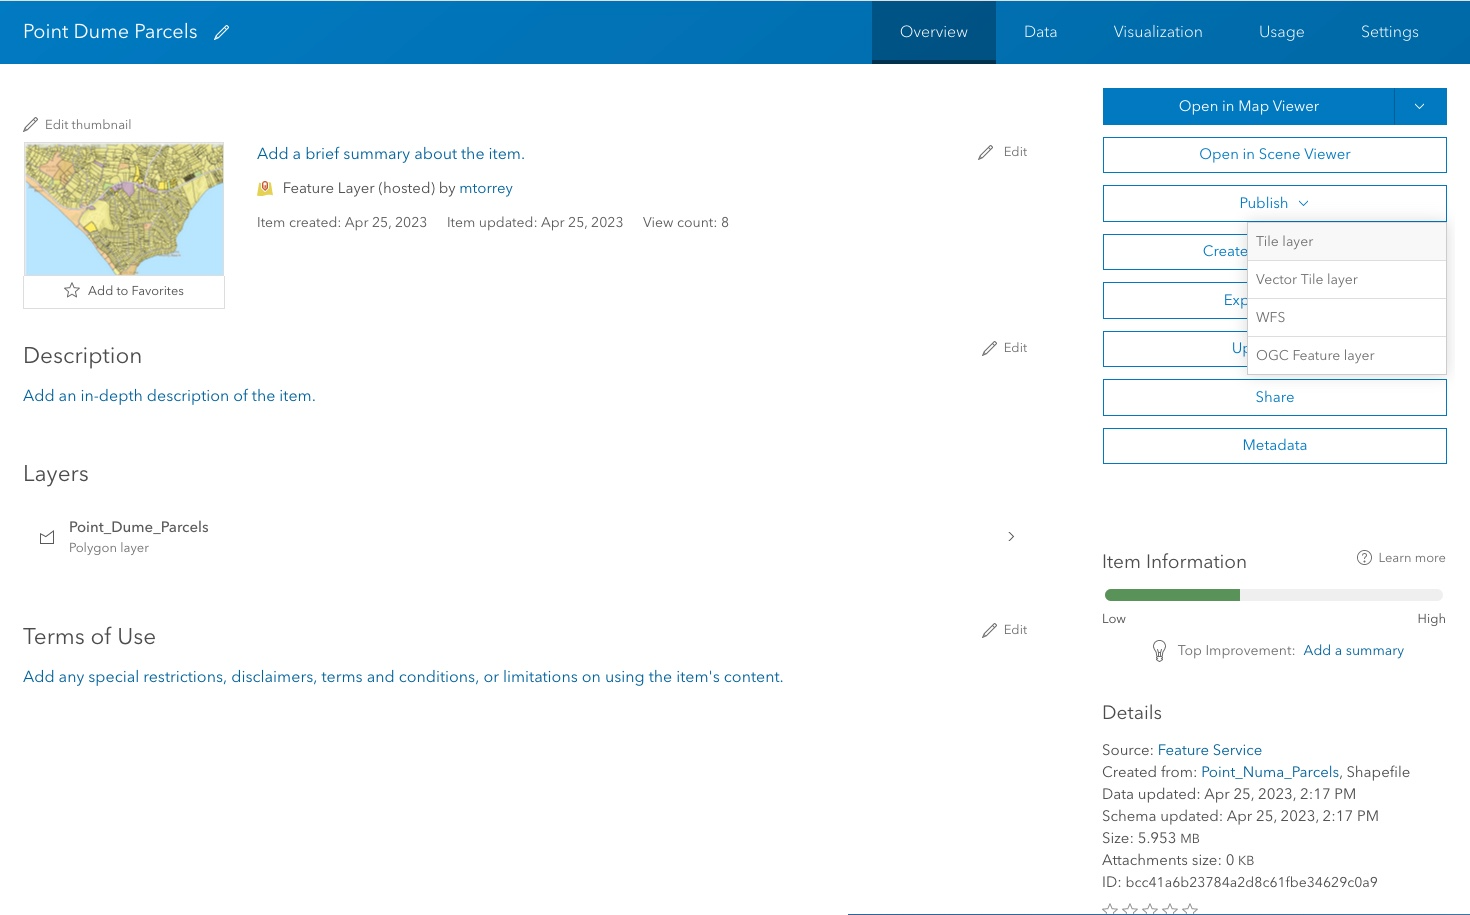
Create a map tile service
Use ArcGIS Online or scripting APIs to publish a map tile service.
Places
Find points of interest (POI) and get detailed information about them with the places service.
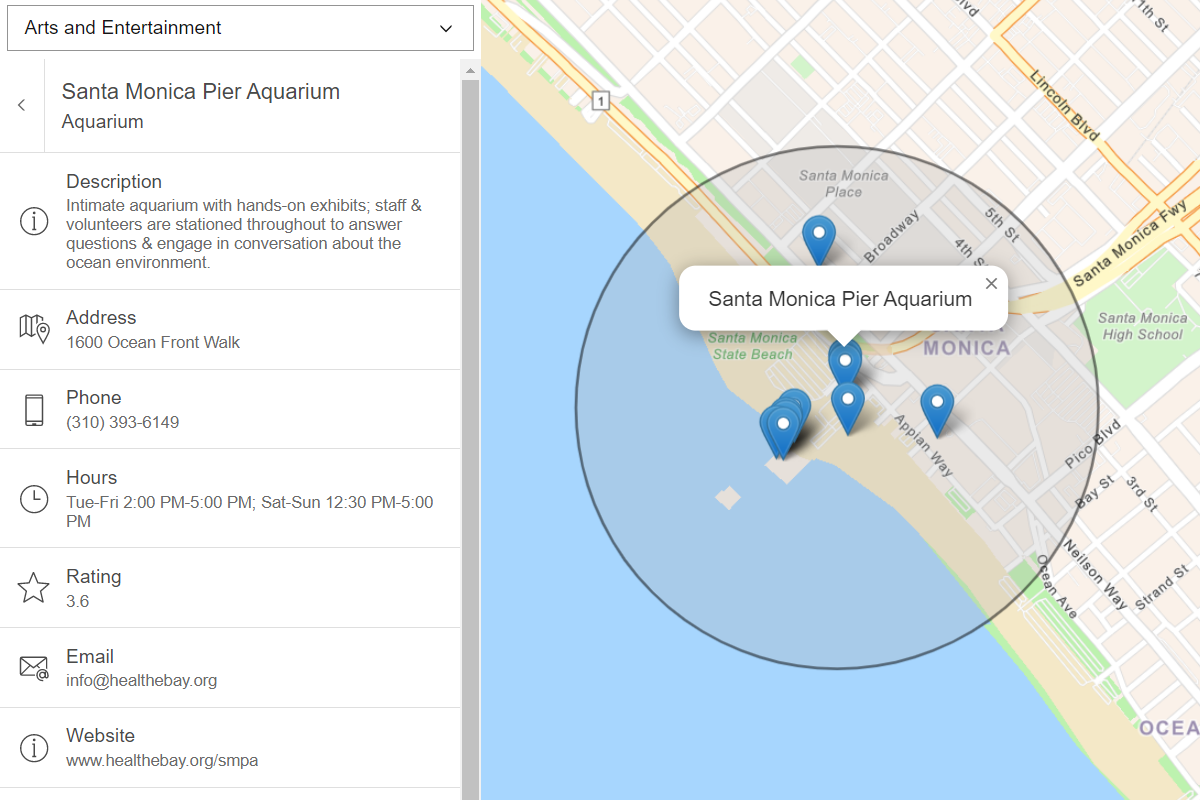
Find nearby places and details
Find points of interest near a location and get detailed information about them
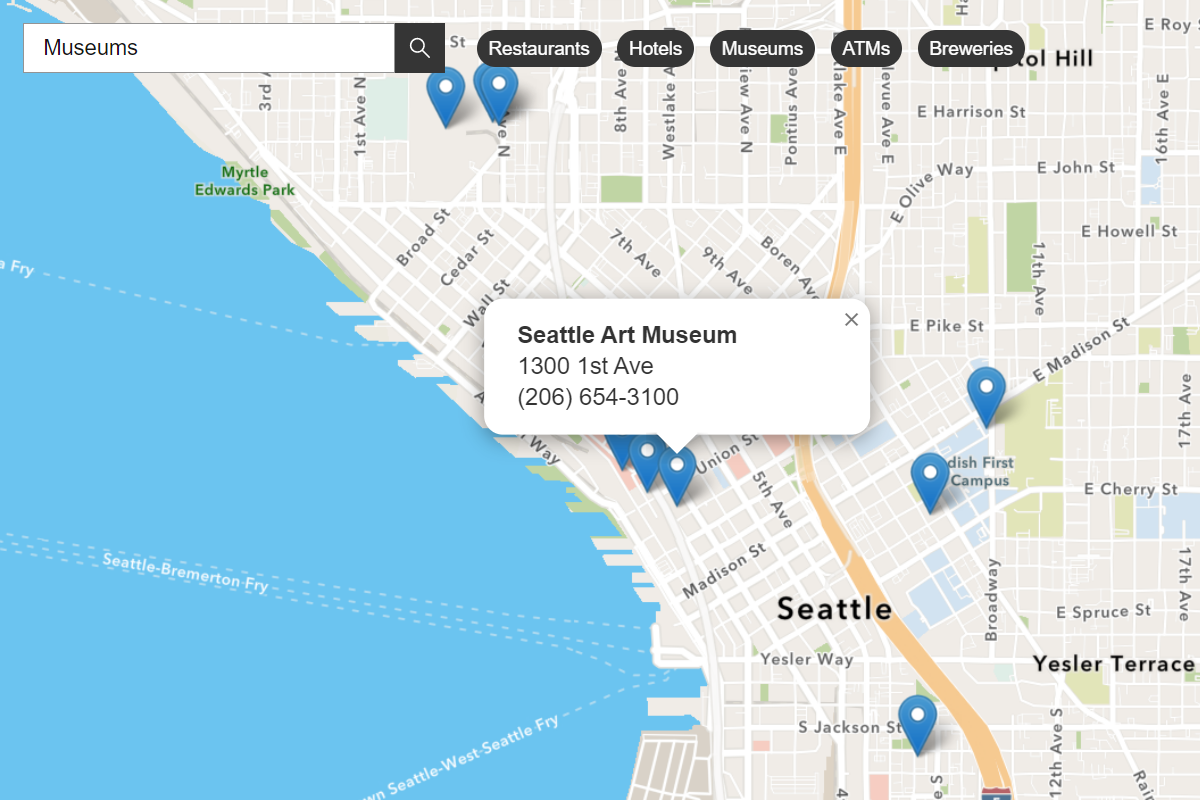
Find places in a bounding box
Perform a text-based search to find places within a bounding box.
Search
Find addresses, businesses, and places with the geocoding service.
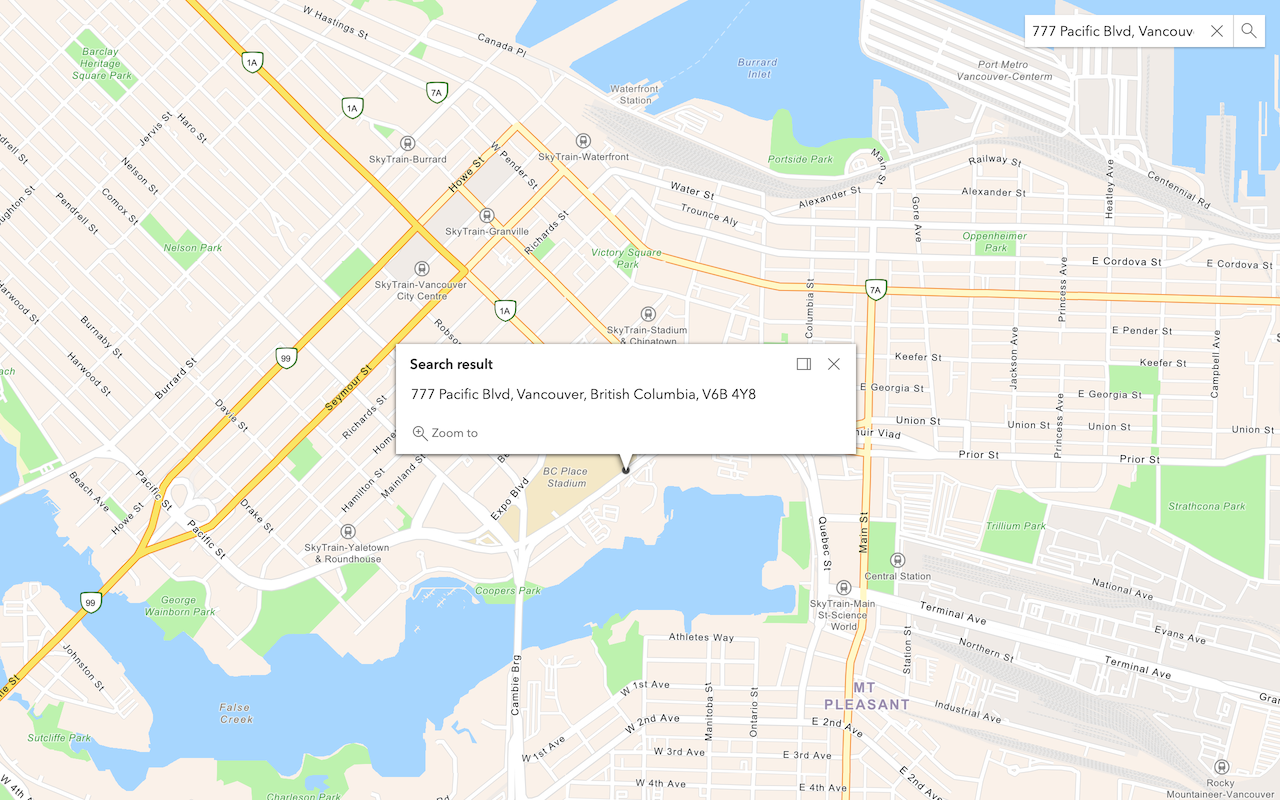
Search for an address
Convert an address or place to a location with the geocoding service.
Find place addresses
Find an address, business, or place with the geocoding service.
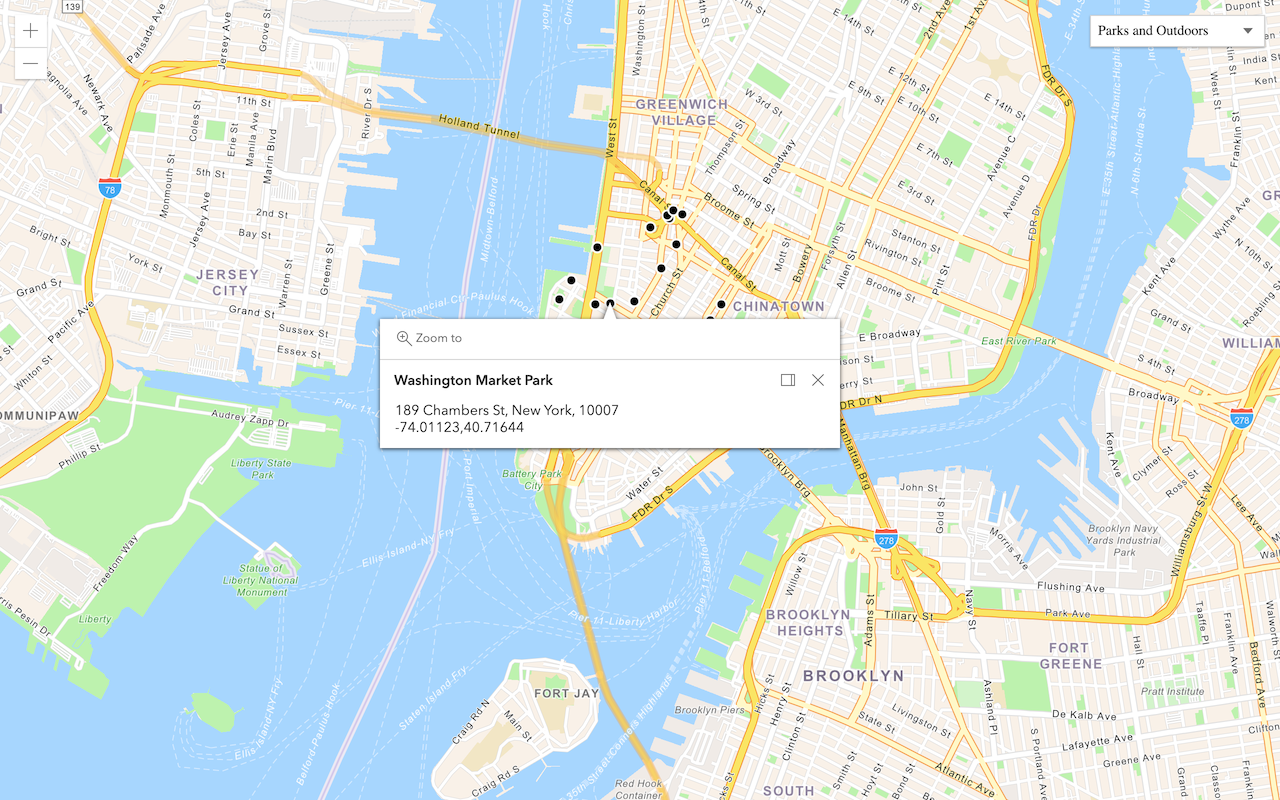
Reverse geocode
Get an address, business, or place from coordinates with the geocoding service.
Display your location
Find and track your device location on a map.
Routing
Find routes and directions and perform advanced analyses with the routing service.
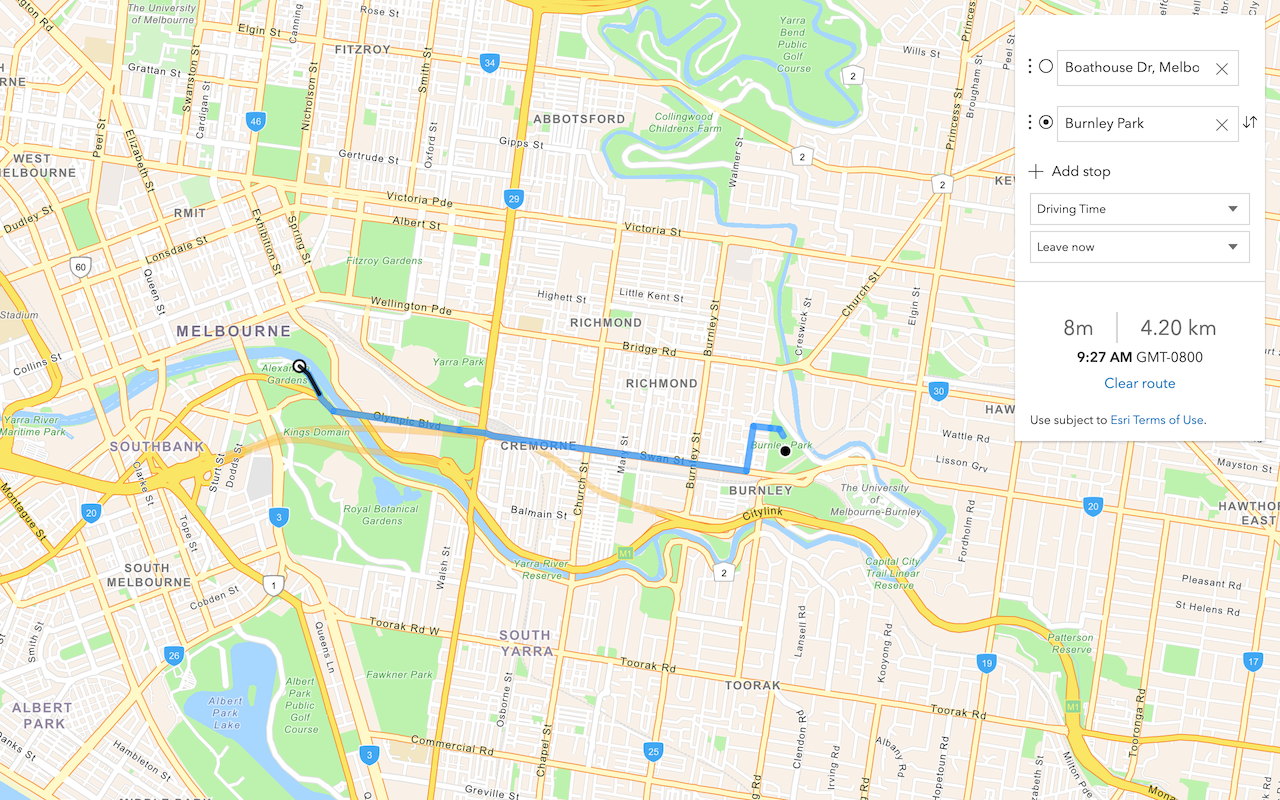
Find a route and directions
Find a route and directions with the routing service.
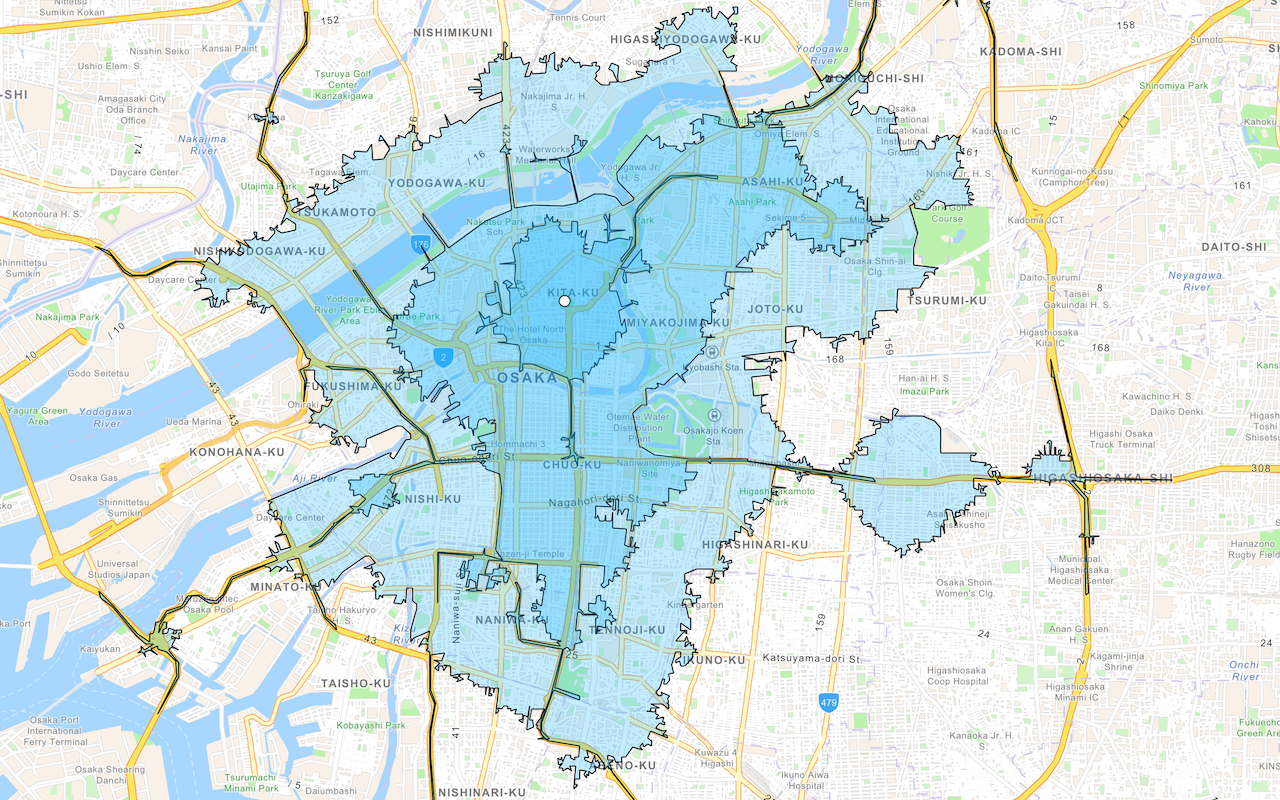
Find service areas
Create an isochrone with driving distance with the routing service.
Data enrichment
Discover facts and information for places with the GeoEnrichment service.
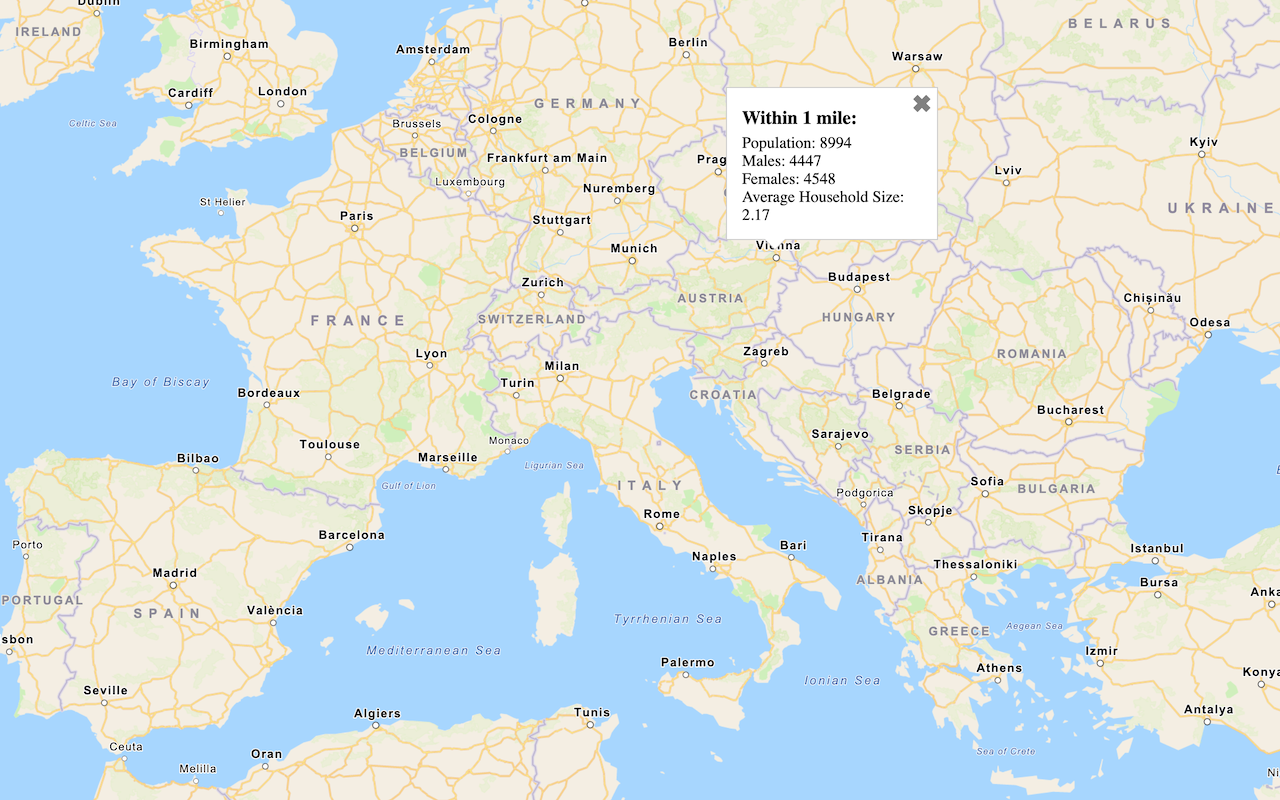
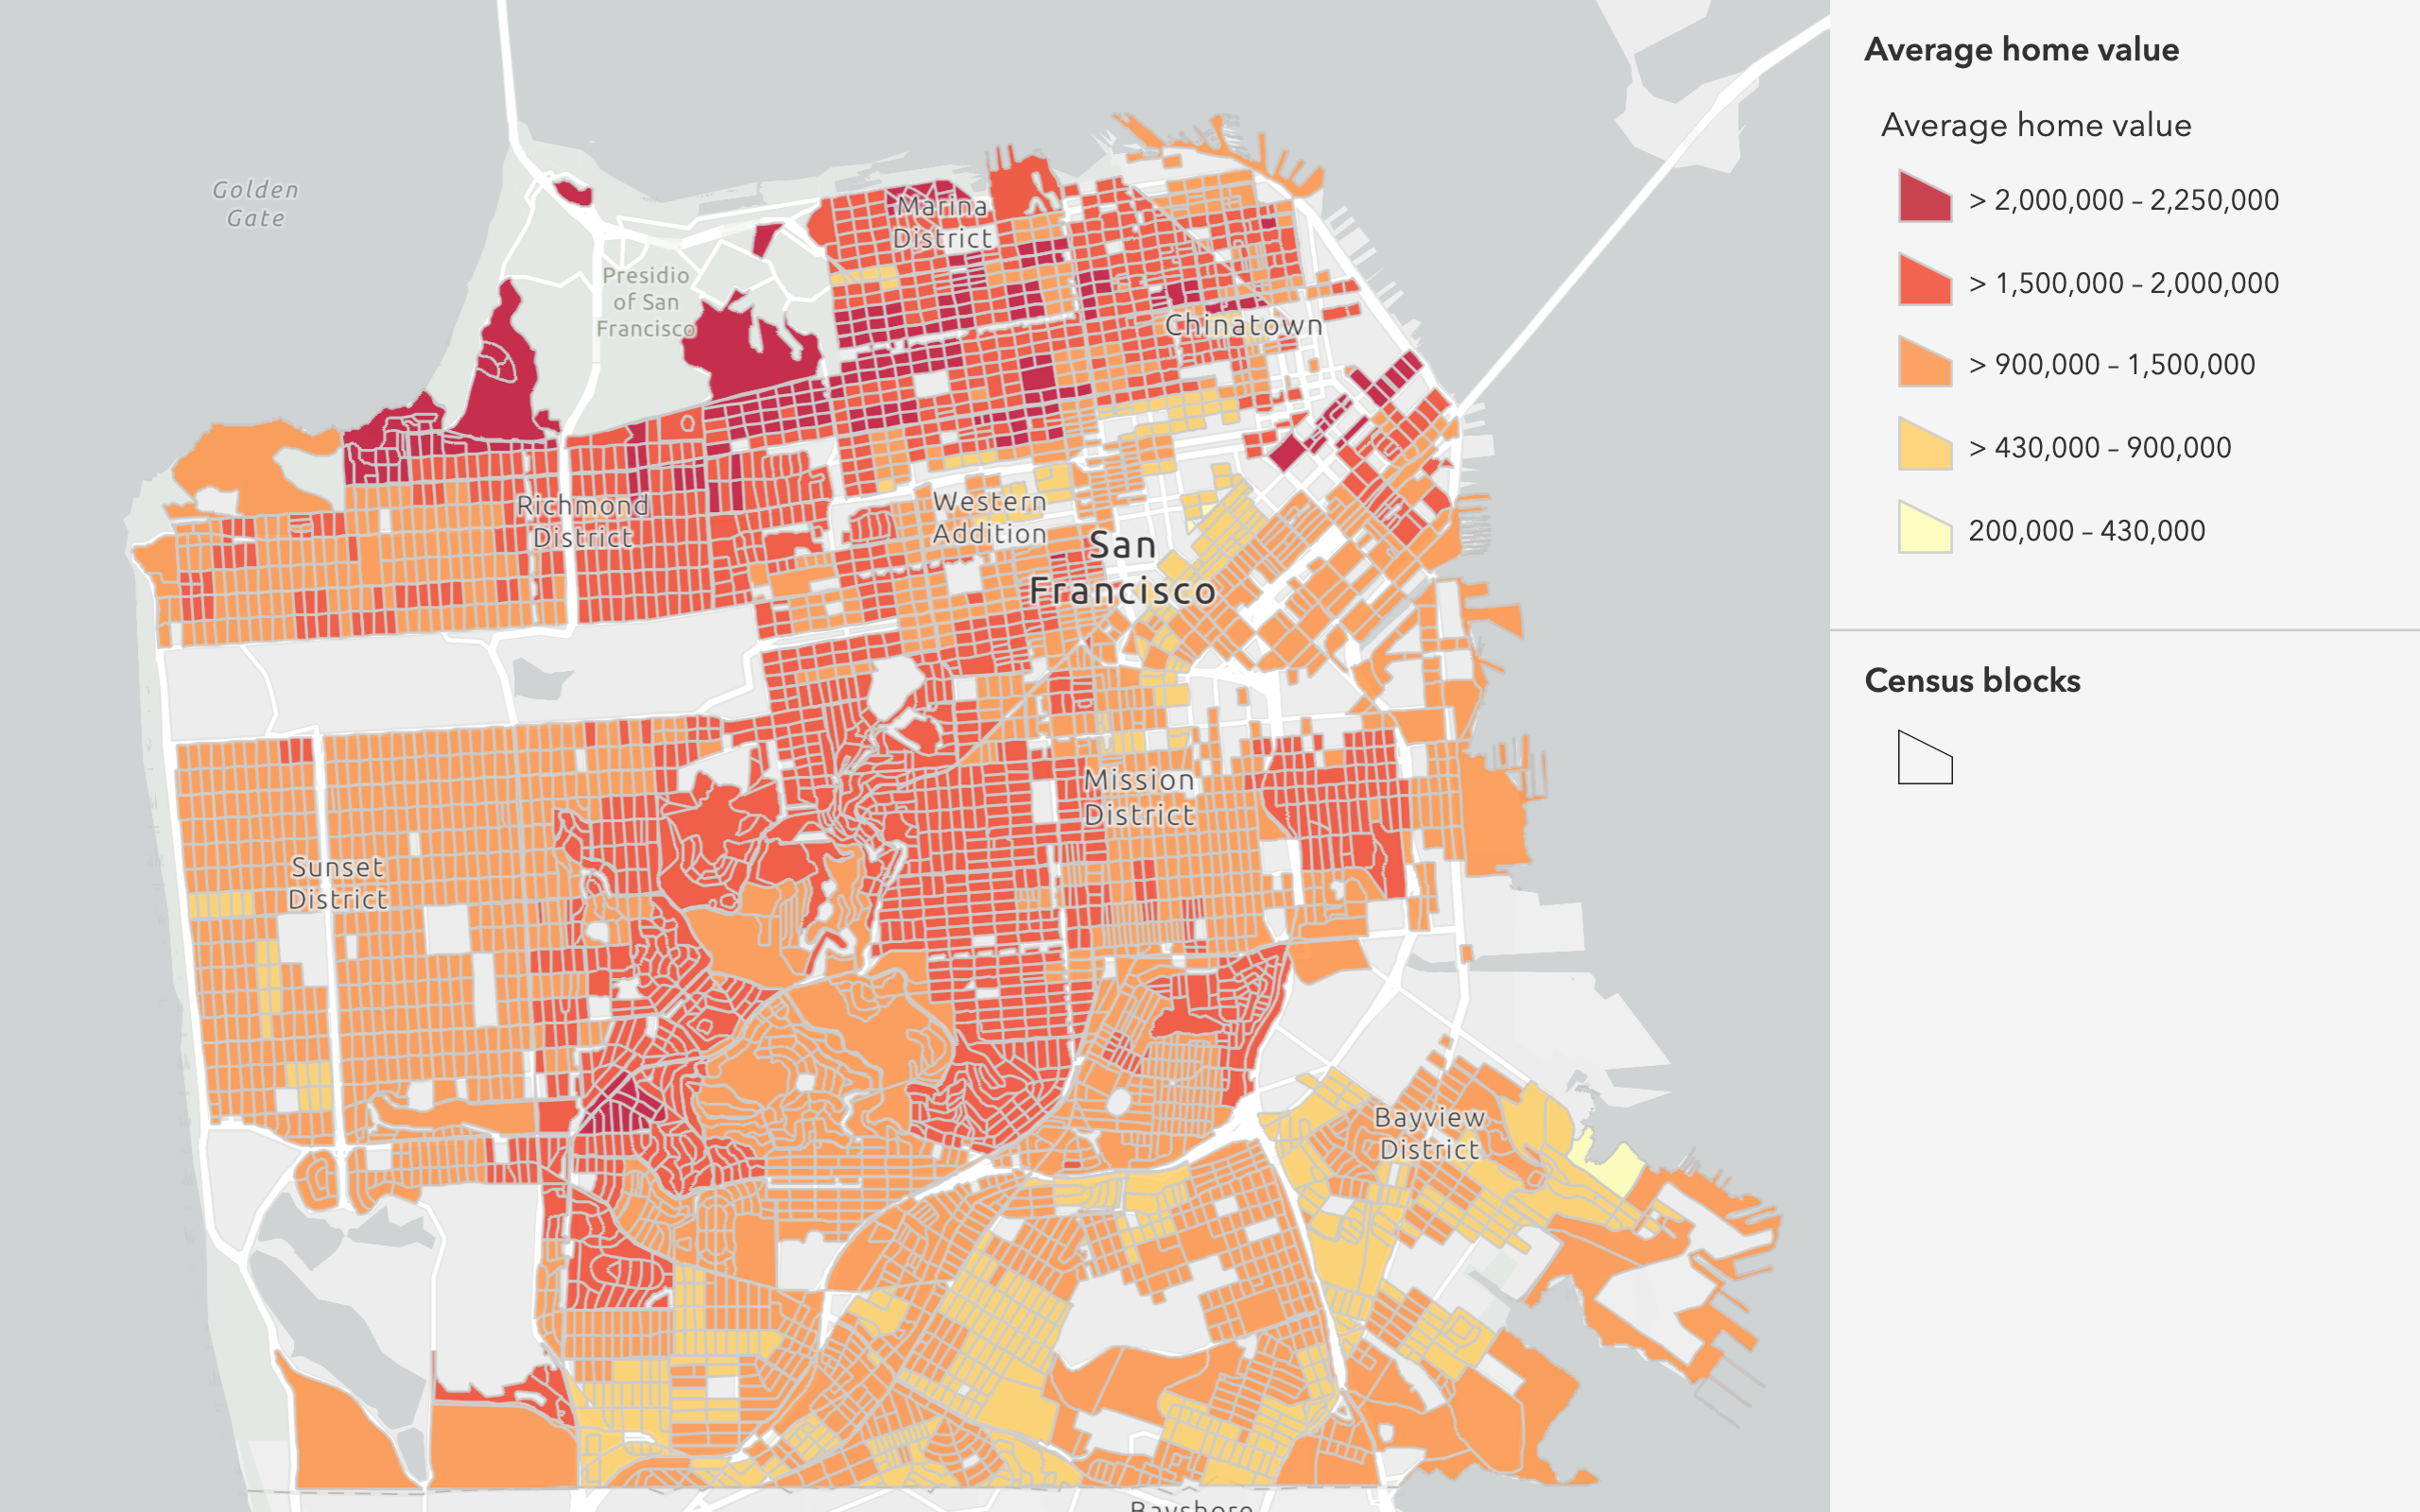
Query demographic data
Query demographic information for locations around the world with the GeoEnrichment service.
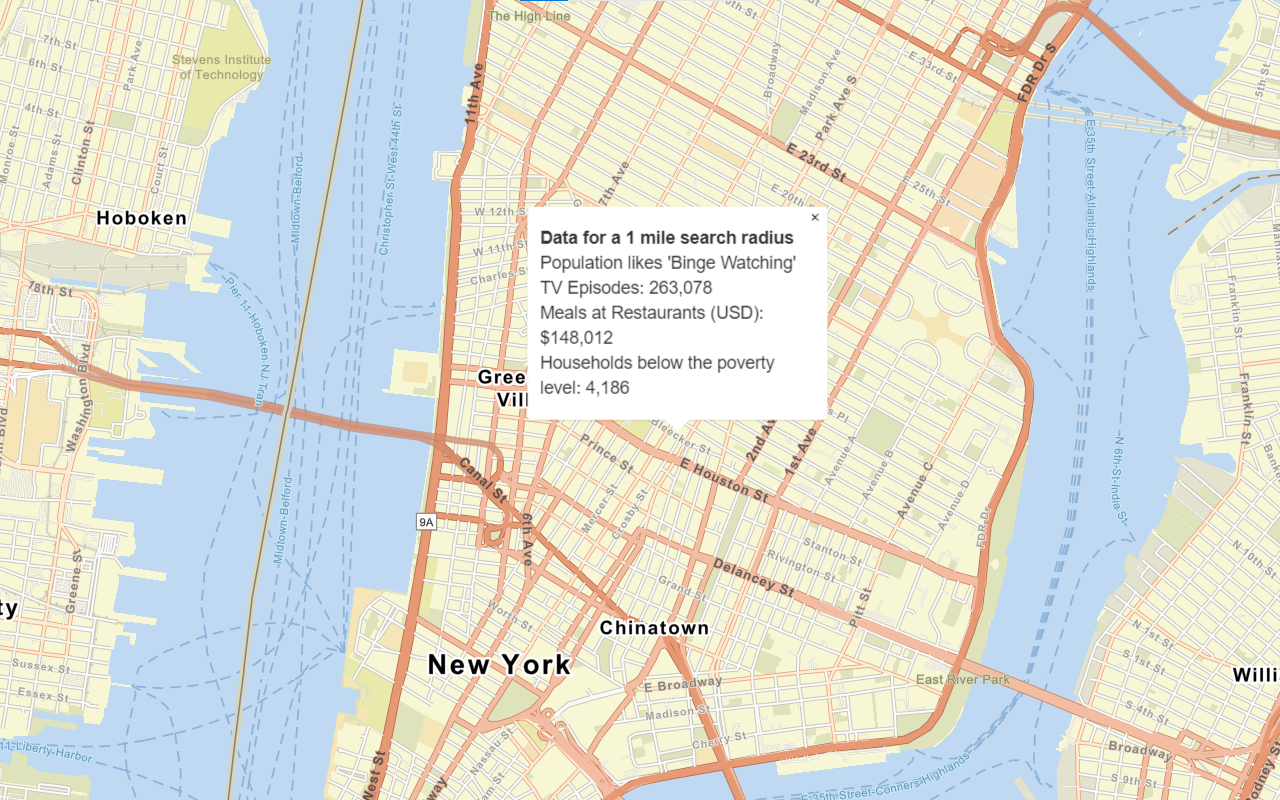
Get local data
Query local analysis variables in select countries around the world with the GeoEnrichment service.

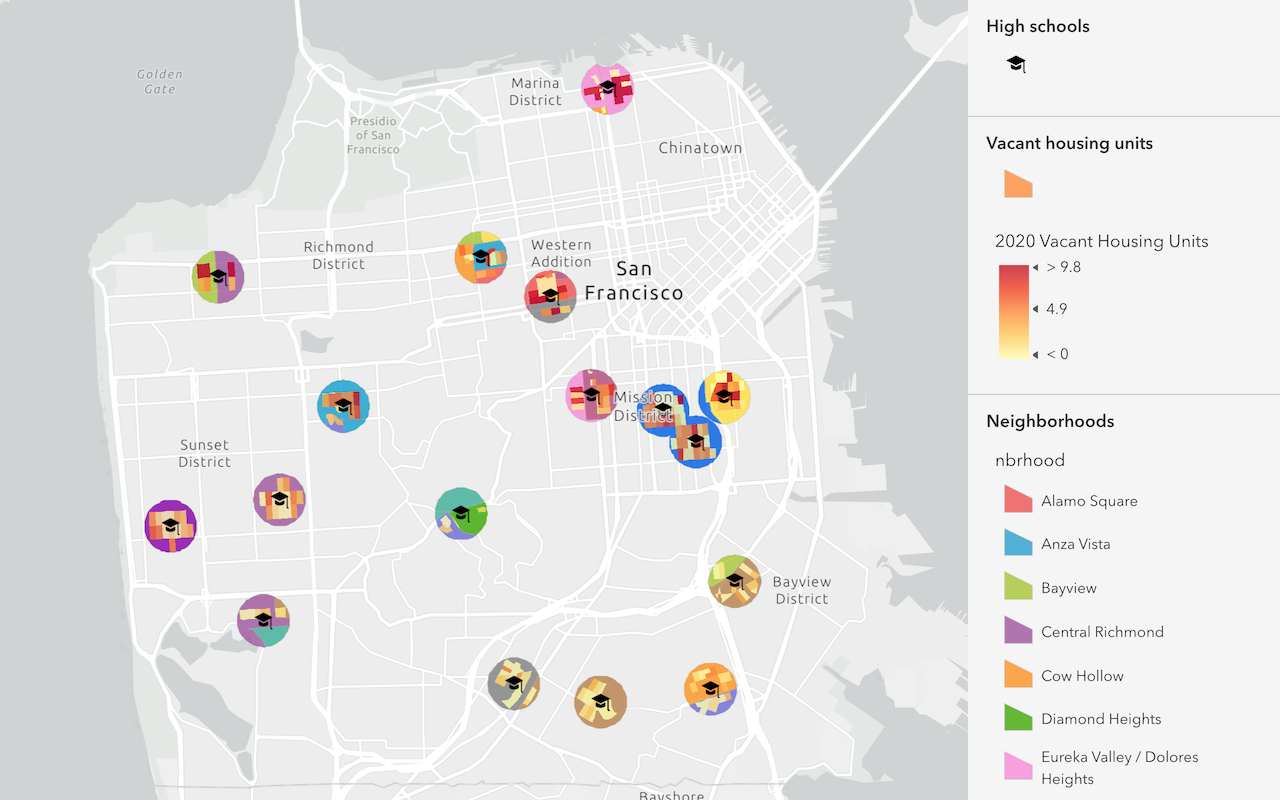
Enrich data sources
Enrich data with demographic information and local business facts using the spatial analysis service.
Spatial Analysis
Examine spatial data to find relationships, discover patterns, and solve problems.
Geometry analysis
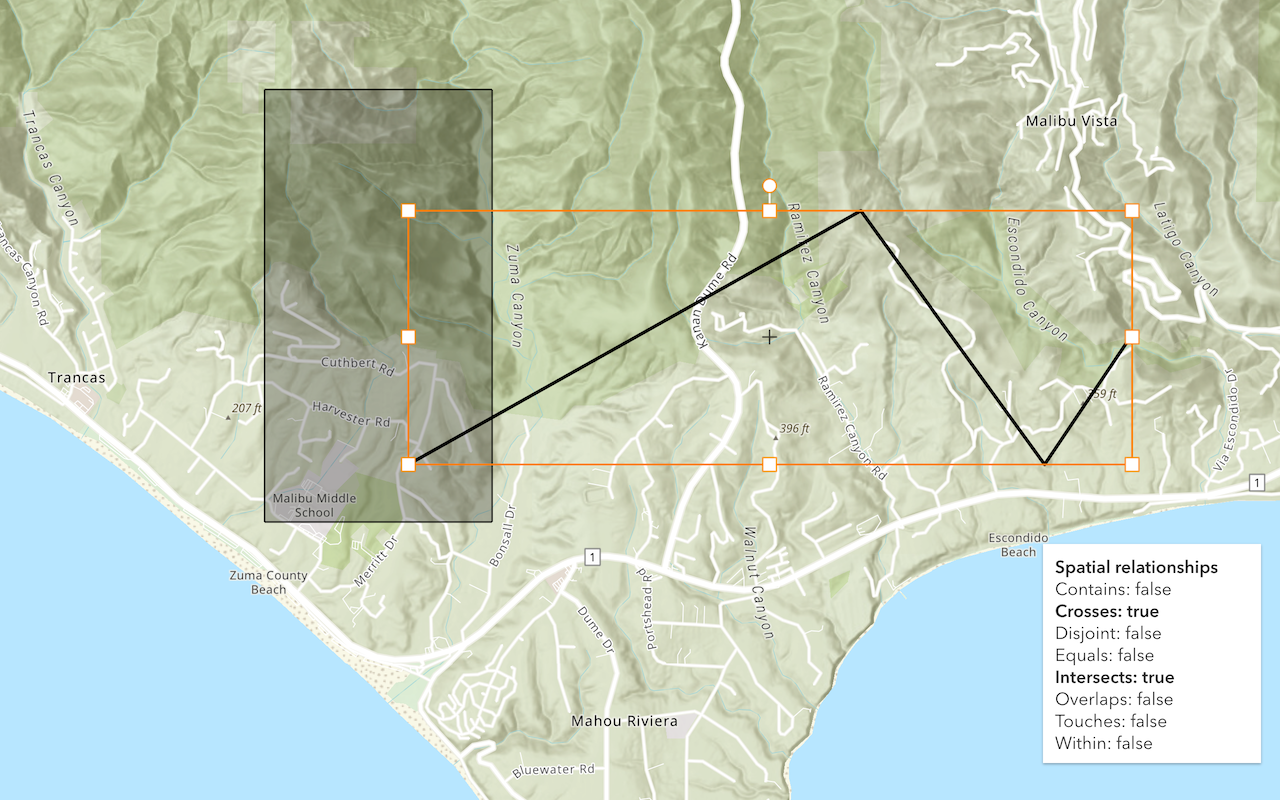
Find spatial relationships
Determine the spatial relationship between two geometries.
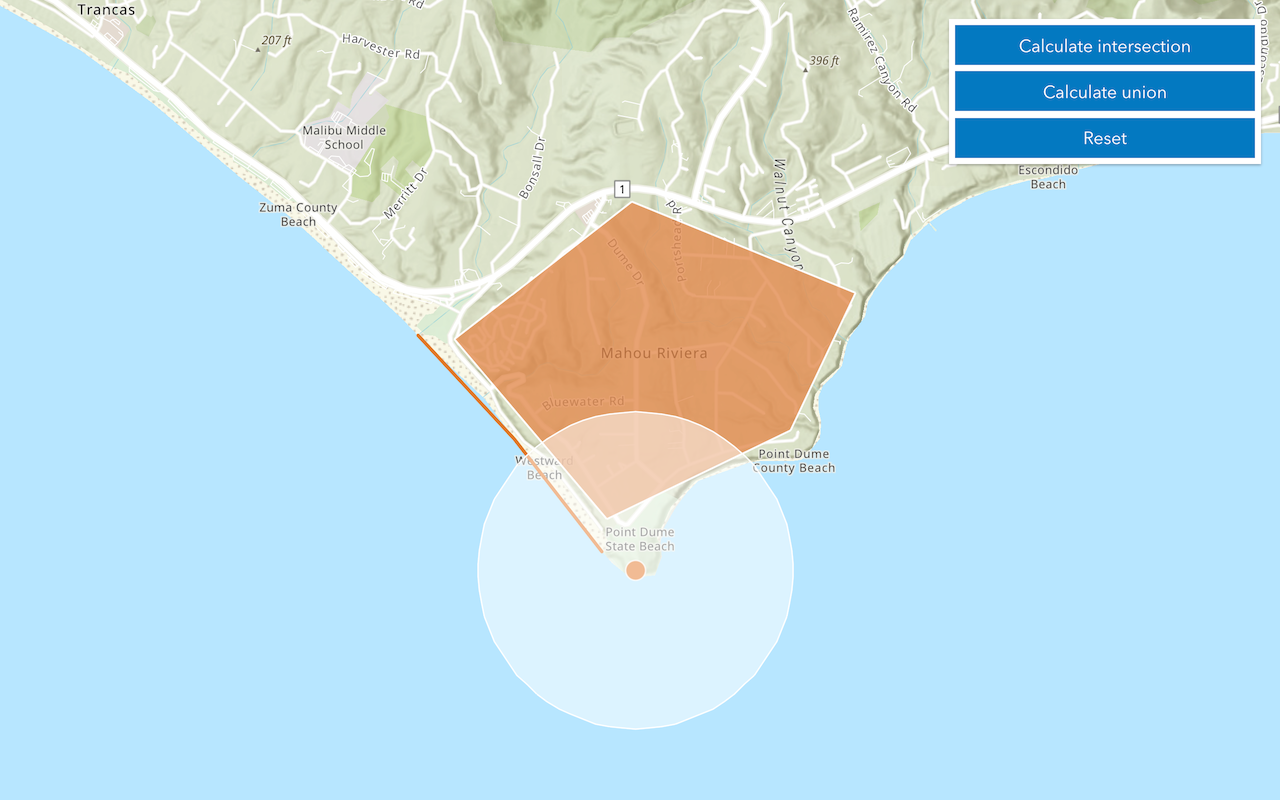
Calculate geometries
Perform buffer, intersect, union, and other geometric operations.
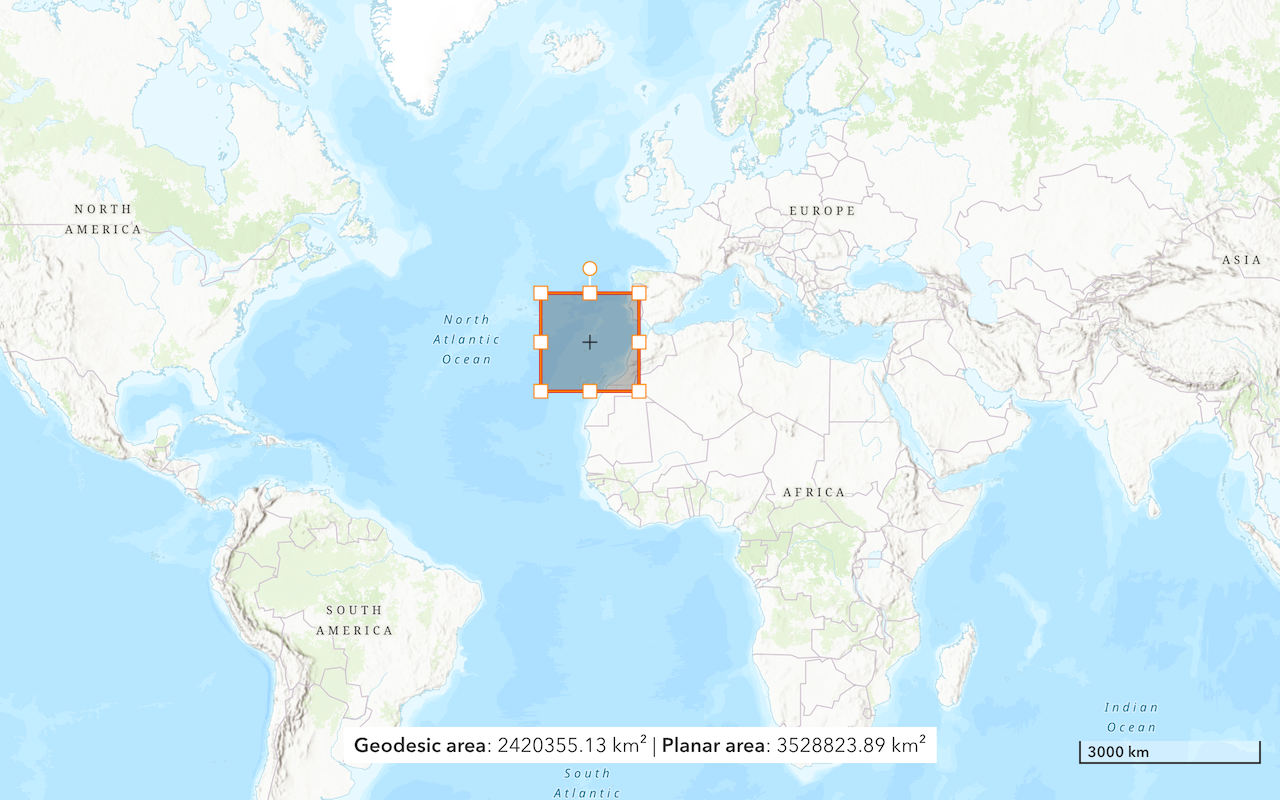
Find length and area
Get the length of a line and the area of a polygon.
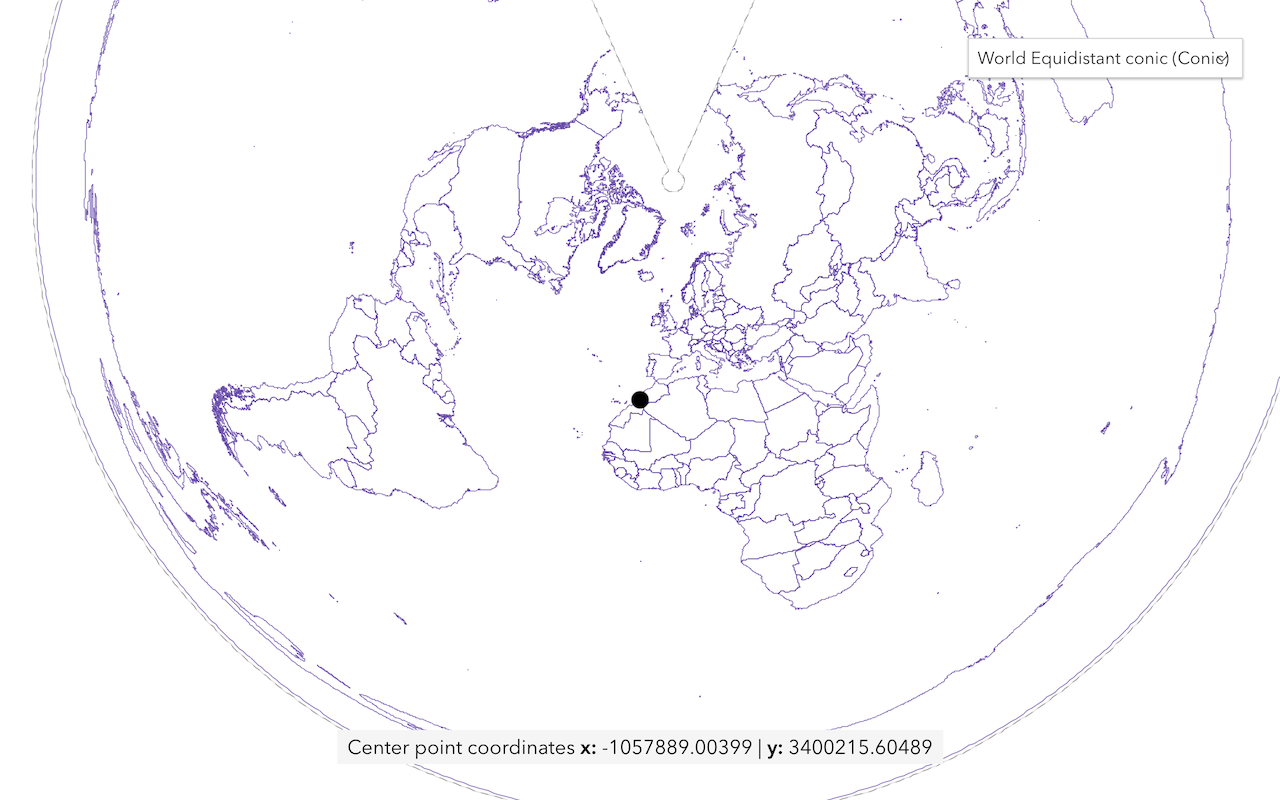
Display projected geometries
Project geometries to a new spatial reference in a map.
Feature analysis
Find data sources
Discover data in ArcGIS that you can use for feature analysis.
Create data sources
Import, create, and generate data for feature analysis.
Enrich data sources
Enrich data with demographic information and local business facts using the spatial analysis service.
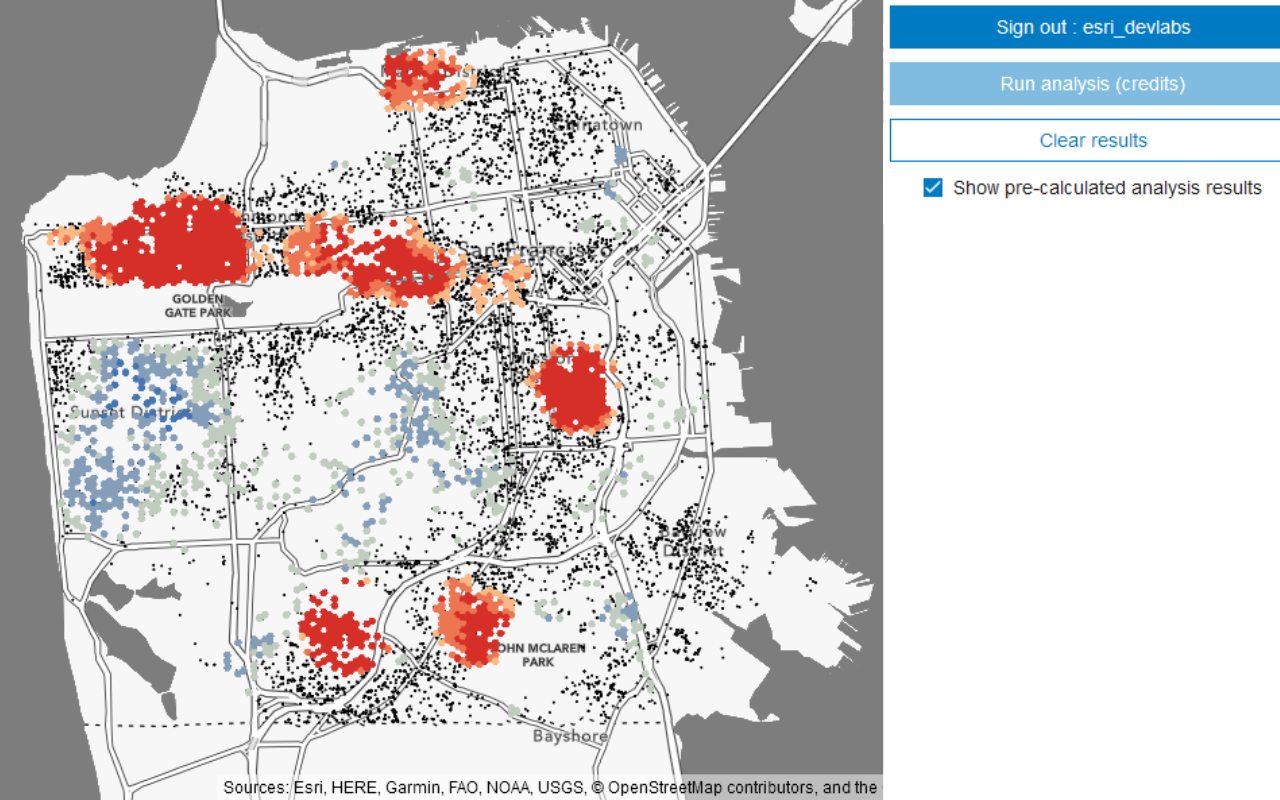
Perform a feature analysis
Perform a feature analysis using ArcGIS REST JS.
Find and extract data
Find data with attribute and spatial queries using find analysis operations.
Combine data
Overlay, join, and dissolve features using combine analysis operations.
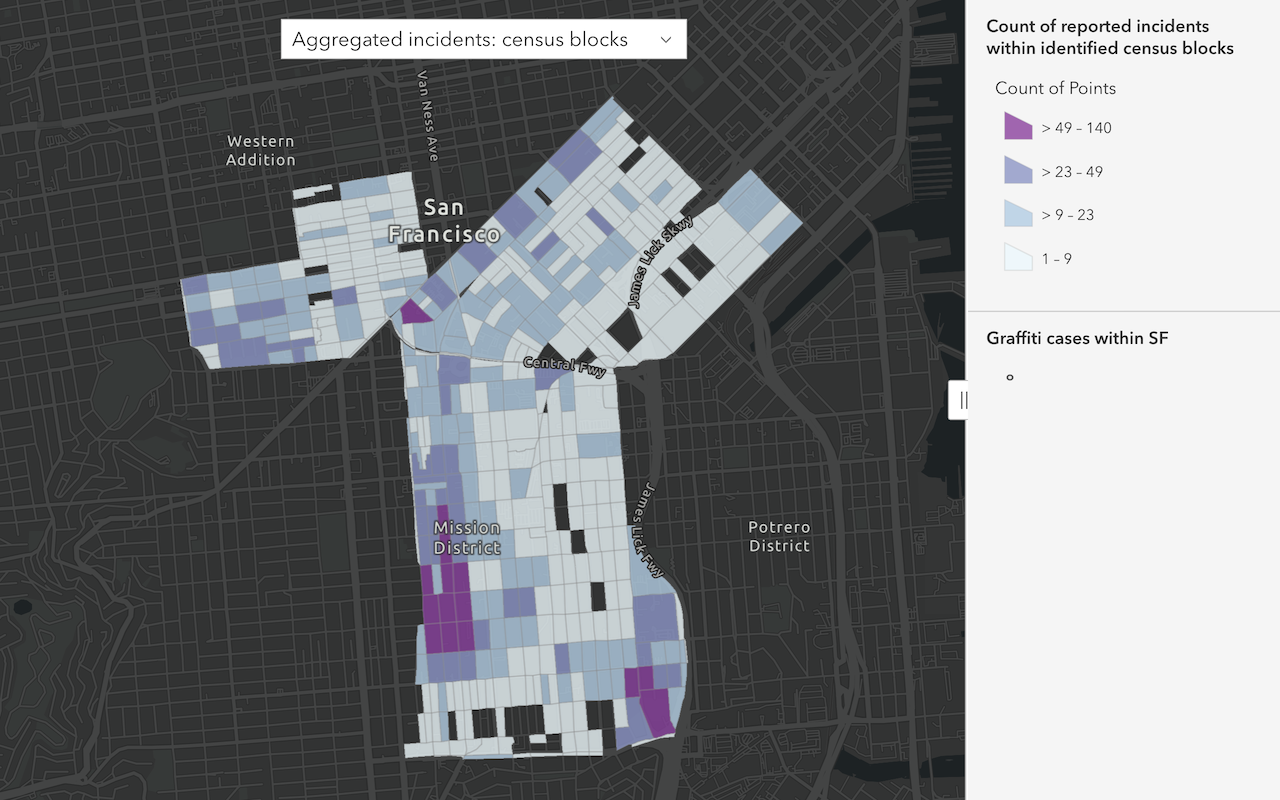
Summarize data
Aggregate and summarize features using summarize analysis operations.
Discover patterns in data
Find patterns and trends in data using spatial analysis operations.
Offline
Use tools to prepare data for offline use and build applications to display, analyze, and edit data.
Display an offline map on demand
Download and display an offline map for a custom area of a web map stored in ArcGIS.
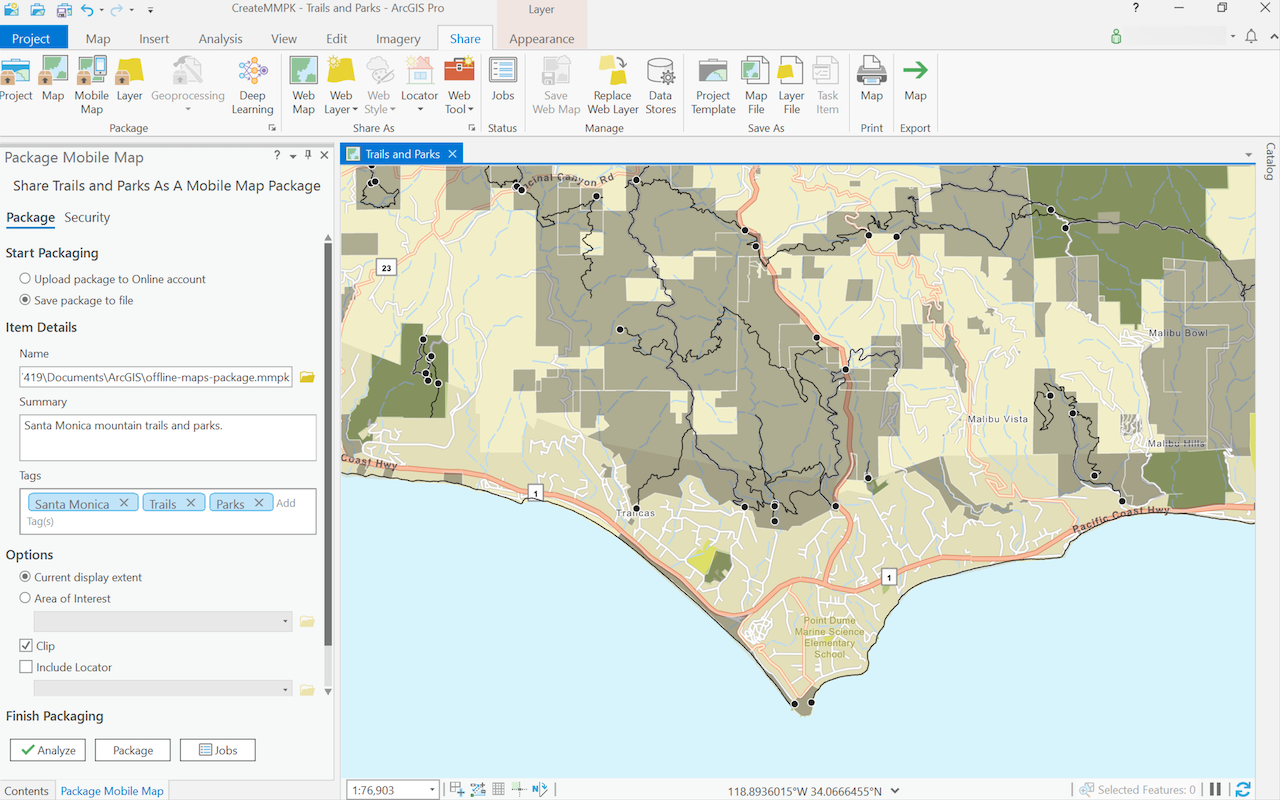
Create a mobile map package
Use ArcGIS Pro to create a mobile map package.
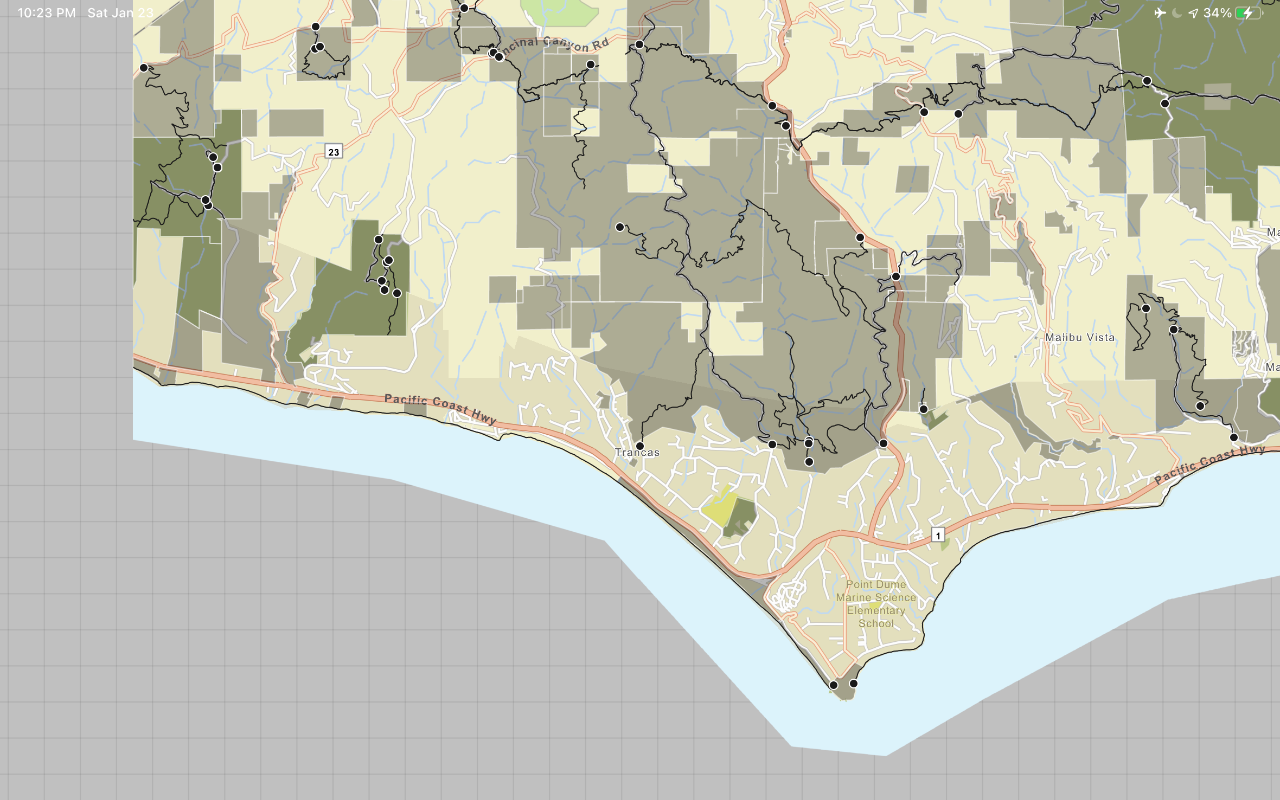
Display a map from a mobile map package
Access and display a map from a mobile map package for offline use.