Learn how to query global demographic information for locations around the world with the GeoEnrichment service.
The GeoEnrichment service provides global demographic data for 170 countries and regions. To get globally available information, you use the Key data collection, which returns information for the total population, total households, average household size, and total population for males and females for a study area.
In this tutorial, you use ArcGIS REST JS to access the GeoEnrichment service and display global data for Eastern Europe.
Prerequisites
You need an ArcGIS Developer or ArcGIS Online account to access the developer dashboard and create an API key.
Steps
Create a new pen
- To get started, either complete the Display a map tutorial or .
Set the API key
To access location services, you need an API key or OAuth 2.0 access token. To learn how to create and scope your key, visit the Create an API key tutorial.
-
Go to your dashboard to get an API key. The API key must be scoped to access the services used in this tutorial.
-
In CodePen, update
apito use your key.Key Use dark colors for code blocks const apiKey = "YOUR_API_KEY"; const basemapEnum = "arcgis/streets"; const map = new maplibregl.Map({ container: "map", // the id of the div element style: `https://basemapstyles-api.arcgis.com/arcgis/rest/services/styles/v2/styles/${basemapEnum}?token=${apiKey}`, zoom: 12, // starting zoom center: [-118.805, 34.027] // starting location [longitude, latitude] });
Add references to ArcGIS REST JS
-
Reference the
requestanddemographicsmoduels from ArcGIS REST JS.Use dark colors for code blocks <head> <meta charset="utf-8" /> <meta name="viewport" content="initial-scale=1,maximum-scale=1,user-scalable=no" /> <script src="https://unpkg.com/maplibre-gl@3.2.1/dist/maplibre-gl.js"></script> <link href="https://unpkg.com/maplibre-gl@3.2.1/dist/maplibre-gl.css" rel="stylesheet" /> <script src="https://unpkg.com/@esri/arcgis-rest-request@4.0.0/dist/bundled/request.umd.js"></script> <script src="https://unpkg.com/@esri/arcgis-rest-demographics@4.0.0/dist/bundled/demographics.umd.js"></script> <style> html, body, #map { padding: 0; margin: 0; height: 100%; width: 100%; font-family: Arial, Helvetica, sans-serif; font-size: 14px; color: #323232; } </style> </head>
Update the map position
The GeoEnrichment service has data sources for many countries around the world, including most of Europe. Change the position of the map to center on eastern Europe.
-
Update the
centerparameter to[18.88, 47.33]and setzoomto 5.Use dark colors for code blocks const apiKey = "YOUR_API_KEY"; const basemapEnum = "arcgis/streets"; const map = new maplibregl.Map({ container: "map", // the id of the div element style: `https://basemapstyles-api.arcgis.com/arcgis/rest/services/styles/v2/styles/${basemapEnum}?token=${apiKey}`, zoom: 5, // starting zoom center: [18.88, 47.33] // starting location [longitude, latitude] });
Add a click event handler
You need a location before calling the GeoEnrichment service. To get a location, you can add a handler to the Map's click event. The click handler will be called with an object containing a Lng.
You can change the mouse cursor to a crosshair to make it easier to click precisely. Use map.get to get the canvas, then modify its style property.
-
After the map initialization code, set the mouse cursor style to
crosshair.Use dark colors for code blocks const map = new maplibregl.Map({ container: "map", // the id of the div element style: `https://basemapstyles-api.arcgis.com/arcgis/rest/services/styles/v2/styles/${basemapEnum}?token=${apiKey}`, zoom: 5, // starting zoom center: [18.88, 47.33] // starting location [longitude, latitude] }); map.getCanvas().style.cursor = "crosshair"; -
Add an
asynchandler for theclickevent.Use dark colors for code blocks map.getCanvas().style.cursor = "crosshair"; map.on("click", async (e) => { // e.lngLat contains the clicked location });
Execute the query
You pass one or more study areas to arcgis to specify the location of your query. To query a buffer around a point, pass a geometry object with x and y parameters. The default search radius is one mile.
-
Create a new
arcgisto access the feature service.Rest.Api Key Use dark colors for code blocks const map = new maplibregl.Map({ container: "map", // the id of the div element style: `https://basemapstyles-api.arcgis.com/arcgis/rest/services/styles/v2/styles/${basemapEnum}?token=${apiKey}`, zoom: 5, // starting zoom center: [18.88, 47.33] // starting location [longitude, latitude] }); const authentication = arcgisRest.ApiKeyManager.fromKey(apiKey); -
Inside the click handler, call
arcgis. Set theRest.query Demographic Data studyparameter to a point geometry made from the event'sAreas lngproperty. Set theLat dataparameter to toCollections ["Keyto obtain global data for your location.Global Facts"] queryis an asynchronous function. UsingDemographic Data await, and declaring the click handlerasync, means the rest of the click handler will wait for a response from the GeoEnrichment service before continuing.Use dark colors for code blocks map.on("click", async (e) => { // e.lngLat contains the clicked location const response = await arcgisRest.queryDemographicData({ studyAreas: [ { geometry: { x: e.lngLat.lng, y: e.lngLat.lat } } ], dataCollections: ["KeyGlobalFacts"], authentication: authentication }); });
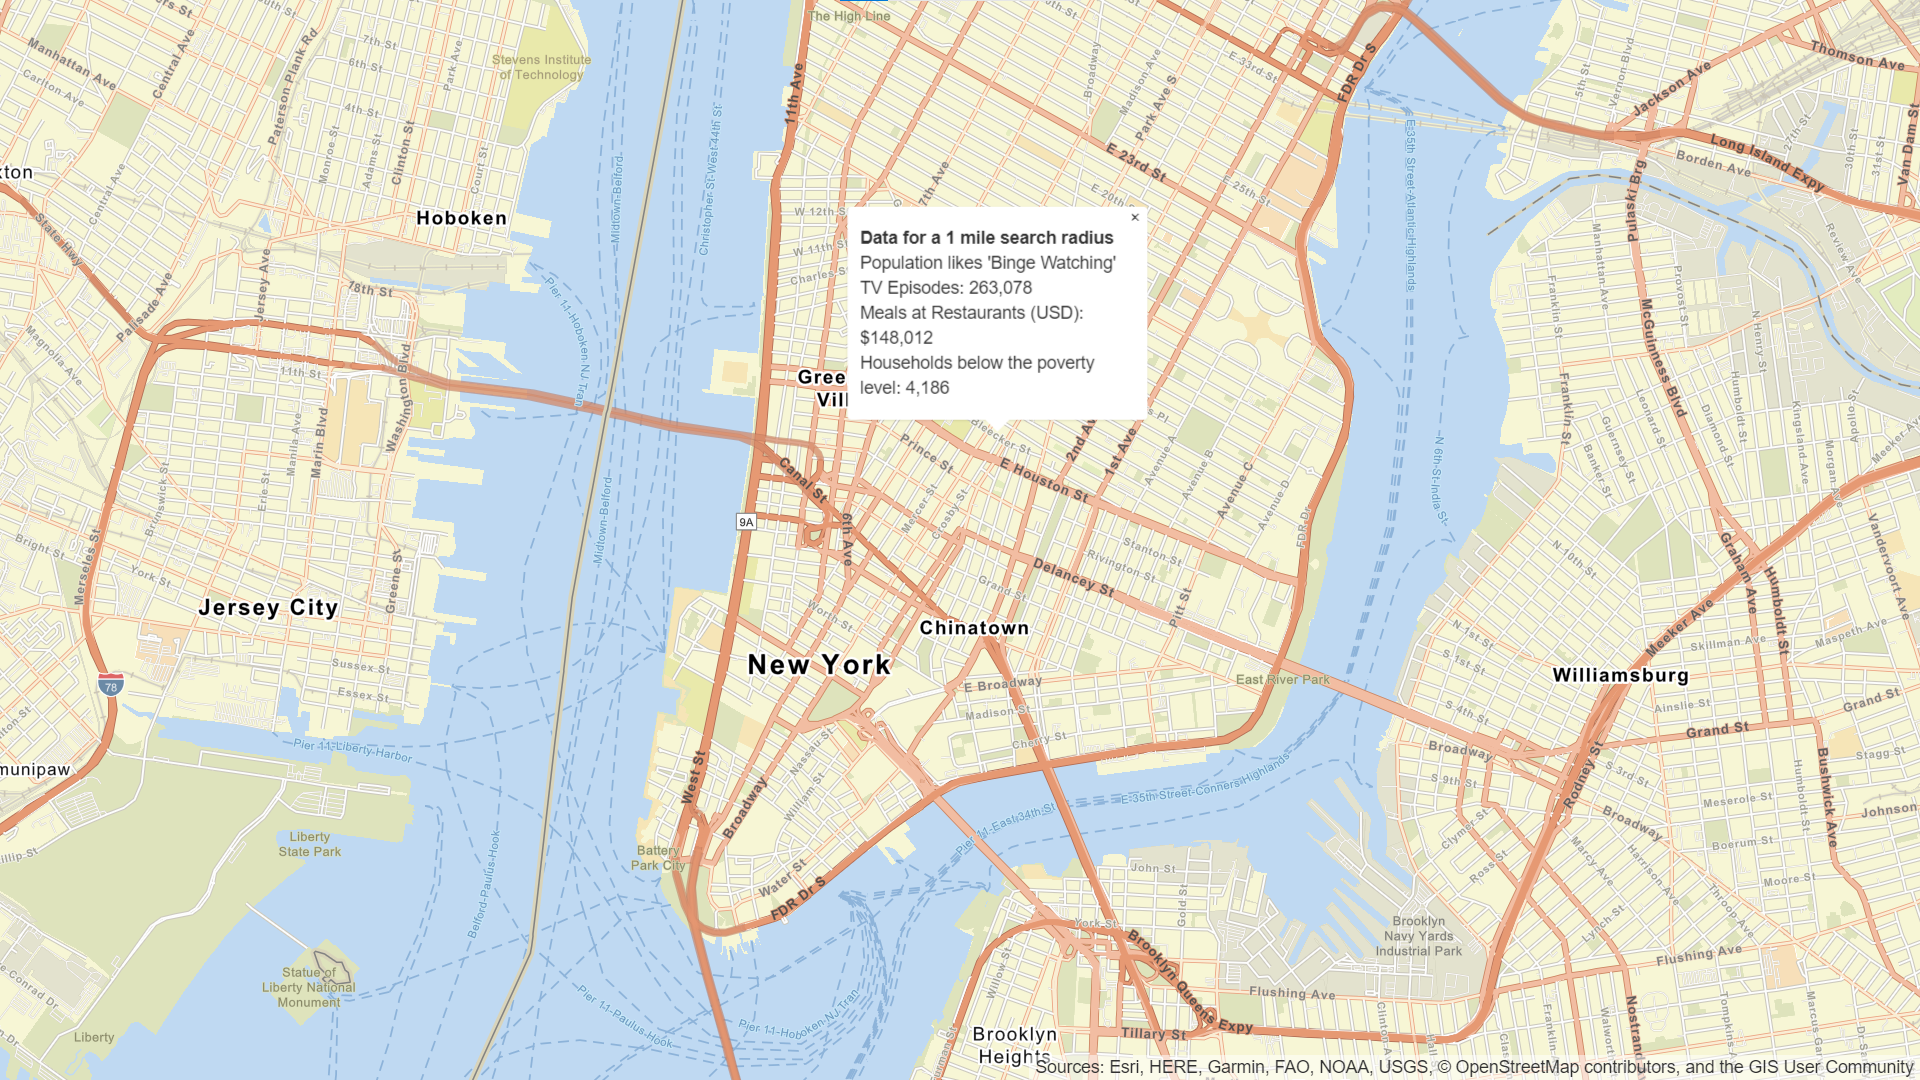
Show a pop-up
If the query is successful, the response will contain a results array with a value containing a Feature. The Feature contains attributes such as population within the study area, the number of males and females, and the average household size. A message will display if there is no data available for a location selected. To learn more, visit the GeoEnrichment service page.
You can use a pop-up to show the results of the query at the location where you clicked on the map.
To add a pop-up to the map, you use the Popup class in MapLibre GL JS. See the Display a pop-up tutorial for more information.
-
Set a variable containing the contents of the pop-up, using values from the query response.
Use dark colors for code blocks const response = await arcgisRest.queryDemographicData({ studyAreas: [ { geometry: { x: e.lngLat.lng, y: e.lngLat.lat } } ], dataCollections: ["KeyGlobalFacts"], authentication: authentication }); let message; const featureSet = response.results[0].value.FeatureSet; if (featureSet.length > 0 && featureSet[0].features.length > 0) { const attributes = featureSet[0].features[0].attributes; message = `<b>Data for a 1 mile search radius</b><br>` + [ `Population: ${attributes.TOTPOP.toLocaleString()}`, `Males: ${attributes.TOTMALES.toLocaleString()}`, `Females: ${attributes.TOTFEMALES.toLocaleString()}`, `Average household size: ${attributes.AVGHHSZ}` ].join("<br>"); } else { message = "Data not available for this location."; } -
Create a
Popupto display amessagecontaining demographic attributes, and add it to the map at the clicked location.Use dark colors for code blocks } else { message = "Data not available for this location."; } const popup = new maplibregl.Popup().setHTML(message).setLngLat(e.lngLat).addTo(map);
Run the app
In CodePen, run your code to display the map.
You should now see a map centered over eastern Europe. Click on the map to query for demographic data and view the results in a popup.
What's next?
Learn how to use additional ArcGIS location services in these tutorials: