The arcgis.geoanalytics.find_locations submodule contains tools to identify areas that meet a number of different criteria you specify. The criteria can be based on attribute queries, parcels that are vacant for example, and spatial queries, features within 1 kilometer of a river for example. The areas that are found can be selected from existing features, such as existing land parcels, or new features can be created where all the requirements are met.
This toolset uses distributed processing to complete analytics on your GeoAnalytics Server.
Tool |
Description |
|---|---|
detect_incidents |
Creates a layer that detects features that meet a given condition. |
geocode_locations |
Geocode Locations from Table creates an item in your contents containing the geocoded data. |
find_dwell_locations |
Finds locations where moving objects have stopped, or dwelled, using given time and distance thresholds. |
find_similar_locations |
Identifies the candidate features that are most similar or dissimilar to one or more input features based on feature attributes. |
Note: The purpose of the notebook is to show examples of the different tools that can be run on an example dataset.
Necessary imports
# connect to Enterprise GIS
from arcgis.gis import GIS
import arcgis.geoanalytics

portal_gis = GIS("your_enterprise_profile")
Get the data
search_result = portal_gis.content.search("bigDataFileShares_all_hurricanes",
                                          item_type = "big data file share",
                                          max_items=40)
search_result
[<Item title:"bigDataFileShares_all_hurricanes" type:Big Data File Share owner:admin>]
data_item = search_result[0]
data_item
#displays layers in the item
data_item.layers
[<Layer url:"https://ndhwks6.esri.com/server/rest/services/DataStoreCatalogs/bigDataFileShares_all_hurricanes/BigDataCatalogServer/hurricanes">]
hurricanes = data_item.layers[0] #select first layer
hurricanes
<Layer url:"https://ndhwks6.esri.com/server/rest/services/DataStoreCatalogs/bigDataFileShares_all_hurricanes/BigDataCatalogServer/hurricanes">
search_result = portal_gis.content.get('8f2fd1d2488f47adbe07a3ddcb05e24e')
search_resulttable = search_result.tables[0]
table<Table url:"https://ndhwks6.esri.com/server/rest/services/Hosted/ImportantPlaces/FeatureServer/1">
Detect Incidents
The detect_incidents tool examines time-sequential features using a specified condition. Features that meet the specified condition are marked as incidents. The resulting layer displays the input features in the same format as the input, with additional fields stating if the feature is an incident, the status of the incident, the duration of the incident, and a unique incident identifier.
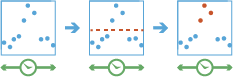
The detect_incidents task works with a time-enabled layer of points, lines, areas, or tables that represents an instant in time. Using sequentially ordered features, called tracks, this tool determines which features are incidents of interest. Incidents are determined by conditions that you specify. First, the tool determines which features belong to a track using one or more fields. Using the time at each feature, the tracks are ordered sequentially and the incident condition is applied. Features that meet the starting incident condition are marked as an incident. You can optionally apply an ending incident condition; when the end condition is ‘True’, the feature is no longer an incident. The results will be returned with the original features with new columns representing the incident name and indicate which feature meets the incident condition. You can return all original features, only the features that are incidents, or all of the features within tracks where at least one incident occurred.
For example, suppose you have GPS measurements of hurricanes every 10 minutes. Each GPS measurement records the hurricane’s name, location, time of recording, and wind speed. Using these fields, you could create an incident where any measurement with a wind speed greater than 208 km/h is an incident titled Catastrophic. By not setting an end condition, the incident would end if the feature no longer meets the start condition (wind speed slows down to less than 208).
Using another example, suppose you were monitoring concentrations of a chemical in your local water supply using a field called contanimateLevel. You know that the recommended levels are less than 0.01 mg/L, while dangerous levels are above 0.03 mg/L. You can create an incident with a start condition of contanimateLevel > 0.03 and an end condition of contanimateLevel < 0.01. This will mark any sequence where values exceed 0.03mg/L until they return to a value less than 0.01mg/L.
from arcgis.geoanalytics.find_locations import detect_incidentsThis example finds when and where hurricanes are moving.
##usage example
incidents_detected = detect_incidents(input_layer=hurricanes,
                                      track_fields='track_type',
                                      start_condition_expression='$feature["Wind"] < 0.2')
incidents_detected

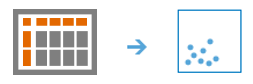
Geocode Locations
The geocode_locations task geocodes a table from a big data file share. The task uses a geocode utility service configured with your portal. If you do not have a geocode utility service configured, talk to your administrator. Learn more about configuring a locator service.
When preparing to use the Geocode Location task, be sure to review Best Practices for geocoding with GeoAnalytics Server.
from arcgis.geoanalytics.find_locations import geocode_locationstable.query(as_df=True)| objectid | place | street | city | state | zip | |
|---|---|---|---|---|---|---|
| 0 | 1 | Lisa's job | 380 New York Street | Redlands | CA | 92373 |
| 1 | 2 | Mark's job | 4511 E Guasti Road | Ontario | CA | 91761 |
geocoded_locs = geocode_locations(input_layer=table, country='CA', output_name='geocoded')
Find Dwell Locations
The find_dwell_locations tool determines dwell locations from time-sequential points in a track. Dwell locations are defined as sequential observations with little or no movement over a certain period of time. Depending on the field of application, this may be referred to as stay points or idle detection. Tracks are identified by one or more track fields. The result layer displays the dwell location as points, a convex hull of the dwell locations, or a mean center point of the dwell. The output contains the count of features within a dwell location, the start and end time of the dwell, the duration of the dwell, and any additional statistics that have been calculated. Each track can have 0, 1, or more dwell locations.
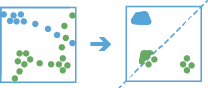
The find_dwell_locations works with time-enabled points of type instant to find where points dwell within a specific distance and duration.
Dwell locations are determined using both time (time_tolerance) and distance (distance_tolerance) values. First, the tool assigns features to a track using a unique identifier. Track order is determined by the time of features. Next, the distance between the first observation in a track and the next is calculated. Features are considered to be part of a dwell if two temporally consecutive points stay within the given distance for at least the given duration. When two features are found to be part of a dwell, the first feature in the dwell is used as a reference point, and the tool finds consecutive features that are within the specified distance of the reference point in the dwell. Once all features within the specified distance are found, the tool collects the dwell features and calculates their mean center. Features before and after the current dwell are added to the dwell if they are within the given distance of the dwell location’s mean center. This process continues until the end of the track.
For example, ecologists and conservation workers can use the Find Dwell Locations tool to improve the safety of elk during migratory seasons. Leverage the results to implement or improve protected areas in locations where the animals are spending the most time.
For another example, let’s say you work with the Department of Transportation and you want to improve traffic congestion on highways near exits. Using the Find Dwell Locations tool, you can isolate areas experiencing congestion by identifying vehicle tracks that stay within a certain distance for a certain amount of time.
from arcgis.geoanalytics.find_locations import find_dwell_locationsdwell_locs = find_dwell_locations(input_layer=hurricanes,
track_fields='track_type',
distance_tolerance=1,
distance_unit='Meters',
time_tolerance='1',
time_unit='Hours',
output_name='dwell locations')dwell_locs
Find Similar Locations
The find_similar_locations tool identifies the candidate features that are most similar or dissimilar to one or more input features based on feature attributes.
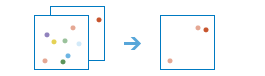
The find_similar_locations task measures the similarity of candidate locations to one or more reference locations.
Based on criteria you specify, find_similar_locations can answer questions like:
- Which of your stores are most similar to your top performers with regard to customer profiles?
- Based on characteristics of villages hardest hit by a disease, which other villages are at high risk?
To answer questions like this, you provide the reference locations (the input_layer parameter), the candidate locations (the search_layer parameter), and the fields representing the criteria you want to match. For example, the input_layer might be a layer containing your top performing stores or the villages hardest hit by a disease. The search_layer would then contain your candidate locations to search. This might be all of your stores or all other villages. Finally, you would supply a list of fields to use for measuring similarity. The find_similar_locations task would then rank all of the candidate locations by how closely they match your reference locations across all of the fields you have selected.
from arcgis.geoanalytics.find_locations import find_similar_locations
from datetime import datetime as dt
top_4_most_similar_results = find_similar_locations(input_layer=data_layer,
search_layer=candidte_layer,
analysis_fields=['THH17','THH35','THH02','THH05','POPDENS14','FAMGRW10_14','UNEMPRT_CY'],
output_name = "Top4SimilarLocations" + str(dt.now().microsecond),
number_of_results=4,
return_tuple=True)top_4_most_similar_results.output<FeatureLayer url:"https://pythonapi.playground.esri.com/server/rest/services/Hosted/similar_locations/FeatureServer/0">

In this guide, we learned about tools that help identify locations based on a certain criteria. In the next guide, we will learn about the arcgis.geoanalytics.summarize_data submodule that contains functions for calculating total counts, lengths, areas, and basic descriptive statistics of features.