Create a buffer around a map point and display the results as a Graphic.
Use case
Creating buffers is a core concept in GIS proximity analysis that allows you to visualize and locate geographic features contained within a polygon. For example, suppose you wanted to visualize areas of your city where alcohol sales are prohibited because they are within 500 meters of a school. The first step in this proximity analysis would be to generate 500 meter buffer polygons around all schools in the city. Any such businesses you find inside one of the resulting polygons are violating the law.
How to use the sample
- Tap on the map.
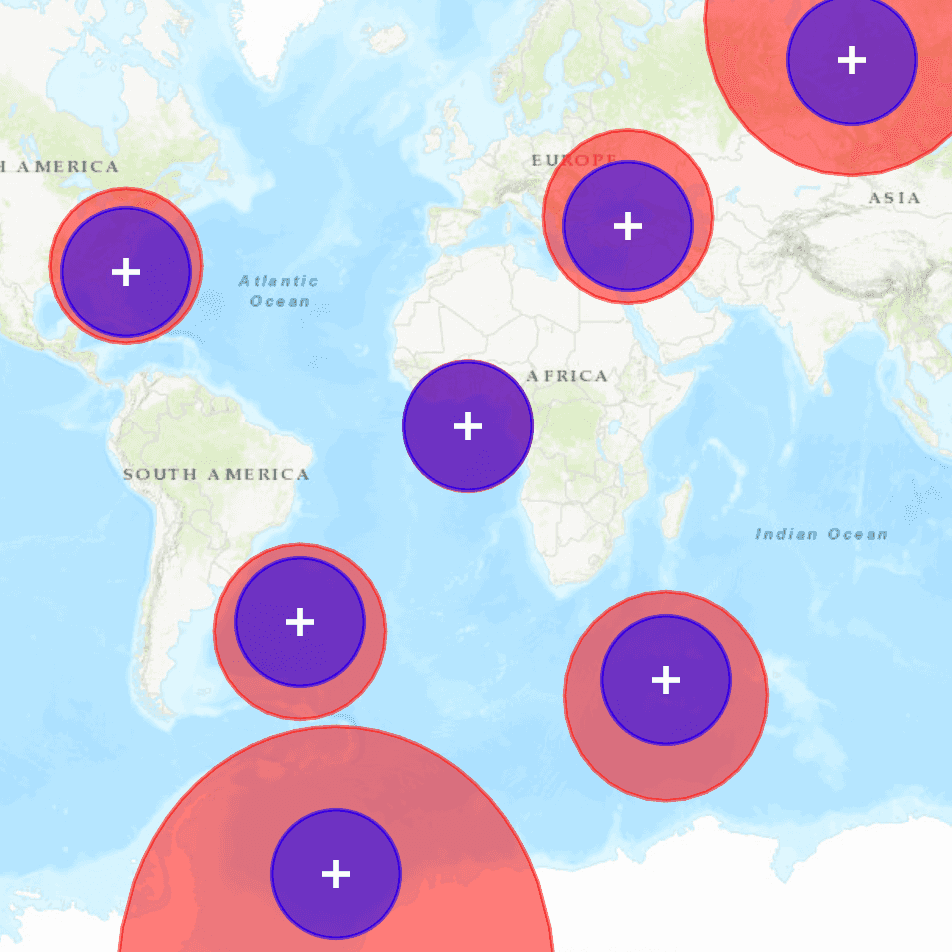
- A planar and a geodesic buffer will be created at the tap location using the distance (miles) specified in the text box.
- Continue tapping to create additional buffers. Notice that buffers closer to the equator appear similar in size. As you move north or south from the equator, however, the geodesic polygons become much larger. Geodesic polygons are in fact a better representation of the true shape and size of the buffer.
- Click
Clearto remove all buffers and start again.
How it works
- The map
Pointfor a tap on the display is captured. - The static method
GeometryEngine.bufferis called to create a planar buffer polygon from the map location and distance. - Another static method,
GeometryEngine.bufferGeodeticis called to create a geodesic buffer polygon using the same inputs. - The polygon results (and tap location) are displayed in the map view with different symbols in order to highlight the difference between the buffer techniques due to the spatial reference used in the planar calculation.
Relevant API
- GeometryEngine.buffer
- GeometryEngine.bufferGeodetic
- GraphicsOverlay
Additional information
Buffers can be generated as either planar (flat - coordinate space of the map's spatial reference) or geodesic (technique that considers the curved shape of the Earth's surface, which is generally a more accurate representation). In general, distortion in the map increases as you move away from the standard parallels of the spatial reference's projection. This map is in Web Mercator so areas near the equator are the most accurate. As you move the buffer location north or south from that line, you'll see a greater difference in the polygon size and shape. Planar operations are generally faster, but performance improvement may only be noticeable for large operations (buffering a great number or complex geometry).
For more information about using buffer analysis, see the topic How Buffer (Analysis) works in the ArcGIS Pro documentation.
Tags
analysis, buffer, euclidean, geodesic, geometry, planar
Sample Code
// [WriteFile Name=Buffer, Category=Geometry]
// [Legal]
// Copyright 2018 Esri.
// Licensed under the Apache License, Version 2.0 (the "License");
// you may not use this file except in compliance with the License.
// You may obtain a copy of the License at
// http://www.apache.org/licenses/LICENSE-2.0
// Unless required by applicable law or agreed to in writing, software
// distributed under the License is distributed on an "AS IS" BASIS,
// WITHOUT WARRANTIES OR CONDITIONS OF ANY KIND, either express or implied.
// See the License for the specific language governing permissions and
// limitations under the License.
// [Legal]
import QtQuick
import QtQuick.Controls
import Esri.ArcGISRuntime
Rectangle {
id: rootRectangle
clip: true
width: 800
height: 600
// declare a map view
MapView {
id: mapView
anchors.fill: parent
Component.onCompleted: {
// Set the focus on MapView to initially enable keyboard navigation
forceActiveFocus();
}
// Add a map with a basemap
Map {
Basemap {
initStyle: Enums.BasemapStyleArcGISTopographic
}
}
// handle the mouse click - perform a buffer on click
onMouseClicked: mouse => bufferPoint(mouse.mapPoint);
// create graphics overlay for geodesic buffer graphics
GraphicsOverlay {
id: graphicsOverlaygeodesic
// Set the renderer
SimpleRenderer {
// create a simple fill symbol for the geodesic buffer result
SimpleFillSymbol {
id: geodesicBufferSymbol
color: Qt.rgba(1, 0, 0, 0.5)
style: Enums.SimpleFillSymbolStyleSolid
SimpleLineSymbol {
color: geodesicBufferSymbol.color
style: Enums.SimpleLineSymbolStyleSolid
width: 2
}
}
}
}
// create graphics overlay for planar buffer graphics
GraphicsOverlay {
id: graphicsOverlayPlanar
// Set the renderer
SimpleRenderer {
// create a simple fill symbol for the planar buffer result
SimpleFillSymbol {
id: planarBufferSymbol
color: Qt.rgba(0, 0, 1, 0.5)
style: Enums.SimpleFillSymbolStyleSolid
SimpleLineSymbol {
color: planarBufferSymbol.color
style: Enums.SimpleLineSymbolStyleSolid
width: 2
}
}
}
}
// create graphics overlay for the mouse clicks
GraphicsOverlay {
id: graphicsOverlayPoints
// Set the renderer
SimpleRenderer {
// create a marker symbol for the clicked point
SimpleMarkerSymbol {
id: pointSymbol
color: "white"
size: 14
style: Enums.SimpleMarkerSymbolStyleCross
}
}
}
}
// function to buffer a point and add graphics
function bufferPoint(point) {
// Create a variable to be the buffer size in meters. There are 1609.34 meters in one mile.
const bufferInMeters = bufferSizeText.text * 1609.34;
// Create a planar buffer graphic around the input location at the specified distance.
const buffer = GeometryEngine.buffer(point, bufferInMeters);
// Add the result planar buffer as a graphic
const resultGraphic = ArcGISRuntimeEnvironment.createObject("Graphic", {
geometry: buffer
});
graphicsOverlayPlanar.graphics.append(resultGraphic);
// Create a geodesic buffer graphic using the same location and distance.
const bufferGeodesic = GeometryEngine.bufferGeodetic(point, bufferInMeters, Factory.Unit.createFromWkid(9001) /*meters*/,
NaN, Enums.GeodeticCurveTypeGeodesic);
// Add the result planar buffer as a graphic
const resultGraphicGeodesic = ArcGISRuntimeEnvironment.createObject("Graphic", {
geometry: bufferGeodesic
});
graphicsOverlaygeodesic.graphics.append(resultGraphicGeodesic);
// Add the clicked point as a graphic
const clickedPointGraphic = ArcGISRuntimeEnvironment.createObject("Graphic", {
geometry: point
});
graphicsOverlayPoints.graphics.append(clickedPointGraphic);
}
// display a control pane to change size
Rectangle {
anchors {
margins: -5
fill: controlColumn
}
color: "lightgray"
radius: 5
border {
color: "darkgray"
width: 1
}
}
Column {
id: controlColumn
anchors {
left: parent.left
top: parent.top
margins: 10
}
spacing: 5
Text {
text: "Buffer size (miles):"
}
TextField {
id: bufferSizeText
validator: IntValidator { bottom: 1; top: 10000 }
text: "1000"
selectByMouse: true
}
Row {
spacing: 10
Rectangle {
radius: 100
width: 15
height: width
color: planarBufferSymbol.color
}
Text {
text: "Planar Buffer"
}
}
Row {
spacing: 10
Rectangle {
radius: 100
width: 15
height: width
color: geodesicBufferSymbol.color
}
Text {
text: "Geodesic Buffer"
}
}
Button {
anchors.horizontalCenter: parent.horizontalCenter
text: "Clear"
onClicked: {
graphicsOverlaygeodesic.graphics.clear();
graphicsOverlayPlanar.graphics.clear();
graphicsOverlayPoints.graphics.clear();
}
}
}
}