Extrude graphics based on an attribute value.
Use case
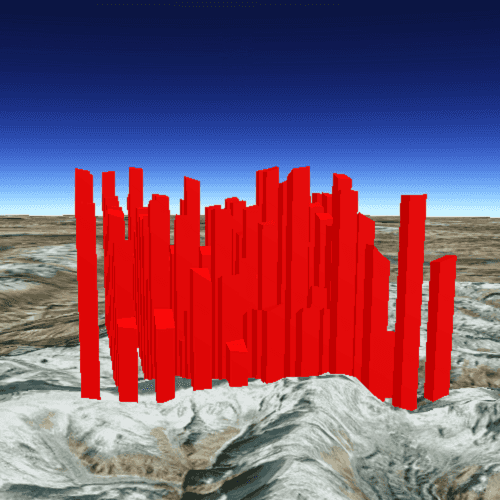
Graphics representing features can be vertically extruded to represent properties of the data that might otherwise go unseen. Extrusion can add visual prominence to data beyond what may be offered by varying the color, size, or shape of symbol alone. For example, graphics representing wind turbines in a wind farm application can be extruded by a real-world "height" attribute so that they can be visualized in a landscape. Likewise, census data can be extruded by a thematic "population" attribute to visually convey population levels across a country.
How to use the sample
Run the sample. Note that the graphics are extruded to the level set in their height property.
How it works
- Create a
GraphicsOverlayandSimpleRenderer. - Set the
RendererSceneProperties.extrusionModefor the renderer toEnums.ExtrusionModeBaseHeight. - Specify the attribute name of the graphic that the extrusion mode will use:
RendererSceneProperties.extrusionExpression: "[height]". - Set the renderer on the graphics overlay.
- Create graphics with the attribute set:
graphic.attributes.insertAttribute("height", z).
Relevant API
- RendererSceneProperties
- ExtrusionMode
- RendererSceneProperties.extrusionExpression
- SimpleRenderer
About the data
Data is hard coded in this sample as a demonstration of how to create and set an attribute to a graphic. To extrude graphics based on pre-existing attributes (e.g. from a feature layer) see the FeatureLayerExtrusion sample.
Tags
3D, extrude, extrusion, height, scene, visualization
Sample Code
// [WriteFile Name=ExtrudeGraphics, Category=Scenes]
// [Legal]
// Copyright 2016 Esri.
// Licensed under the Apache License, Version 2.0 (the "License");
// you may not use this file except in compliance with the License.
// You may obtain a copy of the License at
// http://www.apache.org/licenses/LICENSE-2.0
// Unless required by applicable law or agreed to in writing, software
// distributed under the License is distributed on an "AS IS" BASIS,
// WITHOUT WARRANTIES OR CONDITIONS OF ANY KIND, either express or implied.
// See the License for the specific language governing permissions and
// limitations under the License.
// [Legal]
import QtQuick
import QtQuick.Controls
import Esri.ArcGISRuntime
Rectangle {
width: 800
height: 600
property real size: 0.01
property int maxZ: 1000
property var colors: []
// Create a scene view
SceneView {
id: sceneView
anchors.fill: parent
// create a scene...scene is a default property of sceneview
// and thus will get added to the sceneview
Scene {
// add a basemap
Basemap {
initStyle: Enums.BasemapStyleArcGISImageryStandard
}
// add a surface...surface is a default property of scene
Surface {
// add an arcgis tiled elevation source...elevation source is a default property of surface
ArcGISTiledElevationSource {
url: "https://elevation3d.arcgis.com/arcgis/rest/services/WorldElevation3D/Terrain3D/ImageServer"
}
}
}
GraphicsOverlay {
id: graphicsOverlay
SimpleRenderer {
RendererSceneProperties {
extrusionMode: Enums.ExtrusionModeBaseHeight
extrusionExpression: "[height]"
}
SimpleFillSymbol{
style: Enums.SimpleFillSymbolStyleSolid;
color: "red"
}
}
}
Component.onCompleted: {
// Set the focus on SceneView to initially enable keyboard navigation
forceActiveFocus();
// set viewpoint to the specified camera
setViewpointCameraAndWait(camera);
createGraphics();
}
}
// create the camera to be used as the scene view's viewpoint
Camera {
id: camera
location: Point {
x: 83.9
y: 28.4
z: 10010.0
spatialReference: SpatialReference { wkid: 4326 }
}
heading: 10.0
pitch: 80.0
roll: 0.0
}
function createGraphics(){
const lon = camera.location.x;
const lat = camera.location.y + 0.2;
// create a random set of points
const points = [];
for (let i = 0; i <= 100; i++) {
const point = ArcGISRuntimeEnvironment.createObject("Point", {x:i / 10 * (size * 2) + lon, y:i % 10 * (size * 2) + lat, spatialReference:sceneView.spatialReference});
points.push(point);
}
// for each point construct a polygon by manipulating the co-ordinates
points.forEach(item => {
const randNum = Math.ceil(Math.random() * 6);
const z = maxZ * randNum;
const newPoints = [createPoint(item.x, item.y, z),
createPoint(item.x + size, item.y, z),
createPoint(item.x + size, item.y + size, z),
createPoint(item.x, item.y + size, z)];
// create a graphic
const graphic = ArcGISRuntimeEnvironment.createObject("Graphic", {geometry: createPolygonFromPoints(newPoints)});
graphic.attributes.insertAttribute("height", z);
graphicsOverlay.graphics.append(graphic);
});
}
// create a polygon from a list of points
function createPolygonFromPoints(pointsList) {
const polygonBuilder = ArcGISRuntimeEnvironment.createObject("PolygonBuilder");
polygonBuilder.spatialReference = sceneView.spatialReference;
pointsList.forEach(pnt => polygonBuilder.addPoint(pnt));
return polygonBuilder.geometry;
}
// create a point
function createPoint(x, y, z) {
return ArcGISRuntimeEnvironment.createObject("Point", {x:x, y:y, z:z, spatialReference: sceneView.spatialReference});
}
}