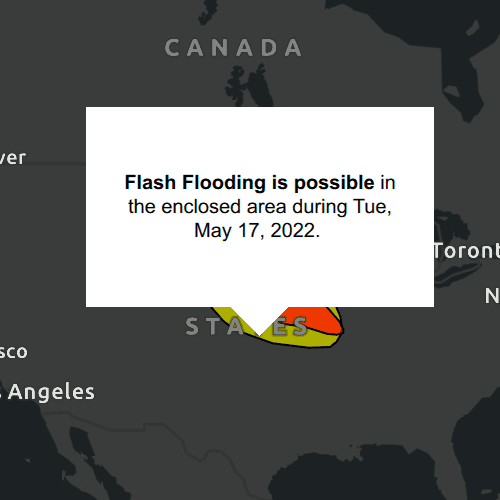
Show a callout with formatted content for a KML feature.
Use case
A user may wish to select a KML feature to view relevant information about it.
How to use the sample
Click a feature to identify it. Feature information will be displayed in a callout.
Note: the KML layer used in this sample contains a screen overlay. The screen overlay contains a legend and the logos for the National Oceanic and Atmospheric Administration (NOAA) and the National Weather Service (NWS). You can't identify the screen overlay.
How it works
- Connect to the
MouseClickedevent on theMapView. - On click:
- Call
identifyLayer(...)passing in theKmlLayer, screen point and tolerance. - Await the result of the identify and then get the
KmlPlacemarkfrom the result. - Create a callout at the calculated map point and populate the callout content with text from the placemark's
BalloonContent. NOTE: KML supports defining HTML for balloon content and may need to be converted from HTML to text. - Show the callout.
Note: There are several types of KML features. This sample only identifies features of type KmlPlacemark.
Relevant API
- GeoView.identifyLayer(...)
- IdentifyLayerResult
- KmlLayer
- KmlPlacemark.balloonContent()
About the data
This sample shows a forecast for significant weather within the U.S. Regions of severe thunderstorms, flooding, snowfall, and freezing rain are shown. Tap the features to see details.
Additional information
KML features can have rich HTML content, including images.
Tags
Keyhole, KML, KMZ, NOAA, NWS, OGC, weather
Sample Code
// [WriteFile Name=IdentifyKmlFeatures, Category=Layers]
// [Legal]
// Copyright 2020 Esri.
// Licensed under the Apache License, Version 2.0 (the "License");
// you may not use this file except in compliance with the License.
// You may obtain a copy of the License at
// http://www.apache.org/licenses/LICENSE-2.0
// Unless required by applicable law or agreed to in writing, software
// distributed under the License is distributed on an "AS IS" BASIS,
// WITHOUT WARRANTIES OR CONDITIONS OF ANY KIND, either express or implied.
// See the License for the specific language governing permissions and
// limitations under the License.
// [Legal]
import QtQuick
import QtQuick.Controls
import Esri.ArcGISRuntime
import Esri.ArcGISRuntime.Toolkit
Rectangle {
id: rootRectangle
clip: true
width: 800
height: 600
property Point clickedPoint: null
property string calloutText: ""
readonly property url layerUrl: "https://www.wpc.ncep.noaa.gov/kml/noaa_chart/WPC_Day1_SigWx_latest.kml"
MapView {
id: mapView
anchors.fill: parent
Component.onCompleted: {
// Set the focus on MapView to initially enable keyboard navigation
forceActiveFocus();
}
Callout {
id: callout
calloutData: parent.calloutData
implicitWidth: 150
implicitHeight: contentText.implicitHeight + (contentText.implicitHeight * .05)
contentItem: Label {
id: contentText
text: calloutText
wrapMode: Text.WordWrap
textFormat: Text.RichText
horizontalAlignment: Qt.AlignHCenter
verticalAlignment: Qt.AlignVCenter
}
}
Map {
Basemap {
initStyle: Enums.BasemapStyleArcGISDarkGray
}
// start zoomed in over the US
ViewpointExtent {
Envelope {
xMin: -19195297.778679
yMin: 512343.939994
xMax: -3620418.579987
yMax: 8658913.035426
SpatialReference {
wkid: 3857
}
}
}
KmlLayer {
id: forecastLayer
KmlDataset {
url: layerUrl
}
}
}
onMouseClicked: mouse => {
clickedPoint = screenToLocation(mouse.x, mouse.y);
if (identifyLayerStatus !== Enums.TaskStatusInProgress) {
identifyLayerWithMaxResults(forecastLayer, mouse.x, mouse.y, 15, false, 1);
}
}
onIdentifyLayerStatusChanged: {
if (identifyLayerStatus === Enums.TaskStatusCompleted) {
if (identifyLayerResult.geoElements.length < 1) {
callout.dismiss();
return;
}
// Google Earth only displays the placemarks with description or extended data. To
// match its behavior, add a description placeholder if the data source is empty
if (!identifyLayerResult.geoElements[0].description)
identifyLayerResult.geoElements[0].description = "Weather condition"
calloutText = identifyLayerResult.geoElements[0].balloonContent;
callout.calloutData.location = clickedPoint;
callout.showCallout();
}
}
}
}