Display custom labels on a feature layer.
Use case
Labeling features is useful to visually display a key piece of information or attribute of a feature on a map. For example, you may want to label rivers or street with their names.
How to use the sample
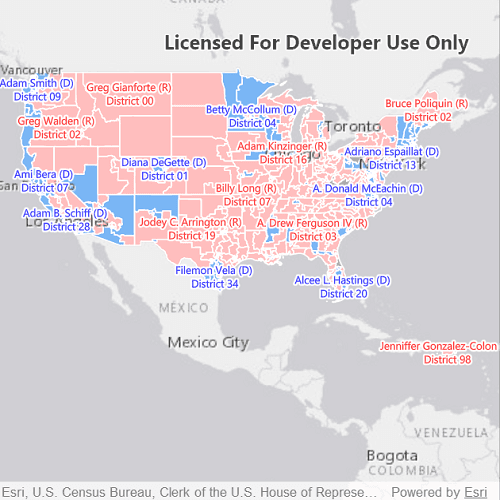
Pan and zoom around the United States. Labels for congressional districts will be shown in red for Republican districts and blue for Democrat districts. Notice how labels pop into view as you zoom in.
How it works
To show custom labels on a feature layer:
- Create a
FeatureLayerandServiceFeatureTableby passing in a URL to the REST endpoint of a map service. - Create an
ArcadeLabelExpressionfor the label definition.- You can use fields of the feature by using
$feature.field_namein the expression.
- You can use fields of the feature by using
- Create a
TextSymbolto control how the label text is styled. - Create a
LabelDefinitionfrom theArcadeLabelExpressionandTextSymbol. - Add the
LabelDefinitionto the list ofLabelDefinitionsin theFeatureLayerinstance. - Enable labels on the
FeatureLayerby settinglabelsEnabledto true.
Relevant API
- ArcadeLabelExpression
- FeatureLayer
- LabelDefinition
- TextSymbol
About the data
This sample uses the USA 116th Congressional Districts feature layer hosted on ArcGIS Online.
Additional information
Help regarding the Arcade label expression script for defining a label definition can be found on the ArcGIS Developers site.
Tags
attribute, deconfliction, label, labeling, string, symbol, text, visualization
Sample Code
// [WriteFile Name=ShowLabelsOnLayers, Category=DisplayInformation]
// [Legal]
// Copyright 2018 Esri.
// Licensed under the Apache License, Version 2.0 (the "License");
// you may not use this file except in compliance with the License.
// You may obtain a copy of the License at
// http://www.apache.org/licenses/LICENSE-2.0
// Unless required by applicable law or agreed to in writing, software
// distributed under the License is distributed on an "AS IS" BASIS,
// WITHOUT WARRANTIES OR CONDITIONS OF ANY KIND, either express or implied.
// See the License for the specific language governing permissions and
// limitations under the License.
// [Legal]
import QtQuick
import Esri.ArcGISRuntime
Rectangle {
id: rootRectangle
clip: true
width: 800
height: 600
MapView {
id: mapView
anchors.fill: parent
Component.onCompleted: {
// Set the focus on MapView to initially enable keyboard navigation
forceActiveFocus();
}
Map {
Basemap {
initStyle: Enums.BasemapStyleArcGISLightGray
}
FeatureLayer {
// Add a feature service
ServiceFeatureTable {
url: "https://services.arcgis.com/P3ePLMYs2RVChkJx/arcgis/rest/services/USA_115th_Congressional_Districts/FeatureServer/0"
}
// Enable Labels
labelsEnabled: true
// Add a label definition to define labels for the layer
//
// (1) The 'ArcadeLabelExpression' defines that the label text displayed comes from the fields 'NAME',
// the first letter of 'PARTY' (R or D), and 'CDFIPS' in the feature service in the format:
// Firstname Lastname (R or D)
// District #
// (2) The 'textSymbol' for the labeled text will be red (for Republican) or blue (for Democrat) with a white halo, in the center of the polygon.
// (3) The 'whereClause' restricts the labels to data from Republican or Democrat districts.
LabelDefinition {
id: republicanJson
expression: ArcadeLabelExpression {
expression: "$feature.NAME + ' (' + left($feature.PARTY,1) + ') \\nDistrict ' + $feature.CDFIPS"
}
textSymbol: TextSymbol {
size: 11
color: "red"
haloColor: "white"
haloWidth: 2
horizontalAlignment: Enums.HorizontalAlignmentCenter
verticalAlignment: Enums.VerticalAlignmentMiddle
}
whereClause: "PARTY = 'Republican'"
}
LabelDefinition {
id: democratJson
expression: ArcadeLabelExpression {
expression: "$feature.NAME + ' (' + left($feature.PARTY,1) + ') \\nDistrict ' + $feature.CDFIPS"
}
textSymbol: TextSymbol {
size: 11
color: "blue"
haloColor: "white"
haloWidth: 2
horizontalAlignment: Enums.HorizontalAlignmentCenter
verticalAlignment: Enums.VerticalAlignmentMiddle
}
whereClause: "PARTY = 'Democrat'"
}
// zoom to the layer once it loads
onLoadStatusChanged: {
if (loadStatus === Enums.LoadStatusLoaded)
mapView.setViewpointCenterAndScale(fullExtent.center, 56759600);
}
}
}
}
}