Discover connected features in a utility network using connected, subnetwork, upstream, and downstream traces.
Use case
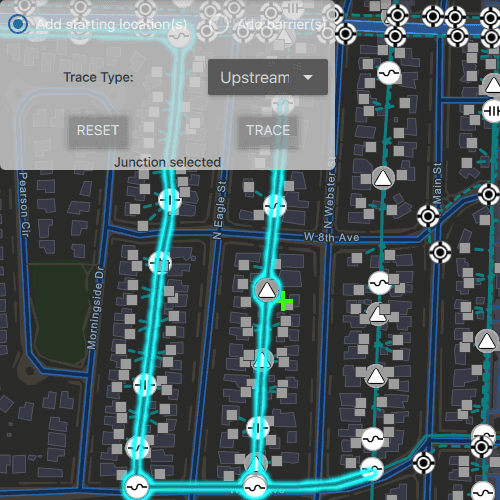
You can use a trace to visualize and validate the network topology of a utility network for quality assurance. Subnetwork traces are used for validating whether subnetworks, such as circuits or zones, are defined or edited appropriately.
How to use the sample
Tap on one or more features while 'Add starting locations' or 'Add barriers' is selected. When a junction feature is identified, you may be prompted to select a terminal. When an edge feature is identified, the distance from the tapped location to the beginning of the edge feature will be computed. Select the type of trace using the drop down menu. Click 'Trace' to initiate a trace on the network. Click 'Reset' to clear the trace parameters and start over.
How it works
- Create a
MapViewand connect to itsmouseClickedsignal. - Create and load a
ServiceGeodatabasewith a feature service URL and get tables by their layer IDs. - Create a
Mapthat containsFeatureLayer(s) created from theServiceGeodatabase's tables. - Create and load a
UtilityNetworkwith the same feature service URL as theMap. - Add a
GraphicsOverlaywith symbology that distinguishes starting locations from barriers. - Identify features on the map and add a
Graphicthat represents its purpose (starting point or barrier) at the location of each identified feature. - Create a
UtilityElementfor the identified feature. - Determine the type of this element using its
NetworkSource.SourceTypeproperty. - If the element is a junction with more than one terminal, display a terminal picker. Then set the junction's
terminalproperty with the selected terminal. - If an edge, set its
fractionAlongEdgeproperty usingGeometryEngine.fractionAlong. - Add this
UtilityElementto a collection of starting locations or barriers. - Create
UtilityTraceParameterswith the selected trace type along with the collected starting locations and barriers (if applicable). - Set the
UtilityTraceParameters.traceConfigurationwith the utility tier'sdefaultTraceConfiguration()function. - Run a
UtilityNetwork.tracewith the specified parameters. - For every
FeatureLayerin the map, select the features using theUtilityElement.objectIdfrom the filtered list ofUtilityElementTraceResult.elements.
Relevant API
- GeometryEngine.fractionAlong
- ServiceGeodatabase
- UtilityAssetType
- UtilityDomainNetwork
- UtilityElement
- UtilityElementTraceResult
- UtilityNetwork
- UtilityNetworkDefinition
- UtilityNetworkSource
- UtilityTerminal
- UtilityTier
- UtilityTraceConfiguration
- UtilityTraceParameters
- UtilityTraceResult
- UtilityTraceType
- UtilityTraversability
About the data
The Naperville electrical network feature service, hosted on ArcGIS Online (authentication required: this is handled within the sample code), contains a utility network used to run the subnetwork-based trace shown in this sample.
Additional information
Using utility network on ArcGIS Enterprise 10.8 requires an ArcGIS Enterprise member account licensed with the Utility Network user type extension. Please refer to the utility network services documentation.
Credentials:
- Username: viewer01
- Password: I68VGU^nMurF
Tags
condition barriers, downstream trace, network analysis, subnetwork trace, trace configuration, traversability, upstream trace, utility network, validate consistency
Sample Code
// [WriteFile Name=TraceUtilityNetwork, Category=UtilityNetwork]
// [Legal]
// Copyright 2019 Esri.
// Licensed under the Apache License, Version 2.0 (the "License");
// you may not use this file except in compliance with the License.
// You may obtain a copy of the License at
// http://www.apache.org/licenses/LICENSE-2.0
// Unless required by applicable law or agreed to in writing, software
// distributed under the License is distributed on an "AS IS" BASIS,
// WITHOUT WARRANTIES OR CONDITIONS OF ANY KIND, either express or implied.
// See the License for the specific language governing permissions and
// limitations under the License.
// [Legal]
import QtQuick
import QtQuick.Layouts
import QtQuick.Controls
import Esri.ArcGISRuntime
Rectangle {
id: rootRectangle
width: 800
height: 600
property bool junctionSelected: false
property Point clickPoint
property var barriers: []
property var deviceObjIds: []
property var domainNetwork
property var element
property var identifiedFeature
property var lineObjIds: []
property var mediumVoltageTier
property var myTraceResult
property var startingLocations: []
property var terminal
property var terminals: []
property var utilityNetworkSource
readonly property url featureLayerUrl: "https://sampleserver7.arcgisonline.com/server/rest/services/UtilityNetwork/NapervilleElectric/FeatureServer"
MapView {
id: mapView
anchors.fill: parent
Component.onCompleted: {
// Set the focus on MapView to initially enable keyboard navigation
forceActiveFocus();
}
Credential {
id: credentials
username: "viewer01"
password: "I68VGU^nMurF"
}
Map {
Basemap {
initStyle: Enums.BasemapStyleArcGISStreetsNight
}
onComponentCompleted: {
serviceGeodatabase.load();
utilityNetwork.load();
}
ServiceGeodatabase {
id: serviceGeodatabase
url: featureLayerUrl
credential: credentials
onLoadStatusChanged: {
if (loadStatus === Enums.LoadStatusLoaded) {
// Set feature layer feature table properties using the appropriate serviceGeodatabase table
lineLayer.featureTable = serviceGeodatabase.tableWithLayerIdAsInt(3);
deviceLayer.featureTable = serviceGeodatabase.tableWithLayerIdAsInt(0);
}
}
}
ViewpointExtent {
Envelope {
xMin: -9813547.35557238
yMin: 5129980.36635111
xMax: -9813185.0602376
yMax: 5130215.41254146
spatialReference: Factory.SpatialReference.createWebMercator();
}
}
// Add the layer with electric distribution lines.
FeatureLayer {
id: lineLayer
UniqueValueRenderer {
fieldNames: ["ASSETGROUP"]
// set for medium voltage
UniqueValue {
label: "Medium Voltage"
values: ["5"]
SimpleLineSymbol {
style: Enums.SimpleLineSymbolStyleSolid
color: "DarkCyan"
width: 3
}
}
// set for low voltage
UniqueValue {
label: "Low Voltage"
values: ["3"]
SimpleLineSymbol {
style: Enums.SimpleLineSymbolStyleDash
color: "DarkCyan"
width: 3
}
}
}
onSelectFeaturesStatusChanged: checkSelectionStatus();
}
// Add the layer with electric devices.
FeatureLayer {
id: deviceLayer
onSelectFeaturesStatusChanged: checkSelectionStatus();
}
}
GraphicsOverlay {
id: unGraphicsOverlay
}
onMouseClicked: mouse => {
const screenX = mouse.x;
const screenY = mouse.y;
const tolerance = 10;
const returnPopups = false;
clickPoint = mouse.mapPoint;
mapView.identifyLayers(screenX, screenY, tolerance, returnPopups);
}
onIdentifyLayersStatusChanged : {
if (identifyLayersStatus !== Enums.TaskStatusCompleted)
return;
const results = mapView.identifyLayersResults;
const result = results[0];
if (!result) {
dialogText.text = qsTr("Could not identify location.")
traceCompletedDialog.open();
return;
}
identifiedFeature = result.geoElements[0];
utilityNetworkSource = utilityNetwork.definition.networkSource(identifiedFeature.featureTable.tableName);
// get domain network
domainNetwork = utilityNetwork.definition.domainNetwork("ElectricDistribution");
const tiers = domainNetwork.tiers;
for (let i = 0; i < tiers.length; i++) {
if (tiers[i].name === "Medium Voltage Radial")
mediumVoltageTier = tiers[i];
}
if (utilityNetworkSource.sourceType === Enums.UtilityNetworkSourceTypeJunction) {
junctionSelected = true;
const assetGroupFieldName = identifiedFeature.featureTable.subtypeField;
const assetGroupCode = identifiedFeature.attributes.attributeValue(assetGroupFieldName);
let assetGroup;
for (let i = 0; i < utilityNetworkSource.assetGroups.length; i++) {
if (utilityNetworkSource.assetGroups[i].code === assetGroupCode) {
assetGroup = utilityNetworkSource.assetGroups[i];
break;
}
}
const assetTypeCode = identifiedFeature.attributes.attributeValue("assettype");
let assetType;
for (let i = 0; i < assetGroup.assetTypes.length; i++) {
if (assetGroup.assetTypes[i].code === assetTypeCode) {
assetType = assetGroup.assetTypes[i];
break;
}
}
terminals = assetType.terminalConfiguration.terminals;
if (terminals.length > 1) {
multiTerminal.visible = true;
return;
} else if (terminals.length === 1) {
element = utilityNetwork.createElementWithArcGISFeature(identifiedFeature, terminals[0]);
}
} else if (utilityNetworkSource.sourceType === Enums.UtilityNetworkSourceTypeEdge) {
junctionSelected = false;
element = utilityNetwork.createElementWithArcGISFeature(identifiedFeature);
// Compute how far tapped location is along the edge feature.
if (identifiedFeature.geometry.geometryType === Enums.GeometryTypePolyline) {
const line = GeometryEngine.removeZ(identifiedFeature.geometry);
// Set how far the element is along the edge.
element.fractionAlongEdge = GeometryEngine.fractionAlong(line, clickPoint, -1);
}
}
addToParamAndGraphic();
}
}
SimpleMarkerSymbol {
id: startingPointSymbol
style: Enums.SimpleMarkerSymbolStyleCross
color: "lime"
size: 20
}
SimpleMarkerSymbol {
id: barrierPointSymbol
style: Enums.SimpleMarkerSymbolStyleX
color: "red"
size: 20
}
UtilityNetwork {
id: utilityNetwork
url: featureLayerUrl
credential: credentials
onTraceStatusChanged: {
if (traceStatus !== Enums.TaskStatusCompleted)
return;
if (traceResult.count === 0) {
busy.visible = false;
return;
}
dialogText.text = qsTr("Trace completed.");
traceCompletedDialog.open();
myTraceResult = traceResult.get(0);
const resultElements = myTraceResult.elements;
for (let i = 0; i < resultElements.length; i++) {
if (resultElements[i].networkSource.name === "Electric Distribution Device") {
deviceObjIds.push(resultElements[i].objectId);
} else if (resultElements[i].networkSource.name === "Electric Distribution Line") {
lineObjIds.push(resultElements[i].objectId);
}
}
const deviceParams = ArcGISRuntimeEnvironment.createObject("QueryParameters");
const lineParams = ArcGISRuntimeEnvironment.createObject("QueryParameters");
deviceParams.objectIds = deviceObjIds;
lineParams.objectIds = lineObjIds;
deviceLayer.selectFeaturesWithQuery(deviceParams, Enums.SelectionModeAdd);
lineLayer.selectFeaturesWithQuery(lineParams, Enums.SelectionModeAdd);
}
onErrorChanged: {
busy.visible = false;
dialogText.text = qsTr("%1 - %2".arg(error.message).arg(error.additionalMessage));
traceCompletedDialog.open();
}
onComponentCompleted: {
busy.visible = true;
load();
}
onLoadStatusChanged: {
if (loadStatus === Enums.LoadStatusLoaded)
busy.visible = false;
}
}
UtilityTraceParameters {
id: params
}
Dialog {
id: multiTerminal
modal: true
standardButtons: Dialog.Ok | Dialog.Cancel
x: Math.round(parent.width - width) / 2
y: Math.round(parent.height - height) / 2
ColumnLayout {
Text {
text: qsTr("Select the terminal for this junction.")
Layout.alignment: Qt.AlignHCenter
}
ComboBox {
id: terminalSelection
model: ["High", "Low"]
Layout.alignment: Qt.AlignHCenter
}
}
onAccepted: {
terminal = terminals[terminalSelection.currentIndex];
element = utilityNetwork.createElementWithArcGISFeature(identifiedFeature, terminal);
addToParamAndGraphic();
}
}
Dialog {
id: traceCompletedDialog
modal: true
standardButtons: Dialog.Ok
x: Math.round(parent.width - width) / 2
y: Math.round(parent.height - height) / 2
Text {
id: dialogText
anchors.centerIn: parent
}
}
BusyIndicator {
id: busy
anchors.centerIn: parent
visible: false
}
Rectangle {
id: backBox
anchors {
left: parent.left
top: parent.top
margins: 3
}
width: childrenRect.width
height: childrenRect.height
color: "lightgrey"
opacity: 0.8
radius: 5
// catch mouse signals from propagating to parent
MouseArea {
anchors.fill: parent
onClicked: mouse => mouse.accepted = true
onWheel: wheel => wheel.accepted = true
}
Column {
GridLayout {
columns: 2
rows: 3
property var centerAlignment: Qt.AlignHCenter | Qt.AlignVCenter
flow: GridLayout.LeftToRight
RadioButton {
id: startingLocBtn
checked: true
text: qsTr("Add starting location(s)")
Layout.alignment: Qt.AlignHCenter | Qt.AlignVCenter
}
RadioButton {
id: barriersBtn
text: qsTr("Add barrier(s)")
Layout.alignment: Qt.AlignHCenter | Qt.AlignVCenter
}
Text {
text: qsTr("Trace Type:")
Layout.alignment: Qt.AlignHCenter | Qt.AlignVCenter
}
ComboBox {
id: traceTypes
Layout.alignment: Qt.AlignHCenter | Qt.AlignVCenter
model: ["Connected", "Subnetwork", "Upstream", "Downstream"]
}
Button {
id: resetBtn
text: qsTr("Reset")
Layout.alignment: Qt.AlignHCenter | Qt.AlignVCenter
enabled: !busy.visible
onClicked: {
params.barriers = null;
barriers = [];
params.startingLocations = null;
startingLocations = [];
deviceObjIds = [];
lineObjIds = [];
mapView.graphicsOverlays.get(0).graphics.clear();
mapView.map.operationalLayers.forEach(layer => layer.clearSelection());
}
}
Button {
id: traceBtn
text: qsTr("Trace")
Layout.alignment: Qt.AlignHCenter | Qt.AlignVCenter
enabled: !busy.visible
onClicked: {
busy.visible = true;
switch (traceTypes.currentIndex) {
case 0:
params.traceType = Enums.UtilityTraceTypeConnected;
break;
case 1:
params.traceType = Enums.UtilityTraceTypeSubnetwork;
break;
case 2:
params.traceType = Enums.UtilityTraceTypeUpstream;
break;
case 3:
params.traceType = Enums.UtilityTraceTypeDownstream;
}
// check to see if it exists before assigning it to the parameters.
if (mediumVoltageTier)
params.traceConfiguration = mediumVoltageTier.defaultTraceConfiguration();
// Perform a connected trace on the utility network
utilityNetwork.trace(params);
}
}
}
Text {
// Displays fraction along edge
text: junctionSelected ? qsTr("Junction Selected") : qsTr("Fraction along edge: %1".arg(element ? element.fractionAlongEdge.toFixed(6) : 0.0.toFixed(6)))
anchors.horizontalCenter: parent.horizontalCenter
}
}
}
function addToParamAndGraphic() {
if (startingLocBtn.checked) {
startingLocations.push(element);
params.startingLocations = startingLocations;
} else {
barriers.push(element);
params.barriers = barriers;
}
const graphic = ArcGISRuntimeEnvironment.createObject("Graphic", {
geometry: clickPoint,
symbol: startingLocBtn.checked ? startingPointSymbol : barrierPointSymbol
});
unGraphicsOverlay.graphics.append(graphic);
}
function checkSelectionStatus() {
if (!(lineLayer.selectFeaturesStatus && deviceLayer.selectFeaturesStatus))
return;
busy.visible = false;
}
}