NOAA’s Water Column Sonar Data map viewer provides easy discovery and selection of 33 terabytes of sonar data. Excellent query tools help you identify data of interest and provide file-level selection to ensure you get the information you need.
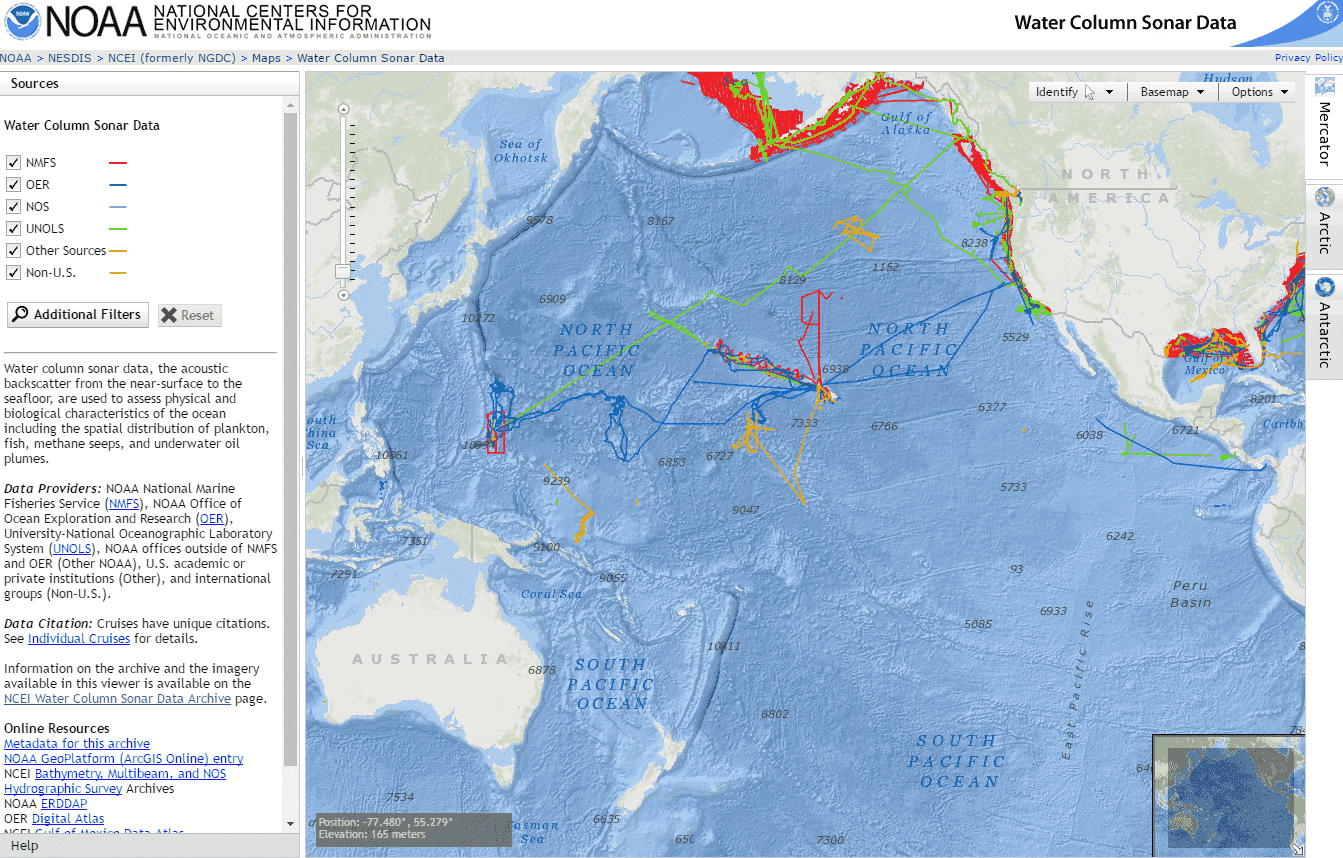
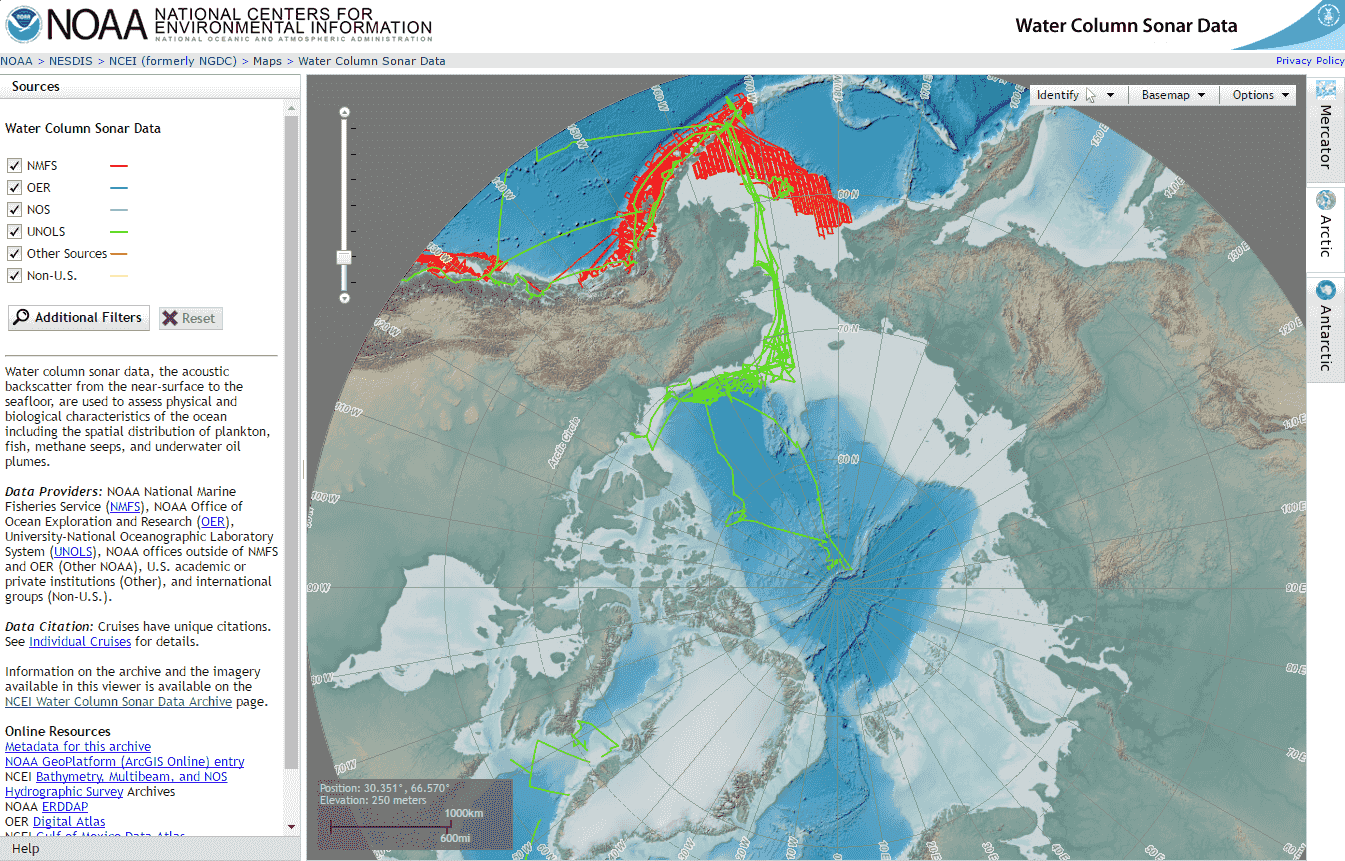
Water column sonar data comes from the acoustic backscatter from the near-surface to the seafloor. It’s used to assess the ocean’s physical and biological characteristics including spatial distribution of plankton and fish as well as methane seeps and underwater oil plumes.
Those working to map methane seeps are finding great value in the Water Column Sonar Data map viewer, created by NOAA’s National Centers for Environmental Information (NCEI). Scientists from oil and gas industries use it to identify and access data for exploration survey analysis. Academic researchers use it to analyze various US regions for methane seeps.
The Water Column Sonar Data map viewer provides easy discovery of 33 terabytes of data in the archive and excellent query tools to help distill the data of interest. It offers file-level selection to ensure users get exactly the data desired. These capabilities have decreased the volume of data being transferred, allowing for a more efficient process. Now, users are able to test specific files against the algorithms and other workflows they are developing.