There are different ways to style your data to create different types of visualizations. You can style basemap layers, which are composed of vector tile data, or feature layers, which are composed of features.
Basemap styles
You can use the default styles or you can create your own basemap styles that work with the basemap styles service. The following types are available:
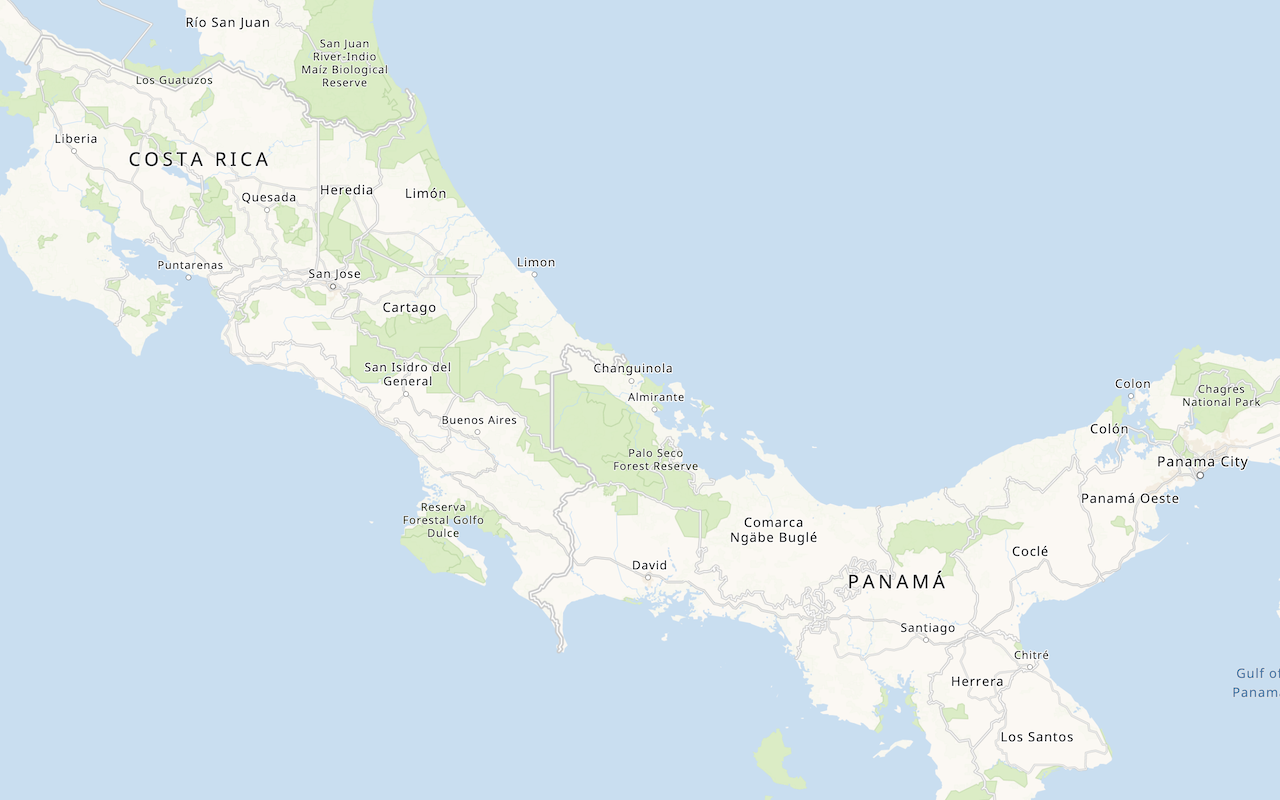
- Default styles: Enumerations for existing styles such as
arcgis/streets,arcgis/outdoor, andarcgis/nova. - Custom styles: Styles you create and save as items using the ArcGIS Vector Tile Style Editor.
How to display a custom basemap style
- Create a style with the ArcGIS Vector Tile Style Editor.
- Go to the new basemap layer's item page and copy its item ID.
- Reference the Esri Leaflet and vector plugins.
- Instantiate the
L.esri.Vector.vectorclass and set the item ID.Basemap Layer
Example
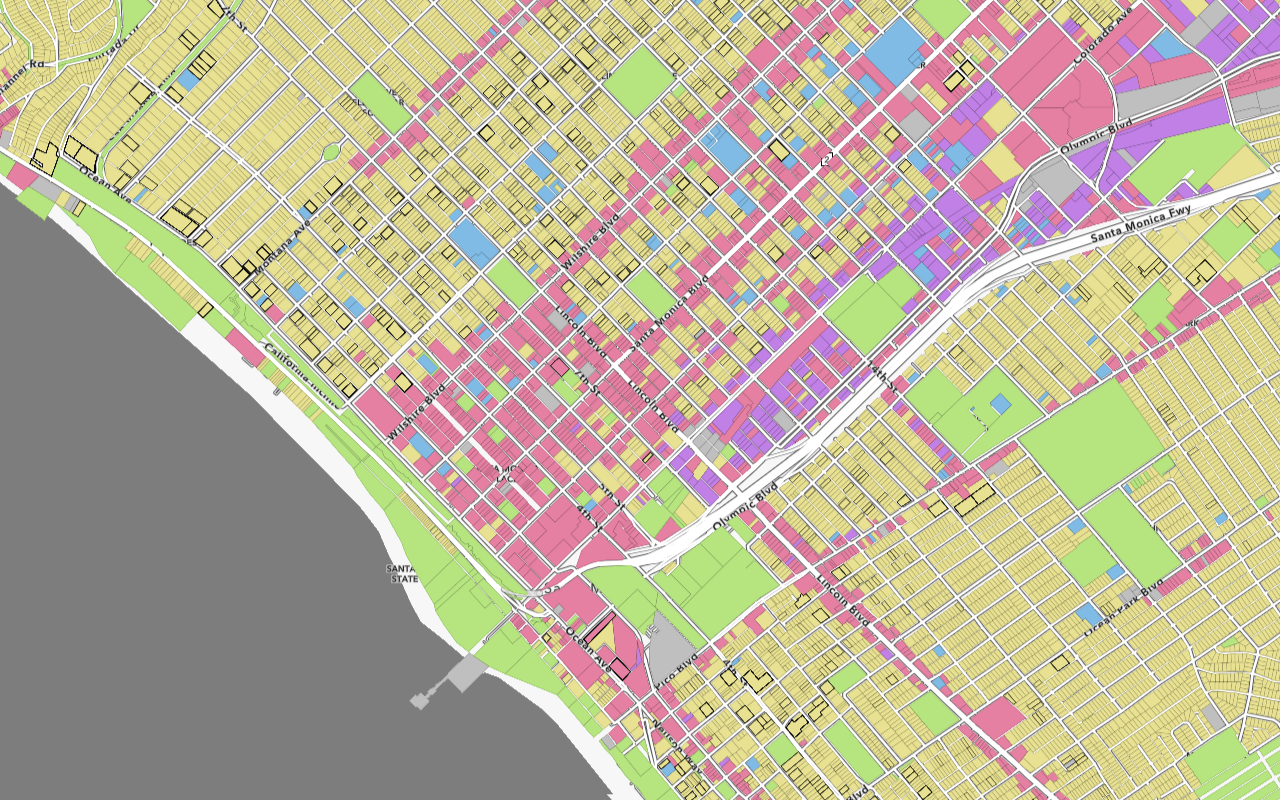
Display a custom basemap layer
This example illustrates how you can set the item ID of a custom vector basemap layer in place of a default basemap layer style.
<script src="https://unpkg.com/esri-leaflet@3.0.12/dist/esri-leaflet.js"
integrity="sha512-oUArlxr7VpoY7f/dd3ZdUL7FGOvS79nXVVQhxlg6ij4Fhdc4QID43LUFRs7abwHNJ0EYWijiN5LP2ZRR2PY4hQ=="
crossorigin=""></script>
<script src="https://unpkg.com/esri-leaflet-vector@4.2.3/dist/esri-leaflet-vector.js"
integrity="sha512-7rLAors9em7cR3/583gZSvu1mxwPBUjWjdFJ000pc4Wpu+fq84lXF1l4dbG4ShiPQ4pSBUTb4e9xaO6xtMZIlA=="
crossorigin=""></script>
<script>
L.esri.Vector.vectorBasemapLayer("6976148c11bd497d8624206f9ee03e30", {
apiKey: apiKey
}).addTo(map);
</script>Feature styles
You can style and display points, lines, and polygons in a map by defining symbols for features. To style features in a feature layer, you define symbols and apply them with a renderer. For data-driven visualization, the symbol is always determined based on a data (attribute) value returned from a field in the data layer.
How to style a feature layer
- Import your data from a CSV, XLS, GeoJSON, or Shapefile file to create a hosted feature layer.
- Get the URL for the feature layer.
- Reference the Esri Leaflet plugin.
- Instantiate the
L.esri.featureclass and set the URL.Layer - Define the symbols for the features in the layer.
Example
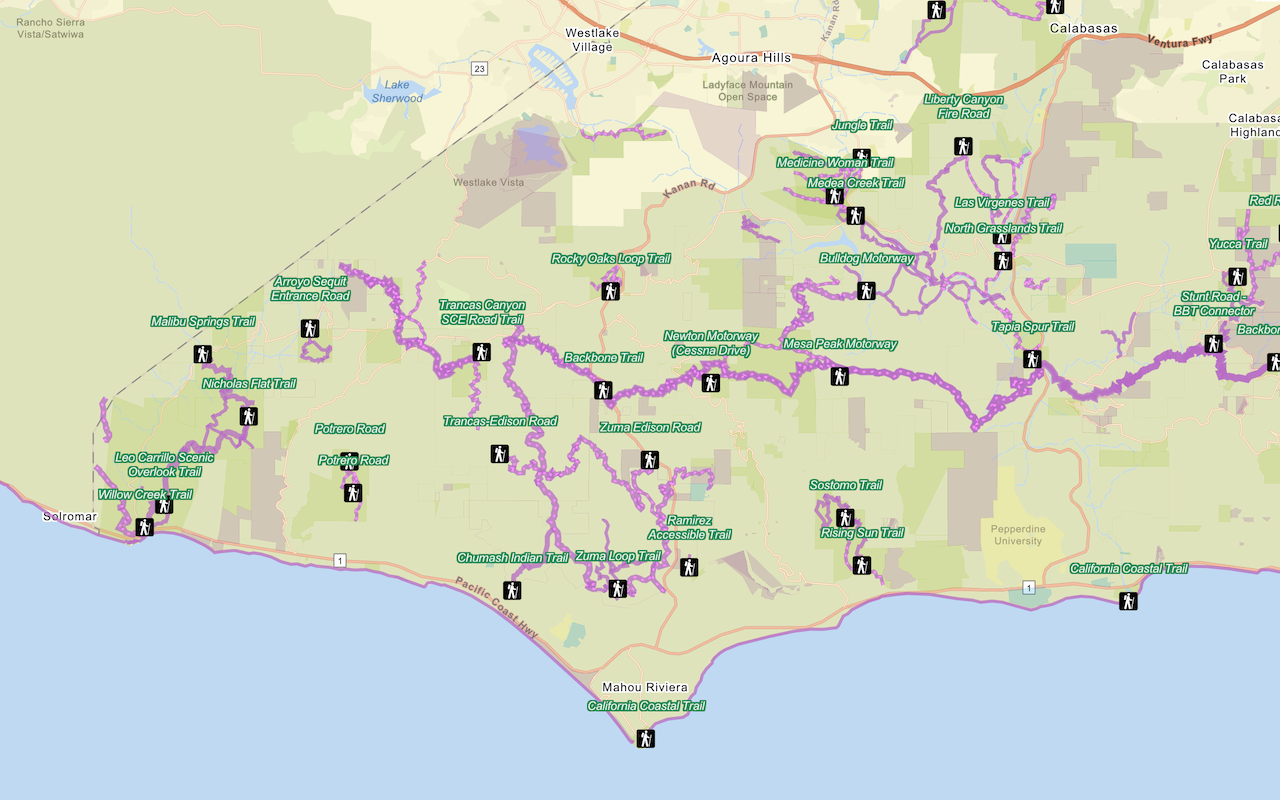
Style a feature layer (polylines)
In this example, you filter features in a feature layer so that only bike trails are styled.
<script src="https://unpkg.com/esri-leaflet@3.0.12/dist/esri-leaflet.js"
integrity="sha512-oUArlxr7VpoY7f/dd3ZdUL7FGOvS79nXVVQhxlg6ij4Fhdc4QID43LUFRs7abwHNJ0EYWijiN5LP2ZRR2PY4hQ=="
crossorigin=""></script>
<script>
L.esri
.featureLayer({
url: "https://services3.arcgis.com/GVgbJbqm8hXASVYi/arcgis/rest/services/Trails/FeatureServer/0",
where: "USE_BIKE = 'YES'",
pane: "bikeTrails",
style: () => {
return {
color: "#FFFFFF",
dashArray: "2, 3",
dashOffset: "2",
weight: "1.5"
};
}
})
.addTo(map);
</script>