The Summarize Data module contains functions that calculate total counts, lengths, areas, and basic descriptive statistics of features and their attributes within areas or near other features.
aggregate_points calculates statistics about points that fall within specified areas or bins. join_features calculates statistics about features that share a spatial, temporal, or attribute relationship with other features. reconstruct_tracks calculates statistics about points or polygons that belong to the same track and reconstructs inputs into tracks. summarize_attributes calculates statistics about feature or tabular data that share attributes. summarize_within calculates statistics for area features and attributes that overlap each other.
aggregate_points
-
arcgis.geoanalytics.summarize_data.aggregate_points(point_layer, bin_type=None, bin_size=None, bin_size_unit=None, polygon_layer=None, time_step_interval=None, time_step_interval_unit=None, time_step_repeat_interval=None, time_step_repeat_interval_unit=None, time_step_reference=None, summary_fields=None, output_name=None, gis=None, future=False, context=None)¶ 
This
aggregate_pointstool works with a layer of point features and a layer of areas. The layer of areas can be an input polygon layer or it can be square or hexagonal bins calculated when the task is run. The tool first determines which points fall within each specified area. After determining this point-in-area spatial relationship, statistics about all points in the area are calculated and assigned to the area. The most basic statistic is the count of the number of points within the area, but you can get other statistics as well.For example, suppose you have point features of coffee shop locations and area features of counties, and you want to summarize coffee sales by county. Assuming the coffee shops have a TOTAL_SALES attribute, you can get the sum of all TOTAL_SALES within each county, the minimum or maximum TOTAL_SALES within each county, or other statistics like the count, range, standard deviation, and variance.
This tool can also work on data that is time-enabled. If time is enabled on the input points, then the time slicing options are available. Time slicing allows you to calculate the point-in area relationship while looking at a specific slice in time. For example, you could look at hourly intervals, which would result in outputs for each hour.
For an example with time, suppose you had point features of every transaction made at a coffee shop location and no area layer. The data has been recorded over a year, and each transaction has a location and a time stamp. Assuming each transaction has a TOTAL_SALES attribute, you can get the sum of all TOTAL SALES within the space and time of interest. If these transactions are for a single city, we could generate areas that are one kilometer grids, and look at weekly time slices to summarize the transactions in both time and space.
Note
Either
bin_typeorpolygon_layermust be specified. Ifbin_typeis used, bothbin_sizeandbin_size_unitmust be included.Parameter
Description
point_layer
Required point
FeatureLayer. The point features that will be aggregated into the polygons in thepolygon_layeror bins specified bybin_type. See Feature Input.bin_type
Optional string. If
polygon_layeris not provided, it is required.The type of bin that will be generated and into which points will be aggregated.
Choice list:
SquareHexagon
The default value is
Square.Note
Required if
polygon_layernot provided.bin_size (Required if
bin_typeis used)Optional float. The dimension for each bin of
bin_typethat thepoint_layerwill be aggregated into.if
Square- the height and length of the sidesif
Hexagon- the distance between parallel sides
bin_size_unit (Required if
bin_sizeis used)Optional string. The unit for the bins specified by
bin_typethat thepoint_layerwill be aggregated into.Choice list:
FeetYardsMilesMetersKilometersNauticalMiles
- For
bin_type: if
Square- the units ofbin_sizethe height and length of the sidesif
Hexagon- the units ofbin_sizebetween parallel sides
polygon_layer
Optional polygon
feature layer. The polygon features (areas) into which the input points will be aggregated. See Feature Input.Note
Required if
bin_typenot provided.time_step_interval
Optional integer. A numeric value that specifies duration of the time step interval. This option is only available if the input points are time-enabled and represent an instant in time.
The default value is
None.time_step_interval_unit
Optional string. A string that specifies units of the time step interval.
Note
Only available if input points are time-enabled and represent an instant in time.
Choice list:
YearsMonthsWeeksDaysHoursMinutesSecondsMilliseconds
The default value is
None.time_step_repeat_interval
Optional integer. A numeric value that specifies how often the time step repeat occurs. This option is only available if the input points are time-enabled and of time type instant.
time_step_repeat_interval_unit
Optional string. A string that specifies the temporal unit of the step repeat.
Note
This option is only available if the input points are time-enabled and of time type instant.
- Choice list:
YearsMonthsWeeksDaysHoursMinutesSecondsMilliseconds
The default value is
None.time_step_reference
Optional datetime. A date that specifies the reference time to align the time slices to, represented in milliseconds from epoch. The default is January 1, 1970, at 12:00 a.m. (epoch time stamp 0). This option is only available if the input points are time-enabled and of time type instant.
summary_fields
Optional list of dicts. A list of field names and statistical summary types that you want to calculate for all points within each polygon or bin. Note that the count of points within each polygon is always returned. By default, all statistics are returned.
Example:
[{"statisticType": "Count", "onStatisticField": "fieldName1"}, {"statisticType": "Any", "onStatisticField": "fieldName2"}]onStatisticFieldis the name of the field in the input point layer.statisticTypeis one of the following:for numeric fields:
Count- Totals the number of values of all the points in each polygon.Sum- Adds the total value of all the points in each polygon.Mean- Calculates the average of all the points in each polygon.Min- Finds the smallest value of all the points in each polygon.Max- Finds the largest value of all the points in each polygon.Range- Finds the difference between the Min and Max values.Stddev- Finds the standard deviation of all the points in each polygon.Var- Finds the variance of all the points in each polygon.
for string fields:
Count- Totals the number of strings for all the points in each polygon.Any- Returns a sample string of a point in each polygon.
output_name
Optional string. The method will create a feature service of the results. You define the name of the service.
gis
Optional, the
GISon which this tool runs. If not specified, the active GIS is used.context
Optional dict. The context parameter contains additional settings that affect task execution. For this task, there are four settings:
extent- a bounding box that defines the analysis area. Only those features that intersect the bounding box will be analyzed.processSR- The features will be projected into this coordinate system for analysis.outSR- the features will be projected into this coordinate system after the analysis to be saved. The output spatial reference for the spatiotemporal big data store is always WGS84.dataStore- results will be saved to the specified data store. For ArcGIS Enterprise, the default is the spatiotemporal big data store.
future
Optional boolean. If
True, a future object will be returned and the process will not wait for the task to complete. The default isFalse, which means wait for results.- Returns
result_layer : Output Features as
FeatureLayer.
# Usage Example: To aggregate number of 911 calls within 1 km summarized by Day count.

agg_result = aggregate_points(calls,
                              bin_size=1,
                              bin_size_unit='Kilometers',
                              time_step_interval=1,
                              time_step_interval_unit="Years",
                              summary_fields=[{"statisticType": "Count", "onStatisticField": "Day"}],
                              output_name='testaggregatepoints01')
build_multivariable_grid
-
arcgis.geoanalytics.summarize_data.build_multivariable_grid(input_layers, variable_calculations, bin_size, bin_unit='Meters', bin_type='Square', output_name=None, gis=None, future=False, context=None)¶ 
The
build_multivariable_gridtask works with one or more layers of point, line, or polygon features. The task generates a grid of square or hexagonal bins and compiles information about each input layer into each bin. For each input layer, this information can include the following variables:Distance to Nearest- The distance from each bin to the nearest feature.Attribute of Nearest- An attribute value of the feature nearest to each bin.Attribute Summary of Related- A statistical summary of all features withinsearch_distanceof each bin.
Only variables you specify in
variable_calculationswill be included in the result layer. These variables can help you understand the proximity of your data throughout the extent of your analysis. The results can help you answer questions such as the following:Given multiple layers of public transportation infrastructure, what part of the city is least accessible by public transportation?
Given layers of lakes and rivers, what is the name of the water body closest to each location in the U.S.?
Given a layer of household income, where in the U.S. is the variation of income in the surrounding 50 miles the greatest?
The result of
build_multivariable_gridcan also be used in prediction and classification workflows. The task allows you to calculate and compile information from many different data sources into a single, spatially continuous layer in one step. This layer can then be used with the Enrich From Multi-Variable Grid task to quickly enrich point features with the variables you have calculated, reducing the amount of effort required to build prediction and classification models from point data.Parameter
Description
input_layers
Required list of layers. A list of input layers that will be used in analysis. See Feature Input.
variable_calculations
Required list of dicts. A dict containing objects that describe the variables that will be calculated for each layer in
input_layers.variable_calculations = [ { "layer":<index>, "variables":[ { "type":"DistanceToNearest", "outFieldName":"<output field name>", "searchDistance":<number>, "searchDistanceUnit":"<unit>", "filter":"<filter>" }, { "type":"AttributeOfNearest", "outFieldName":"<output field name>", "attributeField":"<field name>", "searchDistance":<number>, "searchDistanceUnit":"<unit>", "filter":"<filter>" }, { "type":"AttributeSummaryOfRelated", "outFieldName":"<output field name>", "statisticType":"<statistic type>", "statisticField":"<field name>", "searchDistance":<number>, "searchDistanceUnit":"<unit>", "filter":"<filter>" }, ] }, ]
Description of the above snippet:
layeris the index of the layer ininput_layersthat will be used to calculate the specified variables.variablesis an array of dict objects that describe the variables you want to include in the result layer. The array must contain at least one variable for each layer.typecan be one of the following variable types:DistanceToNearest
AttributeOfNearest
AttributeSummaryOfRelated
Each type must be configured with a unique set of parameters:
outFieldNameis the name of the field that will be created in the result layer to store a variable. This is required.searchDistanceis a number andsearchDistanceUnitis a linear unit.- For:
DistanceToNearestandAttributeOfNearest- both are required to define the maximum distance that the tool will search from the center of each bin to find a feature in the layer. If no feature is within the distance, null is returned.AttributeSummaryOfRelated- , they are optional to define the radius of a circular neighborhood surrounding each bin. All features that intersect this neighborhood will be used to calculatestatisticType. If a distance is not defined, only features that intersect a bin will be used to calculatestatisticType.
attributeFieldis required byAttributeOfNearestand is the name of a field ` in the input layer. The value of this field in the closest feature to each bin will be included in the result layer.statisticFieldis required byAttributeSummaryOfRelatedand is the name of a field in the input layer. This field’s values will be used to calculatestatisticType.statisticTypeis required byAttributeSummaryOfRelatedand is one of the followingwhen
statisticFieldis a numeric field:Count- Totals the number of features near or intersecting each bin.Sum- Adds the total value of all features near or intersecting each bin.Mean- Calculates the average of all features near or intersecting each bin.Min- Finds the smallest value of all features near or intersecting each bin.Max- Finds the largest value of all features near or intersecting each bin.Range- Finds the difference between Min and Max.Stddev- Finds the standard deviation of all features near or intersecting each bin.Var- Finds the variance of all features near or intersecting each bin.
when
statisticFieldis a string field:Count- Totals the number of strings for all features near or intersecting each bin.Any- Returns a sample string of all features near or intersecting each bin.
filteris optional for all variable types and is formatted as described in the Feature Input topic.
bin_size
Required float. The distance for the bins of type
bin_typein the output polygon layer.variable_calculationswill be calculated at the center of each bin. When generating bins,if
bin_typeisSquare- the number and units specified determine the height and length of the square.if
bin_typeisHexagon0 the number and units specified determine the distance between parallel sides.
bin_unit
Optional string. The distance unit for the bins that will be used to calculate
variable_calculations.Choice list:
FeetYardMilesMetersKilometersNauticalMiles
bin_type
Optional string. The type of bin that will be used to generate the result grid. Bin options are the following:
Choice list:
HexagonSquare
Note
Analysis using
SquareorHexagonbins requires a projected coordinate system. When aggregating layers into bins, the input layers or processing extent (processSR) must have a projected coordinate system. If a projected coordinate system is not specified when running analysis, the World Cylindrical Equal Area (WKID 54034) projection will be used.At 10.7 or later, if a projected coordinate system is not specified when running analysis, a projection will be picked based on the extent of the data.
output_name
Optional string. The task will create a feature service of the results. You define the name of the service.
context
Optional string. The context parameter contains additional settings that affect task execution. For this task, there are four settings:
extent- a bounding box that defines the analysis area. Only those features that intersect the bounding box will be analyzed.processSRThe features will be projected into this coordinate system for analysis.outSR- the features will be projected into this coordinate system after the analysis to be saved. The output spatial reference for the spatiotemporal big data store is always WGS84.dataStore- results will be saved to the specified data store. For ArcGIS Enterprise, the default is the spatiotemporal big data store.
future
Optional boolean. If
True, a future object will be returned and the process will not wait for the task to complete. The default isFalse, which means wait for results.- Returns
boolean
# Usage Example: To create multivariable grid by summarizing information such as distance to nearest

variables = [ { "layer":0,
                "variables":[
                    { "type":"DistanceToNearest",
                      "outFieldName":"road",
                      "searchDistance":10,
                      "searchDistanceUnit":"Kilometers"
                    }
                ]
              },
              { "layer":1,
              "variables":[
                  { "type":"AttributeSummaryOfRelated",
                    "outFieldName":"MeanPopAge",
                    "statisticType":"Mean",
                    "statisticField":"Age",
                    "searchDistance":50,
                    "searchDistanceUnit":"Kilometers"
                  }
              ]
              }
            ]
grid = build_multivariable_grid(input_layers=[lyr0, lyr1],
                                variable_calculations=variables,
                                bin_size=100,
                                bin_unit='Meters',
                                bin_type='Square',
                                output_name="multi_variable_grid")
describe_dataset
-
arcgis.geoanalytics.summarize_data.describe_dataset(input_layer, extent_output=False, sample_size=None, output_name=None, gis=None, context=None, future=False, return_tuple=False)¶ 
The
describe_datasettask provides an overview of your big data. The tool outputs a feature layer representing a sample of your input features or a single polygon feature layer that represents the extent of your input features. You can choose to output one, both, or none.For example, imagine you are tasked with completing an analysis workflow on a large volume of data. You want to try the workflow, but it could take hours or days with your full dataset. Instead of using time and resources running the full analysis, first create a sample layer to efficiently test your workflow before running it on the full dataset.
Note
Only available at ArcGIS Enterprise 10.7 and later.
See Describe Dataset for additional information.
Parameter
Description
input_layer
Required feature layer. The table, point, line, or polygon feature layer that will be described, summarized, and sampled. See Feature Input.
extent_output
Optional boolean. The task will output a single rectangle feature representing the extent of the
input_layerif this value is set to ‘True’.The default value is
False.sample_size
Optional integer. The task will output a feature layer representing a sample of features from the
input_layer. Specify the number of sample features to return. If the input value is 0 or empty then no sample layer will be created. The output will have the same schema, geometry, and time type as the input layer.output_name
Optional string. The task will create a feature layer of the results. You define the name of the service.
gis
Optional
GIS. The GIS object where the analysis will take place.context
Optional dict. The context parameter contains additional settings that affect task execution. For this task, there are four settings:
extent- A bounding box that defines the analysis area. Only those features that intersect the bounding box will be analyzed.processSR- The features will be projected into this coordinate system for analysis.outSR- The features will be projected into this coordinate system after the analysis to be saved. The output spatial reference for the spatiotemporal big data store is always WGS84.dataStore- Results will be saved to the specified data store. For ArcGIS Enterprise, the default is the spatiotemporal big data store.
future
Optional boolean. If
True, a future object will be returned and the process will not wait for the task to complete. The default isFalse, which means wait for results.return_tuple
Optional boolean. If
True, a named tuple with multiple output keys is returned. The default value isFalse.- Returns
if
return_tupleisTrue, an tuple with the following keys:”output_json” : dict
”output” :
Layer”extent_layer” :
FeatureLayer”sample_layer” :
FeatureLayer”process_info” : list
if return_tuple`` is
False:FeatureLayerof the results.
if
futureisTrue:a job object with a
result()method to access results
# Usage Example: To get an overview of your big data item

data = describe_dataset(input_layer=big_data_layer,
                        extent_output=True,
                        sample_size=2000,
                        output_name="describe dataset")
join_features
-
arcgis.geoanalytics.summarize_data.join_features(target_layer, join_layer, join_operation='JoinOneToOne', join_fields=None, summary_fields=None, spatial_relationship=None, spatial_near_distance=None, spatial_near_distance_unit=None, temporal_relationship=None, temporal_near_distance=None, temporal_near_distance_unit=None, attribute_relationship=None, join_condition=None, output_name=None, gis=None, context=None, future=False, keep_target=None)¶ 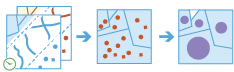
Using either feature layers or tabular data, you can join features and records based on specific relationships between the input layers or tables. Joins will be determined by spatial, temporal, and attribute relationships, and summary statistics can be optionally calculated.
For example
Given point locations of crime incidents with a time, join the crime data to itself specifying a spatial relationship of crimes within 1 kilometer of each other and that occurred within 1 hour of each other to determine if there are a sequence of crimes close to each other in space and time.
Given a table of ZIP Codes with demographic information and area features representing residential buildings, join the demographic information to the residences so each residence now has the information.
The
join_featurestask works with two layers.join_featuresjoins attributes from one feature to another based on spatial, temporal, and attribute relationships or some combination of the three. The tool determines all input features that meet the specified join conditions and joins the second input layer to the first. You can optionally join all features to the matching features or summarize the matching features.join_featurescan be applied to points, lines, areas, and tables. A temporal join requires that your input data is time-enabled, and a spatial join requires that your data has a geometry.See Join Features for additional information.
Parameter
Description
target_layer
Required layer. The table, point, line, or polygon features to be joined to. See Feature Input.
join_layer
Required layer. The point, line, or polygon features that will be joined to the
target_layer. See Feature Input.join_operation
Optional string. A string representing the type of join that will be applied.
Choice list:
JoinOneToOne- If multiple join features are found that have the same relationships with a single target feature, the attributes from the multiple join features will be aggregated using the specified summary statistics. For example, if a point target feature is found within two separate polygon join features, the attributes from the two polygons will be aggregated before being transferred to the output point feature class. If one polygon has an attribute value of 3 and the other has a value of 7, and a SummaryField of sum is selected, the aggregated value in the output feature class will be 10. There will always be a Count field calculated, with a value of 2, for the number of features specified. This is the default.JoinOneToMany- If multiple join features are found that have the same relationship with a single target feature, the output feature class will contain multiple copies (records) of the target feature. For example, if a single point target feature is found within two separate polygon join features, the output feature class will contain two copies of the target feature: one record with the attributes of the first polygon, and another record with the attributes of the second polygon. There are no summary statistics calculated with this method.
The default value is
JoinOneToOne.join_fields
Optional list of dicts. A list of modifications to field names in the joinLayer to be made before completing analysis. Any field that is removed will not have statistics calculated on it.
Syntax:
[{ "action" : "action", "field" : "fieldname1"}, { "action" : "action", "field" : "initial_fieldname", "to" : "new_fieldname"}]actioncan be the following:remove - Remove a field from analysis and output .
rename - Rename a field before running analysis.
summary_fields
Optional list of dicts. A list of field names and statistical summary types you want to calculate. Note that the count is always returned. By default, all statistics are returned.
Syntax:
[{"statisticType" : "<statistic type>", "onStatisticField" : "<field name>" }, ...]onStatisticFieldis the name of the field in the target layer.statisticTypeis one of the following:for numeric fields:
Count- Totals the number of values of all the points in each polygon.Sum- Adds the total value of all the points in each polygon.Mean- Calculates the average of all the points in each polygon.Min- Finds the smallest value of all the points in each polygon.Max- Finds the largest value of all the points in each polygon.Range- Finds the difference between the Min and Max values.Stddev- Finds the standard deviation of all the points in each polygon.Var- Finds the variance of all the points in each polygon.
for string fields:
Count- Totals the number of strings for all the points in each polygon.Any- Returns a sample string of a point in each polygon.
spatial_relationship
Optional string. Defines the spatial relationship used to spatially join features.
Choice list:
EqualsIntersectsContainsWithinCrossesTouchesOverlapsNearNearGeodesic
spatial_near_distance (Required if
spatial_relationshipis Near or NearGeodesic)Optional float. A float value used for the search distance to determine if the target features are near the join features.
Note
This is only applied if
NearorNearGeodesicis the selectedspatial_relationship. You can only enter a single distance value. The unit value is supplied by thespatial_near_distanceparameter.spatial_near_distance_unit (Required if
spatial_relationshipis Near or NearGeodesic)Optional string. The linear unit to be used with the distance value specified in
spatial_near_distance.Choice list:
FeetYardsMilesMetersKilometersNauticalMiles
temporal_relationship
Optional string. Defines the temporal relationship used to temporally join features.
Choice list :
EqualsIntersectsDuringContainsFinishesFinishedByMeetsMetByOverlapsOverlappedByStartsStartedByNear
temporal_near_distance (Required if
temporal_relationshipis Near, NearBefore, or NearAfter)Optional integer. An integer value used for the temporal search distance to determine if the target features are temporally near the join features.
Note
This is only applied if
Near,NearBefore, orNearAfteris the selectedtemporal_relationship. You can only enter a single value. distance value. The units of the distance values are supplied by thetemporal_near_distance_unitparameter.temporal_near_distance_unit (Required if
temporal_relationshipis Near, NearBefore, or NearAfter)Optional string.The temporal unit to be used with the distance value specified in
temporal_near_distance.Choice list:
YearsMonthsWeeksDaysHoursMinutesSecondsMilliseconds
attribute_relationship
Optional list of dicts. A target field, relationship, and join field used to join equal attributes.
Syntax:
[{ "targetField" : "fieldname1", "joinField" : "fieldname2", "operator" : "operator" }]join_condition
Optional string. Applies a condition to specified fields. Only features with fields that meet these conditions will be joined. For example, to apply a join to a dataset for only those features where health_spending is greater than 20 percent of income, apply a join condition of target[‘health_spending’] > (join[‘income’] * .20) using the field health_spending from the first dataset (
target_layer) and the income field from the second dataset (join_layer).output_name
Optional string. The task will create a feature service of the results. You define the name of the service.
gis
Optional
GIS. The GIS object where the analysis will take place.context
Optional dict. The context parameter contains additional settings that affect task execution. For this task, there are four settings:
extent- A bounding box that defines the analysis area. Only those features that intersect the bounding box will be analyzed.processSR- The features will be projected into this coordinate system for analysis.outSR- The features will be projected into this coordinate system after the analysis to be saved. The output spatial reference for the spatiotemporal big data store is always WGS84.dataStore- Results will be saved to the specified data store. For ArcGIS Enterprise, the default is the spatiotemporal big data store.
future
Optional boolean. If
True, a GPJob is returned instead of results. The GPJob can be queried on the status of the execution.The default value is
False.keep_target
Optional boolean. Specifies whether all target features will be maintained in the output feature class (known as a left outer join) or only those that have the specified relationships with the join features (inner join). This option is only available when the
join_operationparameter is JoinOneToOne`.False(inner join) is the default.Note
This parameter is available at ArcGIS Enterprise 10.9 and later.
- return
Output Features as
FeatureLayerCollection
# Usage Example: To find power outages in your state that may have been caused by a lightning strike.

output = join_features(target_layer=outages_layer,
                       join_layer=lightning,
                       join_operation="JoinOneToMany",
                       spatial_relationship="Near",
                       spatial_near_distance=20,
                       spatial_near_distance_unit="Miles",
                       temporal_relationship="NearAfter",
                       temporal_near_distance=30,
                       temporal_near_distance_unit="Minutes",
                       output_name="LightningOutages")
reconstruct_tracks
-
arcgis.geoanalytics.summarize_data.reconstruct_tracks(input_layer, track_fields, method='Planar', buffer_field=None, summary_fields=None, distance_split=None, distance_split_unit=None, time_boundary_split=None, time_boundary_split_unit=None, time_boundary_reference=None, output_name=None, gis=None, time_split=None, time_split_unit=None, context=None, future=False, arcade_split=None, split_boundary=None)¶ 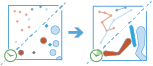
The
reconstruct_trackstask works with a time-enabled layer of either point or polygon features that represents an instant in time. It first determines which features belong to a track using an identifier. Using the time at each location, the tracks are ordered sequentially and transformed into a line or polygon representing the path of movement over time. Optionally, the input can be buffered by a field, which will create a polygon at each location. These buffered points, or polygons if the inputs are polygons, are then joined sequentially to create a track as a polygon where the width is representative of the attribute of interest. Resulting tracks have start and end times that represent the time at the first and last feature in a given track. When the tracks are created, statistics about the input features are calculated and assigned to the output track. The most basic statistic is the count of points within the area, but other statistics can be calculated as well. Features in time-enabled layers can be represented in one of two ways:Instant - A single moment in time
Interval - A start and end time
For example, suppose you have GPS measurements of hurricanes every 10 minutes. Each GPS measurement records the hurricane name, location, time of recording, and the wind speed. You could create tracks of the hurricanes using the name of the hurricane as the track identification, and all hurricanes’ tracks would be generated. You could calculate statistics such as the mean, maximum, and minimum wind speed of each hurricane, as well as the count of measurements in each track.
Parameter
Description
input_layer
Required layer. The point or polygon features from which tracks will be constructed. See Feature Input.
track_fields
Required string. The fields used to identify distinct tracks. There can be multiple
track_fields.method
Optional string. The method used to apply reconstruct tracks and, optionally, to apply the buffer. There are two methods to choose from:
Planar- This method joins points using a plane method and will not cross the international date line. For buffers, this method applies a Euclidean buffer and is appropriate for local analysis on projected data. This is the default.Geodesic- This method joins points geodesically and will allow tracks to cross the international date line. For buffers, this method is appropriate for large areas and any geographic coordinate system.
The default value is ‘Planar’.
buffer_field
Optional string. A field in the
input_layerthat contains a buffer distance or a buffer expression.summary_fields
Optional list of dicts. A list of field names and statistical summary types you want to calculate.
Note
countis always returned. By default, all statistics are returned.Syntax:
[{"statisticType" : "<statistic type>", "onStatisticField" : "<field name>" }, ...]onStatisticFieldis the name of the field in the target layer.statisticTypeis one of the following:for numeric fields:
Count- Totals the number of values of all the points in each polygon.Sum- Adds the total value of all the points in each polygon.Mean- Calculates the average of all the points in each polygon.Min- Finds the smallest value of all the points in each polygon.Max- Finds the largest value of all the points in each polygon.Range- Finds the difference between the Min and Max values.Stddev- Finds the standard deviation of all the points in each polygon.Var- Finds the variance of all the points in each polygon.First- Returns the first value of a specified field in the summarized track. This parameters was introduced at ArcGIS Enterprise 10.8.1.Last- Returns the last value of a specified field in the summarized track. This parameters was introduced at ArcGIS Enterprise 10.8.1.
for string fields:
Count- Totals the number of strings for all the points in each polygon.Any- Returns a sample string of a point in each polygon.e of all the points in each polygon.First- Returns the first value of a specified field in the summarized track. This parameters was introduced at ArcGIS Enterprise 10.8.1.Last- Returns the last value of a specified field in the summarized track. This parameters was introduced at ArcGIS Enterprise 10.8.1.
time_boundary_split
Optional integer. A time boundary allows your to analyze values within a defined time span. For example, if you use a time boundary of 1 day, starting on January 1st, 1980 tracks will be analyzed 1 day at a time. The time boundary parameter was introduced in ArcGIS Enterprise 10.7.
The
time_boundary_splitparameter defines the scale of the time boundary. In the case above, this would be 1.time_boundary_split_unit (Required if
time_boundary_splitis specified)Optional string. The unit applied to the time boundary. Required if a
time_boundary_splitis provided.Choice list:
YearsMonthsWeeksDaysHoursMinutesSecondsMilliseconds
time_boundary_reference
Optional datetime.datetime. A date that specifies the reference time to align the time boundary to, represented in milliseconds from epoch. This option is only available if the
time_boundary_splitandtime_boundary_split_unitare set.distance_split
Optional float. A distance used to split tracks. Any features in the
input_layerthat are in the same track and are greater than this distance apart will be split into a new track. The units of the distance values are supplied by thedistance_split_unitparameter.If both
distance_splitandtime_splitare used, the track is split when at least one condition is met.distance_split_unit (Required if
distance_splitis specified)Optional string. The distance unit to be used with the distance value specified in
distance_split.Choice list:
MetersKilometersFeetMilesNauticalMilesYards
output_name
Optional string. The task will create a feature service of the results. You define the name of the service.
gis
Optional, the
GISon which this tool runs. If not specified, the active GIS is used.time_split
Optional integer. A time duration used to split tracks. Any features in the
input_layerthat are in the same track and are greater than this time apart will be split into a new track. The units of the distance values are supplied by thetime_splitparameter.If both
distance_splitandtime_splitare used, a track is split when at least one condition is met.time_split_unit (Required if
time_splitis specified)Optional string. The temporal unit to be used with the temporal distance value specified in
time_split.Choice list:
YearsMonthsWeeksDaysHoursMinutesSecondsMilliseconds
context
Optional dict. The context parameter contains additional settings that affect task execution. For this task, there are four settings:
extent- A bounding box that defines the analysis area. Only those features that intersect the bounding box will be analyzed.processSR- The features will be projected into this coordinate system for analysis.outSR- The features will be projected into this coordinate system after the analysis to be saved. The output spatial reference for the spatiotemporal big data store is always WGS84.dataStore- Results will be saved to the specified data store. For ArcGIS Enterprise, the default is the spatiotemporal big data store.
future
Optional boolean. If
True, a GPJob is returned instead of results. The GPJob can be queried on the status of the execution.The default value is
False.arcade_split
Optional String. An expression that splits tracks based on values, geometry, or time values. Expressions that validate to true will be split. This parameter is only available with ArcGIS Enterprise 10.9 and later. The default is None.
split_boundary
Optional String.
Specifies how the track segment between two features is created when a track is split. The split type is applied to split expressions, distance splits, and time splits. This parameter is only available with ArcGIS Enterprise 10.9 and later.
Gap - No segment is created between the two features. This is the default when None is specified.
FinishLast - A segment is created between the two features that ends after the split.
StartNext - A segment is created between the two features that ends before the split.
The default is None.
- Returns
# Usage Example: To reconstruct hurricane tracks.

tracks = reconstruct_tracks(input_layer=hurricane_lyr,
                            track_fields='season, trackID',
                            method='Geodesic',
                            buffer_field='size',
                            summary_fields=[{"statisticType" : "Range", "onStatisticField" : "Wind" }],
                            distance_split=1,
                            distance_split_unit='Kilometers',
                            time_boundary_split=1,
                            time_boundary_split_unit='Days',
                            output_name='reconstruct hurricane tracks')
summarize_attributes
-
arcgis.geoanalytics.summarize_data.summarize_attributes(input_layer, fields=None, summary_fields=None, output_name=None, gis=None, context=None, future=False, time_step_interval=None, time_step_interval_unit=None, time_step_repeat_interval=None, time_step_repeat_interval_unit=None, time_step_reference=None)¶ 
Parameter
Description
input_layer
Required layer. The features that will be summarized. See Feature Input.
fields
Optional string. The fields that will be used to summarize like features. For example, if you chose a field called property type with the values of commercial and residential, all of the features with property type residential would be summarized together with summary statistics calculated and all of the commercial features would be summarized together.
summary_fields
Optional list of dicts. A list of field names and statistical summary types you want to calculate for features that are summarized together. Note that the count of features with the same fields values is always returned. By default, all statistics are returned.
Syntax:
[{"statisticType" : "<statistic type>", "onStatisticField" : "<field name>" }]onStatisticFieldis the name of the field in the input point layerstatisticTypeis one of the following:for numeric fields:
Count- Totals the number of values of all the points in each polygon.Sum- Adds the total value of all the points in each polygon.Mean- Calculates the average of all the points in each polygon.Min- Finds the smallest value of all the points in each polygon.Max- Finds the largest value of all the points in each polygon.Range- Finds the difference between the Min and Max values.Stddev- Finds the standard deviation of all the points in each polygon.Var- Finds the variance of all the points in each polygon.
for string fields:
Count - Totals the number of strings for all the points in each polygon.
Any - Returns a sample string of a point in each polygon.
output_name
Optional string. The task will create a feature service of the results. You define the name of the service.
gis
Optional
GIS. The GIS on which this tool runs. If not specified, the active GIS is used.context
Optional dict. Context contains additional settings that affect task execution. For this task, there is one setting:
extent- A bounding box that defines the analysis area. Only those features that intersect the bounding box will be analyzed.dataStore- Results will be saved to the specified data store. For ArcGIS Enterprise, the default is the spatiotemporal big data store.
future
Optional boolean. If
True, a GPJob is returned instead of results. The GPJob can be queried on the status of the execution.The default value is
False.time_step_interval
Optional integer. A numeric value that specifies duration of the time step interval. This option is only available if the input points are time-enabled and represent an instant in time.
The default value is
None.time_step_interval_unit
Optional string. A string that specifies units of the time step interval. This option is only available if the input points are time-enabled and represent an instant in time.
Choice list:
YearsMonthsWeeksDaysHoursMinutesSecondsMilliseconds
The default value is
None.time_step_repeat_interval
Optional integer. A numeric value that specifies how often the time step repeat occurs. This option is only available if the input points are time-enabled and of time type instant.
time_step_repeat_interval_unit
Optional string. A string that specifies the temporal unit of the step repeat. This option is only available if the input points are time-enabled and of time type instant.
Choice list:
YearsMonthsWeeksDaysHoursMinutesSeconds``Milliseconds`
The default value is
None.time_step_reference
Optional datetime. A date that specifies the reference time to align the time slices to, represented in milliseconds from epoch. The default is January 1, 1970, at 12:00 a.m. (epoch time stamp 0). This option is only available if the input points are time-enabled and of time type instant.
- Returns
# Usage Example: To summarize similar types of storms to find the sum of property damage.

summarized_result = summarize_attributes(input_layer=storms,
                                         fields="Storm_type",
                                         summary_fields=[{"statisticType" : "Sum", "onStatisticField" : "PropertyDamage"}],
                                         output_name="summarized_storms")
summarize_within
-
arcgis.geoanalytics.summarize_data.summarize_within(summarized_layer, summary_polygons=None, bin_type=None, bin_size=None, bin_size_unit=None, standard_summary_fields=None, weighted_summary_fields=None, sum_shape=True, shape_units=None, group_by_field=None, minority_majority=False, percent_shape=False, output_name=None, gis=None, context=None, future=False)¶ 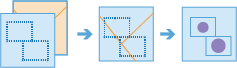
The
summarize_withintask finds features (and portions of features) that are within the boundaries of areas in the first input layer. The following are examples:Given a layer of watershed boundaries and a layer of land-use boundaries, calculate the total acreage of land-use type for each watershed.
Given a layer of parcels in a county and a layer of city boundaries, summarize the average value of vacant parcels within each city boundary.
Given a layer of counties and a layer of roads, summarize the total mileage of roads by road type within each county.
You can think of
summarize_withinas taking two layers and stacking them on top of each other. One of the layers,summary_polygons, must be a polygon layer, and imagine that these polygon boundaries are all colored red. The other layer,summarized_layer, can be any feature type—point, line, or polygon. After stacking these layers on top of each other, you peer down through the stack and count the number of features insummarized_layerthat fall within the polygons with the red boundaries (summary_polygons). Not only can you count the number of features, you can calculate simple statistics about the attributes of the features insummarized_layer, such as sum, mean, minimum, maximum, and so on.Note
Either
summary_polygonsorbin_typemust be specified.Parameter
Description
summarized_layer
Required layer. Point, line, or polygon features that will be summarized for each polygon in
summary_polygonsor bins. See Feature Input.summary_polygons
Optional layer. The polygon features. Features, or portions of features, in
summarized_layerthat fall within the boundaries of these polygons will be summarized. You can choose to summarize within a polygon layer that you provide or within square or hexagon bins that are generated when the tool runs. See Feature Input.bin_type (Required if
summary_polygonsis not specified)Optional string. The type of bin that will be generated and
summarized_layerwill be summarized into.Choice list:
HexagonSquare
Note
If
bin_typeis chosen,bin_sizeandbin_size_unitare required.Note
Analysis using
SquareorHexagonbins requires a projected coordinate system. When aggregating layers into bins, the input layer or processing extent (processSR) must have a projected coordinate system. If a projected coordinate system is not specified:At 10.5.1, 10.6, and 10.6.1, the World Cylindrical Equal Area (WKID 54034) projection will be used.
At 10.7 or later, a projection will be picked based on the extent of the data.
bin_size (Required if
bin_typeis specified)Optional float. The distance for the bins of type
bin_type. When generating bins, for Square, the number and units specified determine the height and length of the square, and for Hexagon, the number and units specified determine the distance between parallel sides.bin_size_unit (Required if
bin_sizeis specified)Optional string. The linear distance unit for the bins that
summarized_layerwill be summarized into.Choice list:
FeetYardsMilesMetersKilometersNauticalMiles
standard_summary_fields
Optional list of dicts. A list of field names and statistical summary type that you want to calculate for all features in
summarized_layerthat are within each polygon insummary_polygonsorbin_typebins. The standard statistics are calculated using the whole attribute values from any feature that is withinsummary_polygons.Syntax:
[{"statisticType" : "<statistic type>", "onStatisticField" : "<field name>" }]onStatisticFieldis the name of the field in the input point layer.statisticTypeis one of the followingfor numeric fields:
Count- Totals the number of features in each polygon.Sum- Adds the total value of all the features in each polygon.Mean- Calculates the average of all the features in each polygon.Min- Finds the smallest value of all the features in each polygon.Max- Finds the largest value of all the features in each polygon.Range- Finds the difference between Min and Max.Stddev- Finds the standard deviation of all the features in each polygon.Var- Finds the variance of all the features in each polygon.
for string fields:
Count- Totals the number of strings for all the features in each polygon.Any- Returns a sample string of a feature in each polygon.
weighted_summary_fields
Optional list of dicts. A list of field names and statistical summary type that you want to calculate for all features in
summarized_layerthat are within each polygon insummary_polygonsorbin_typebins. The weighted statistics are calculated using the geographically weighted attribute values from features that are withinsummary_polygons. Resulting fields from proportional statistics will be denoted with ap. Weighted statistics can only be applied to asummarized_layerwith either line or polygon geometry.Syntax:
[{"statisticType" : "<statistic type>", "onStatisticField" : "<field name>" }]onStatisticFieldis the name of the field in the input point layer.statisticTypeis one of the following:for numeric fields:
Count- The count of each field multiplied by the proportion of the summarized layer within the polygons.Sum- The sum of weighted of values in each field. Where the weight applied is the proportion of the summarized layer within the polygons.Mean- The weighted mean of values in each field. Where the weight applied is the proportion of the summarized layer within the polygons.Min- The minimum of weighted values in each field. Where the weight applied is the proportion of the summarized layer within the polygons.Max- The maximum of weighted values in each field. Where the weight applied is the proportion of the summarized layer within the polygons.Range- Finds the difference between Min and Max.Stddev- The standard deviation of weighted values in each field. Where the weight applied is the proportion of the summarized layer within the polygons. (Added 10.9.1)Var- The variance of weighted values in each field. Where the weight applied is the proportion of the summarized layer within the polygons. (Added 10.9.1)
sum_shape
Optional boolean. A boolean value that instructs the task to calculate statistics based on the shape type of
summarized_layer, such as the length of lines or areas of polygons ofsummarized_layerwithin each polygon insummary_polygons.The default value is
True.shape_units
Optional string. The units used to calculate
sum_shape.Values:
When
summarized_layercontains polygons, Choice list: [‘Acres’, ‘Hectares’, ‘SquareMeters’, ‘SquareKilometers’, ‘SquareMiles’, ‘SquareYards’, ‘SquareFeet’].When
summarized_layercontains lines, Choice list: [‘Meters’, ‘Kilometers’, ‘Feet’, ‘Yards’, ‘Miles’]
group_by_field
Optional string. This is a field of the
summarized_layerfeatures that you can use to calculate statistics separately for each unique attribute value. For example, suppose thesummarized_layerdepicts city boundaries and thesummary_polgyonsfeatures are parcels. ` The parcels layer has a Status attribute whose value is either VACANT or OCCUPIED`. To calculate the total area of vacant and occupied parcels within the boundaries of cities, use Status as thegroup_by_fieldfield argument.Note
This parameter is available at ArcGIS Enterprise 10.6.1 and later.
When a
group_by_fieldfield is provided, the service returns a table containing the statistics in thegroupBySummaryoutputparameter.minority_majority
Optioal boolean. This boolean parameter is applicable only when a
group_by_fieldis specified. If true, the minority (least dominant) or the majority (most dominant) attribute values for each group field are calculated. Two new fields are added to theresult_layerprefixed with Majority_ and Minority_.Note
This parameter is available at ArcGIS Enterprise 10.6.1 and later.
The default value is ‘False’.
percent_shape
Optioal boolean. This boolean parameter is applicable only when a
group_by_fieldis specified. If set to true, the percentage of each uniquegroup_by_fieldvalue is calculated for each sum within layer polygon. The default is false.Note
This parameter is available at ArcGIS Enterprise 10.6.1 and later.
The default value is
False.output_name
Optional string. The task will create a feature service of the results. You define the name of the service.
context
Optional dict. The context parameter contains additional settings that affect task execution. For this task, there are four settings:
extent- A bounding box that defines the analysis area. Only those features that intersect the bounding box will be analyzed.processSR- The features will be projected into this coordinate system for analysis.outSR- The features will be projected into this coordinate system after the analysis to be saved. The output spatial reference for the spatiotemporal big data store is always WGS84.dataStore- Results will be saved to the specified data store. For ArcGIS Enterprise, the default is the spatiotemporal big data store.
gis
Optional
GIS. The GIS on which this tool runs. If not specified, the active GIS is used.future
Optional boolean. If
True, a future object will be returned and the process will not wait for the task to complete. The default isFalse, which means wait for results.- Returns
# Usage Example: To calculate the distance and average slope of bike lanes within each city district.

summarize_within_result = summarize_within(summary_polygons=districts,
                                           summarized_layer=bike_lanes,
                                           weighted_summary_fields=[{"statisticType" : "Average","onStatisticField" : "Slope"}],
                                           output_name="summary_of_bike_lanes")
summarize_center_and_dispersion
-
arcgis.geoanalytics.summarize_data.summarize_center_and_dispersion(input_layer, summary_type, ellipse_size=None, weight_field=None, group_fields=None, output_name=None, gis=None, context=None, future=False)¶ The summarize_center_and_dispersion task finds central features and directional distributions. It can be used to answer questions such as the following:
Where is the center?
Which feature is the most accessible from all other features?
How dispersed, compact, or integrated are the features?
Are there directional trends?
For an example, suppose you have used the GeoAnalytics tool Find Point Clusters to identify groups of power outages across an entire year. The result will be time enabled point representing cluster locations of power outages. However, you are interested in identifying the center of the power outages for visualization. To do this, you use Summarize Center And Dispersion a group by field of the outage cluster ids.
Parameter
Description
input_layer
Required Layer. A layer that will be used in analysis. See Feature Input.
summary_type
Required String. The method with which to summarize the input_layer. Values: CentralFeature, MeanCenter, MedianCenter, or Ellipse.
ellipse_size
Optional Integer. The number representing the number of standard deviations represented in the output ellipse layer. The default ellipse size is 1. Valid choices are 1, 2, or 3 standard deviations. This option is only used if Ellipse is chosen from the summary_type parameter.
weight_field
Optional String. A numeric field in the input_layer to be used to weight locations according to their relative importance.
group_fields
Optional String. One or more fields used to group features for summarization. The group_fields can be of integer, date, or string type.
output_name
Optional string. The task will create a feature service of the results. You define the name of the service.
gis
Optional
GIS. The GIS object where the analysis will take place.context
Optional string. The context parameter contains additional settings that affect task execution. For this task, there are four settings:
extent- a bounding box that defines the analysis area. Only those features that intersect the bounding box will be analyzed.processSR- The features will be projected into this coordinate system for analysis.outSR- The features will be projected into this coordinate system after the analysis to be saved. The output spatial reference for the spatiotemporal big data store is always WGS84.dataStoreResults will be saved to the specified data store. For ArcGIS Enterprise, the default is the spatiotemporal big data store.
future
Optional boolean. If
True, a future object will be returned and the process will not wait for the task to complete. The default isFalse, which means wait for results.