Learn how to display point, line, and polygon graphics in a map.
You typically use graphics to display geographic data that is not connected to a database and that is not persisted, like highlighting a route between two locations, displaying a search buffer around a point, or tracking the location of a vehicle in real-time. Graphics are composed of a geometry, symbol, and attributes.
In this tutorial, you display points, lines, and polygons on a map as graphics.
Prerequisites
The following are required for this tutorial:
- An ArcGIS account to access your API keys. If you don't have an account, sign up for free.
- Your system meets the system requirements.
Steps
Open the Xcode project
-
To start the tutorial, complete the Display a map tutorial or download and unzip the solution.
-
Open the
.xcodeprojfile in Xcode. -
If you downloaded the solution project, set your API key.
An API Key enables access to services, web maps, and web scenes hosted in ArcGIS Online.
-
Go to your developer dashboard to get your API key. For these tutorials, use your default API key. It is scoped to include all of the services demonstrated in the tutorials.
- In Xcode, in the Project Navigator, click MainApp.swift.
- In the Editor, set the
ArcGISEnvironment.apiKeyproperty on theArcGISEnvironmentwith your API key.
MainApp.swiftUse dark colors for code blocks import SwiftUI import ArcGIS @main struct MainApp: App { init() { ArcGISEnvironment.apiKey = APIKey("<#your-API-key#>") } var body: some SwiftUI.Scene { WindowGroup { ContentView() .ignoresSafeArea() } } } -
Add a graphics overlay
A graphics overlay is a container for graphics. It is used with a map view to display graphics on a map. You can add more than one graphics overlay to a map view. Graphics overlays are displayed on top of all the other layers.
-
In Xcode, in the Project navigator, click ContentView.swift.
-
Create a class called
Modelthat adopts theObservableprotocol. Within that class, create aObject Graphicsas a default value. Initialize the property with an empty initializer and return it. You'll edit this method at a later step to add all of the graphics to display.Overlay ContentView.swiftUse dark colors for code blocks Add line. Add line. Add line. Add line. Add line. Add line. Add line. Add line. import SwiftUI import ArcGIS private class Model: ObservableObject { let graphicsOverlay: GraphicsOverlay = { let graphicsOverlay = GraphicsOverlay() return graphicsOverlay }() }The
Modelclass must conform to typeObservable. See theObject Observabledocumentation for more information.Object -
Create a
@Stateof typeObject Modelcalledgraphicsin theOverlay Model Content.View ContentView.swiftUse dark colors for code blocks Add line. struct ContentView: View { @State private var map: Map = { let map = Map(basemapStyle: .arcGISTopographic) map.initialViewpoint = Viewpoint(latitude: 34.02700, longitude: -118.80500, scale: 72_000) return map }() @StateObject private var graphicsOverlayModel = Model() } -
In the
body, update the map view initializer by adding thegraphicsparameter. Pass in theOverlays graphics'sOverlay Model graphicproperty to add the graphics overlay created in the previous steps to the map view's list of graphics overlays.Overlay ContentView.swiftUse dark colors for code blocks Change line struct ContentView: View { @State private var map: Map = { let map = Map(basemapStyle: .arcGISTopographic) map.initialViewpoint = Viewpoint(latitude: 34.02700, longitude: -118.80500, scale: 72_000) return map }() @StateObject private var graphicsOverlayModel = Model() var body: some View { MapView(map: map, graphicsOverlays: [graphicsOverlayModel.graphicsOverlay]) } }
Add a point graphic
A point graphic is created using a point and a marker symbol. A point is defined with x and y coordinates, and a spatial reference. For latitude and longitude coordinates, the spatial reference is WGS84.
-
Create a
Pointand aSimpleMarkerSymbol. To create thePoint, provide longitude (x) and latitude (y) coordinates, and aSpatialReference. Use theSpatialReference.wgs84convenience method. Create and style aSimpleMarkerSymbol.Point graphics support a number of symbol types such as
SimpleMarkerSymbol,PictureMarkerSymbolandTextSymbol. Learn more about theSymbolclass in the API documentation.Use dark colors for code blocks Add line. Add line. Add line. Add line. private class Model: ObservableObject { let graphicsOverlay: GraphicsOverlay = { let graphicsOverlay = GraphicsOverlay() let point = Point(x: -118.80657, y: 34.00059, spatialReference: .wgs84) let pointSymbol = SimpleMarkerSymbol(style: .circle, color: .orange, size: 10.0) pointSymbol.outline = SimpleLineSymbol(style: .solid, color: .blue, width: 2.0) return graphicsOverlay }() } -
Create a
Graphicwith thepointandpoint. Display theSymbol Graphicby adding it to thegraphicsusing theOverlay GraphicsOverlay.addGraphic()method.Use dark colors for code blocks Add line. Add line. Add line. let point = Point(x: -118.80657, y: 34.00059, spatialReference: .wgs84) let pointSymbol = SimpleMarkerSymbol(style: .circle, color: .orange, size: 10.0) pointSymbol.outline = SimpleLineSymbol(style: .solid, color: .blue, width: 2.0) let pointGraphic = Graphic(geometry: point, symbol: pointSymbol) graphicsOverlay.addGraphic(pointGraphic) -
Press Command + R to run the app.
If you are using the Xcode simulator your system must meet these minimum requirements: macOS Monterey 12.5, Xcode 15, iOS 17. If you are using a physical device, then refer to the system requirements.
You should see a point graphic in Point Dume State Beach.
Add a line graphic
A line graphic is created using a polyline and a line symbol. A polyline is defined as a sequence of points.
Polylines have one or more distinct parts. Each part is a sequence of points. For a continuous line, you can use the Polyline constructor to create a polyline with just one part. To create a polyline with more than one part, use a Polyline.
-
Create a
Polylineand aSimpleLineSymbol. To create thePolyline, provide an array ofPointobjects. Create and style aSimpleLineSymbol.Line graphics support a number of symbol types such as
SimpleLineSymbolandTextSymbol. Learn more about theSymbolclass in the API documentation.Use dark colors for code blocks Add line. Add line. Add line. Add line. Add line. Add line. Add line. Add line. Add line. graphicsOverlay.addGraphic(pointGraphic) let polyline = Polyline( points: [ Point(x: -118.82152, y: 34.01395, spatialReference: .wgs84), Point(x: -118.81489, y: 34.00806, spatialReference: .wgs84), Point(x: -118.80887, y: 34.00166, spatialReference: .wgs84) ] ) let polylineSymbol = SimpleLineSymbol(style: .solid, color: .blue, width: 3.0) -
Create a
Graphicwith thepolylineandpolyline. Display theSymbol Graphicby adding it to thegraphicsusing theOverlay GraphicsOverlay.addGraphic()method.Use dark colors for code blocks Add line. Add line. Add line. let polyline = Polyline( points: [ Point(x: -118.82152, y: 34.01395, spatialReference: .wgs84), Point(x: -118.81489, y: 34.00806, spatialReference: .wgs84), Point(x: -118.80887, y: 34.00166, spatialReference: .wgs84) ] ) let polylineSymbol = SimpleLineSymbol(style: .solid, color: .blue, width: 3.0) let polylineGraphic = Graphic(geometry: polyline, symbol: polylineSymbol) graphicsOverlay.addGraphic(polylineGraphic) -
Press Command + R to run the app.
If you are using the Xcode simulator your system must meet these minimum requirements: macOS Monterey 12.5, Xcode 15, iOS 17. If you are using a physical device, then refer to the system requirements.
You should see a point and line graphic along Westward Beach.
Add a polygon graphic
A polygon graphic is created using a polygon and a fill symbol. A polygon is defined as a sequence of points that describe a closed boundary.
Polygons have one or more distinct parts. Each part is a sequence of points describing a closed boundary. For a single area with no holes, you can use the Polygon constructor to create a polygon with just one part. To create a polygon with more than one part, use a PolygonBuilder.
-
Create a
Polygonand aSimpleFillSymbol. To create thePolygon, provide an array ofPointobjects. Create and style aSimpleFillSymbol.Polygon graphics support a number of symbol types such as
SimpleFillSymbol,PictureFillSymbol,SimpleMarkerSymbolandTextSymbol. Learn more about theSymbolclass in the API documentation.Use dark colors for code blocks Add line. Add line. Add line. Add line. Add line. Add line. Add line. Add line. Add line. Add line. Add line. graphicsOverlay.addGraphic(polylineGraphic) let polygon = Polygon( points: [ Point(x: -118.81898, y: 34.01375, spatialReference: .wgs84), Point(x: -118.80679, y: 34.02158, spatialReference: .wgs84), Point(x: -118.79143, y: 34.01638, spatialReference: .wgs84), Point(x: -118.79596, y: 34.00856, spatialReference: .wgs84), Point(x: -118.80855, y: 34.00350, spatialReference: .wgs84) ] ) let polygonSymbol = SimpleFillSymbol(style: .solid, color: .orange, outline: SimpleLineSymbol(style: .solid, color: .blue, width: 2.0)) return graphicsOverlay -
Create a
Graphicwith thepolygonandpolygon. Display theSymbol Graphicby adding it to thegraphics'sOverlay GraphicsOverlay.graphicscollection.Use dark colors for code blocks Add line. Add line. graphicsOverlay.addGraphic(polylineGraphic) let polygon = Polygon( points: [ Point(x: -118.81898, y: 34.01375, spatialReference: .wgs84), Point(x: -118.80679, y: 34.02158, spatialReference: .wgs84), Point(x: -118.79143, y: 34.01638, spatialReference: .wgs84), Point(x: -118.79596, y: 34.00856, spatialReference: .wgs84), Point(x: -118.80855, y: 34.00350, spatialReference: .wgs84) ] ) let polygonSymbol = SimpleFillSymbol(style: .solid, color: .orange, outline: SimpleLineSymbol(style: .solid, color: .blue, width: 2.0)) let polygonGraphic = Graphic(geometry: polygon, symbol: polygonSymbol) graphicsOverlay.addGraphic(polygonGraphic) return graphicsOverlay -
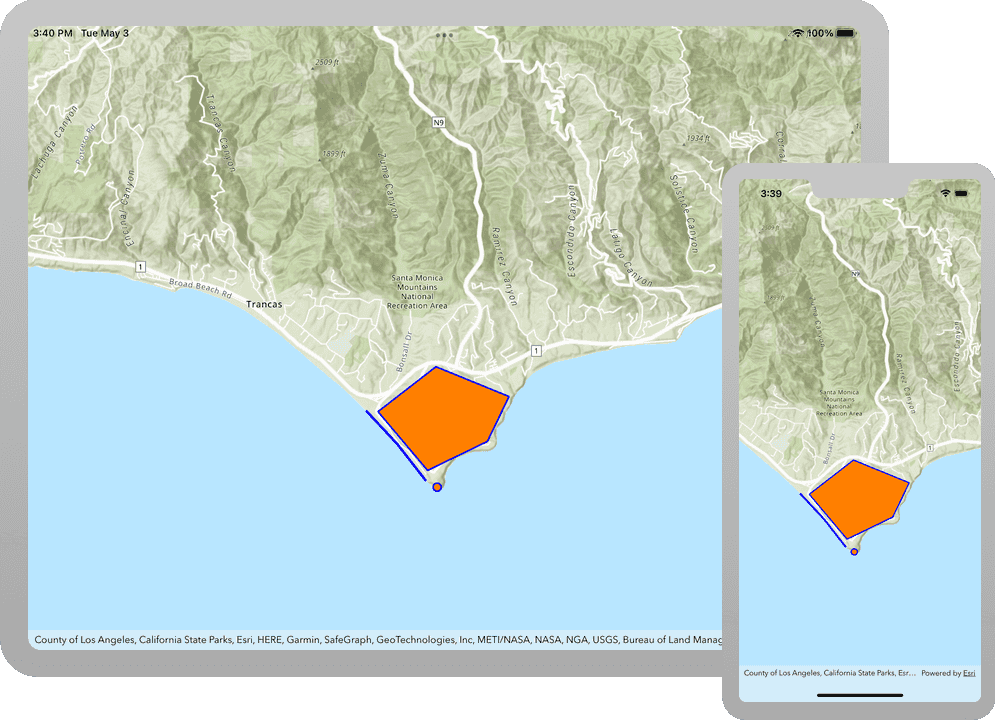
Press Command + R to run the app.
If you are using the Xcode simulator your system must meet these minimum requirements: macOS Monterey 12.5, Xcode 15, iOS 17. If you are using a physical device, then refer to the system requirements.
You should see a point, line, and polygon graphic around Mahou Riviera in the Santa Monica Mountains.
What's next?
Learn how to use additional API features, ArcGIS location services, and ArcGIS tools in these tutorials: