Learn how to use Charts Components and Map Components using Vite developer build tools.
In this tutorial, you will:
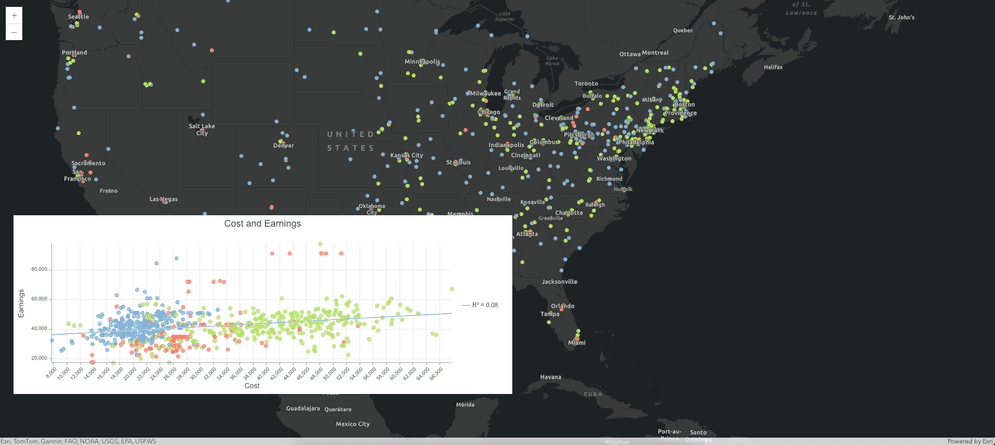
- Render a webmap with Map Components and a chart (scatterplot) with Charts Components.
- Add an event listener to show selected features on both the chart and the map.
Prerequisites
- The most recent LTS Node.js runtime environment.
- A text editor to edit files.
- A terminal to enter commands.
Steps
Create a new project using Vite
- Download the initial Vite vanilla Javascript project to your local machine.
- Unzip the downloaded file.
- Open the unzipped folder's files in your text editor.
- Navigate to the unzipped folder in your terminal.
Install dependencies
-
Install Charts Components and Map Components in the terminal as dependencies.
Use dark colors for code blocks Copy npm install @arcgis/charts-components @arcgis/map-components -
Later in this tutorial we will need to know which version of
@esri/calcite-componentswas installed as a dependency of@arcgis/map-components, run this command in the terminal window to find the correct version.Use dark colors for code blocks Copy npm list @esri/calcite-components -
Start the Vite development server.
Use dark colors for code blocks Copy npm run dev -
Open a web browser and navigate to
http:. Initially, this web page will be empty, but it will update as we proceed through the remaining steps.//localhost: 5173 -
Import functions to define the custom HTML elements from the Charts Components, Map Components and Calcite Components libraries in
main.js. You will need to use an alias, because the imported function from each library has the same name,define.Custom Elements Use dark colors for code blocks Copy import { defineCustomElements as defineCalciteElements } from '@esri/calcite-components/dist/loader'; import { defineCustomElements as defineChartsElements } from '@arcgis/charts-components/dist/loader'; import { defineCustomElements as defineMapElements } from '@arcgis/map-components/dist/loader'; -
Define the custom elements on the window using the Calcite Components distribution build. You will use CDN-hosted assets. When using the CDN-hosted assets, you need to keep the version number in the path the same as the version of
@esri/calcite-componentsfound in step two.Use dark colors for code blocks Copy defineCalciteElements(window, { resourcesUrl: 'https://js.arcgis.com/calcite-components/2.5.1/assets' }); -
Next, use the Charts Components and Map Components distribution build to define and lazy load the custom charts elements.
Use dark colors for code blocks Copy defineMapElements(window, { resourcesUrl: 'https://js.arcgis.com/map-components/4.29/assets' }); defineChartsElements(window, { resourcesUrl: 'https://js.arcgis.com/charts-components/4.29/t9n' });
Add styles
-
In
style.css, import the @arcgis/core light theme.Use dark colors for code blocks Copy @import 'https://js.arcgis.com/4.29/@arcgis/core/assets/esri/themes/light/main.css'; -
Add CSS styles to the scatterplot in
style.css. This will position the chart component directly on top of the map component.Use dark colors for code blocks Copy html, body { padding: 0; margin: 0; height: 100%; width: 100%; } #scatterplot { position: absolute; bottom: 100px; left: 30px; height: 40%; width: 50%; } -
Import the CSS file in
main.js.Use dark colors for code blocks Copy import './style.css';
Add components
-
Add the
arcgis-mapcomponent to index.html under<body>.Use dark colors for code blocks Copy <arcgis-map item-id="a72bb6468f57491f84409186446808e1"></arcgis-map> -
Add the
arcgis-charts-scatter-plotcomponent to index.html under<body>.Use dark colors for code blocks Copy <arcgis-charts-scatter-plot id="scatterplot"></arcgis-charts-scatter-plot>
Load the feature layer item
-
In
main.jsusedocument.queryto reference theSelector() arcgis-mapcomponent and then add an event listener for thearcgis-mapcomponent'sarcgisevent.View Ready Change Use dark colors for code blocks Copy document.querySelector('arcgis-map').addEventListener('arcgisViewReadyChange', (event) => { // to be implemented }); -
Inside the event listener, get the map and view from the event target.
Use dark colors for code blocks Copy const { map, view } = event.target; -
Get the "CollegeScorecard_Charts" layer from the map and the first chart's config from the layer.
Use dark colors for code blocks Copy const featureLayer = map.layers.find((layer) => layer.title === 'CollegeScorecard_Charts'); const scatterplotConfig = featureLayer.charts[0]; -
Use
document.getto refer theElement By Id() arcgis-charts-scatter-plotcomponent.Use dark colors for code blocks Copy const scatterplotElement = document.querySelector('arcgis-charts-scatter-plot'); -
Assign the layer and set config to the scatterplot element.
Use dark colors for code blocks Copy scatterplotElement.config = scatterplotConfig; scatterplotElement.layer = featureLayer; -
Next, implement the selection feature on the map and the scatterplot within the map element event listener. Then retrieve the layer views.
Use dark colors for code blocks Copy const featureLayerViews = view.layerViews; -
Lastly, add an event listener to the scatterplot element. When the
arcgisevent is fired, remove the previous selection and highlight the selected features on the map.Charts Selection Complete Use dark colors for code blocks Copy scatterplotElement.addEventListener('arcgisChartsSelectionComplete', (event) => { map.highlightSelect?.remove(); map.highlightSelect = featureLayerViews.items[0].highlight(event.detail.selectionOIDs); });
Run the application
The app should display the scatterplot on top of the map. When you select some features on the chart, the corresponding features should also be selected on the map.