About Jupyter Notebooks
The ArcGIS API for Python can be used from any application that can execute Python code. You can use the API from any of your favorite IDEs such as PyCharm, MS Visual Studio, Eclipse, Spyder, Rodeo, IDLE etc.
Jupyter Notebook is a web based IDE that is great for not only beginners but also seasoned programmers and scientists. This IDE is installed by default when you install the Python API. It allows you to type Python code, execute them and evaluate the results in a step-by-step interactive manner. Jupyter Notebooks can display not just Python code and its output, but also MarkDown, making them an excellent medium to document your workflows, scientific methods and share instructional material. Refer to this blog post to find how GIS professionals can make use of Jupyter notebooks.
Your first notebook
This section provides a quick introduction to the Jupyter Notebook environment where you can run Python code in an interactive manner and visualize the output as maps and charts. This section will help you get comfortable with using the notebook environment. Refer to the official Jupyter documentation and this quick start guide if you are looking for specific or advanced information.
Starting the Jupyter Notebook environment
Once conda and the ArcGIS API for Python is installed, you can start the Jupyter Notebook environment by typing the following command in your terminal.
jupyter notebook
If you are running a Windows OS, this could be your command prompt or PowerShell window. Similarly if you are running a Mac or Linux OS, this could be your terminal. Below is a screen shot of how it would appear if you were running the command from Windows command prompt.

**Note**: You should leaving the terminal running for as long as you are using the notebook. Closing the terminal while using the notebook will make your notebooks lose connection with the Python shell.
**Note**: If you installed the ArcGIS API for Python in a conda environment other than the default `root`, you need to activate that environment before starting the Jupyter Notebook. For more information on the benefits of using environments and how to create and manage them, refer to this [help page](http://conda.pydata.org/docs/using/envs.html).
If you are running a sample notebook for the API, you need to 'cd' into the directory where you downloaded the samples. In the example above, the samples have been downloaded and extracted into c:\code directory.
The command starts Jupyter Notebook and opens it in your default web browser as shown below.

The page you see in this image is called the Notebook Dashboard. Click and pull down the 'New' button from top right corner to create a new notebook, then type in the following sections.
Getting started with the API
The first step is to import the ArcGIS API for Python in your notebook
from arcgis.gis import GISYou can 'run' or 'execute' a cell by clicking on the 'run cell' button from the toolbar. Alternately, you can hit Shift + Enter in your keyboard. When a cell is executing the cell number turns to an asterisk (*) and the circle next to the kernal name turns solid.
To get started, create an anonymous connection to ArcGIS Online as shown below:
gis = GIS()You can search for content as shown below. Since you are connected to ArcGIS Online and as an anonymous user, the query shown below will return public content that is shared on ArcGIS Online
public_content = gis.content.search("Fire", item_type="Feature Layer", max_items=5)To see the contents of the variable public_content you created above, simply type it in a new cell and run it (by hitting Shift + Enter)
**Note**: Expect to see different results when you run this each time on your computer. The code above performs a new search each time you execute it and the search results may vary based on which layers are available publicly.
public_content[<Item title:"Natuurrampen" type:Feature Layer Collection owner:Esri_NL_Content>, <Item title:"Collier County Emergency Services" type:Feature Layer Collection owner:philsherman_collierbcc>, <Item title:"Intact Forest Landscapes (2000)" type:Feature Layer Collection owner:GlobalForestWatch>, <Item title:"Fire Perimeters" type:Feature Layer Collection owner:cferner_CALFIRE>, <Item title:"WRI_BeforeAndAfterPhotos" type:Feature Layer Collection owner:BuckEhler>]
The ArcGIS API for Python extends the Jupyter Notebook IDE to display ArcGIS Items in rich HTML notation. Thus, you can loop through each of the items in the search result and display it with thumbnails and metadata as shown below:
from IPython.display import display
for item in public_content:
    display(item)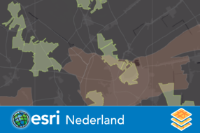


Display layers on a map
The ArcGIS API for Python adds a map widget to the Jupyter Notebook. This map widget can be used to display layers from any of the above public content items. Pick an example item:
example_item = public_content[0]
display(example_item)You can then easily pull up a map, as shown below. It may take a few seconds for the map to display the first time.
#Create a new map object
map1 = gis.map()
#Focus the map to the part of the world containing the example item
map1.extent = example_item.extent
#Display the map
map1
You can now add your example item to the map you just created.
map1.add_layer(example_item)Congratulations!
You have successfully created your first notebook. You can save it by clicking on the save button from the cell toolbar or by selecting it from the File menu. Refer to the guide on using the Jupyter notebook environment for more information and to the blog post five tips to get started with Jupyte Notebook for more tips and patterns to follow.