Learn how to display point, line, and polygon graphics in a map.
You typically use graphics to display geographic data that is not connected to a database and that is not persisted, like highlighting a route between two locations, displaying a search buffer around a point, or tracking the location of a vehicle in real-time. Graphics are composed of a geometry, symbol, and attributes.
In this tutorial, you display points, lines, and polygons on a map as graphics.
Prerequisites
The following are required for this tutorial:
- An ArcGIS account to access your API keys. If you don't have an account, sign up for free.
- Confirm that your system meets the minimum system requirements.
- An IDE for Java.
Steps
Open a Java project with Gradle
-
To start this tutorial, complete the Display a map tutorial, or download and unzip the Display a map solution into a new folder.
-
Open the build.gradle file as a project in IntelliJ IDEA.
-
If you downloaded the solution project, set your API key.
An API Key enables access to services, web maps, and web scenes hosted in ArcGIS Online.
-
Go to your developer dashboard to get your API key. For these tutorials, use your default API key. It is scoped to include all of the services demonstrated in the tutorials.
-
In IntelliJ IDEA's Project tool window, open src/main/java/com.example.app and double-click App.
-
In the
start()method, set the API key property on theArcGISRuntimeEnvironmentwith your API key. Replace YOUR_API_KEY with your actual API Key. Be sure to surround your API Key with quotes, because the parameter passed tosetis a string.A p i Key
App.javaUse dark colors for code blocks @Override public void start(Stage stage) { // set the title and size of the stage and show it stage.setTitle("Display a map tutorial"); stage.setWidth(800); stage.setHeight(700); stage.show(); // create a JavaFX scene with a stack pane as the root node, and add it to the scene StackPane stackPane = new StackPane(); Scene scene = new Scene(stackPane); stage.setScene(scene); // Note: it is not best practice to store API keys in source code. // The API key is referenced here for the convenience of this tutorial. String yourApiKey = "YOUR_API_KEY"; ArcGISRuntimeEnvironment.setApiKey(yourApiKey); -
Add import statements
Add import statements to reference the API classes.
-
In IntelliJ IDEA's Project tool window, open src/main/java/com.example.app and double-click App.
-
Add the following imports above the existing imports:
App.javaUse dark colors for code blocks Add line. Add line. Add line. Add line. Add line. Add line. Add line. Add line. Add line. Add line. import com.esri.arcgisruntime.geometry.Point; import com.esri.arcgisruntime.geometry.PointCollection; import com.esri.arcgisruntime.geometry.Polygon; import com.esri.arcgisruntime.geometry.Polyline; import com.esri.arcgisruntime.geometry.SpatialReferences; import com.esri.arcgisruntime.mapping.view.Graphic; import com.esri.arcgisruntime.mapping.view.GraphicsOverlay; import com.esri.arcgisruntime.symbology.SimpleFillSymbol; import com.esri.arcgisruntime.symbology.SimpleLineSymbol; import com.esri.arcgisruntime.symbology.SimpleMarkerSymbol; import com.esri.arcgisruntime.ArcGISRuntimeEnvironment; import com.esri.arcgisruntime.mapping.ArcGISMap; import com.esri.arcgisruntime.mapping.BasemapStyle; import com.esri.arcgisruntime.mapping.Viewpoint; import com.esri.arcgisruntime.mapping.view.MapView;
Add a graphics overlay
A graphics overlay is a container for graphics. It is used with a map view to display graphics on a map. You can add more than one graphics overlay to a map view. Graphics overlays are displayed on top of all the other layers.
-
In the
start()method, create a newGraphicsOverlayand add it to themap.View App.javaUse dark colors for code blocks Add line. Add line. Add line. // set the map on the map view mapView.setMap(map); mapView.setViewpoint(new Viewpoint(34.02700, -118.80543, 72223.819286)); // create a graphics overlay and add it to the map view GraphicsOverlay graphicsOverlay = new GraphicsOverlay(); mapView.getGraphicsOverlays().add(graphicsOverlay);
Add a point graphic
A point graphic is created using a point geometry and a marker symbol. A point is defined with x and y coordinates, and a spatial reference. For latitude and longitude coordinates, the spatial reference is WGS84.
-
Create a
Point,SimpleMarkerSymbol, andSimpleLineSymbol.-
To create the
Point, provide longitude and latitude coordinates, and aSpatialReference. Use theSpatialReferences.getWgs84()convenience getter. -
To create the
SimpleMarkerSymbol, provide the shape that makes up the symbol, the interior color of the symbol, and the size of the area to place the symbol in. -
To create the
SimpleLineSymbol, provide the pattern that makes up the area of the symbol, the interior color of the symbol, and the thickness of the symbol in density-independent pixels (i.e. dp). -
Set the outline of the
Simpleusing itsMarker Symbol setmethod and passing in theOutline() Simple.Line Symbol App.javaUse dark colors for code blocks Add line. Add line. Add line. Add line. Add line. Add line. Add line. Add line. Add line. Add line. // create a graphics overlay and add it to the map view GraphicsOverlay graphicsOverlay = new GraphicsOverlay(); mapView.getGraphicsOverlays().add(graphicsOverlay); // create a point geometry with a location and spatial reference Point point = new Point(-118.80657463861, 34.0005930608889, SpatialReferences.getWgs84()); // create an opaque orange point symbol with a opaque blue outline symbol SimpleMarkerSymbol simpleMarkerSymbol = new SimpleMarkerSymbol(SimpleMarkerSymbol.Style.CIRCLE, Color.ORANGE, 10); SimpleLineSymbol blueOutlineSymbol = new SimpleLineSymbol(SimpleLineSymbol.Style.SOLID, Color.BLUE, 2); simpleMarkerSymbol.setOutline(blueOutlineSymbol);
-
-
Create a
Graphicwith thepointandsimple. Display theMarker Symbol Graphicby adding it to thegraphics's graphics collection withOverlay GraphicsOverlay.getGraphics().Point graphics support a number of symbol types such as
SimpleMarkerSymbol,PictureMarkerSymbolandTextSymbol. Learn more about theSymbolclass in the API Reference documentation.App.javaUse dark colors for code blocks Add line. Add line. Add line. Add line. Add line. simpleMarkerSymbol.setOutline(blueOutlineSymbol); // create a graphic with the point geometry and symbol Graphic pointGraphic = new Graphic(point, simpleMarkerSymbol); // add the point graphic to the graphics overlay graphicsOverlay.getGraphics().add(pointGraphic); -
Run the app. Ensure to run the app as a Gradle task and not as an application in your IDE. In the Gradle tool window, under Tasks > application, double-click run.
You should see a point graphic in Point Dume State Beach.
Add a line graphic
A line graphic is created using a polyline geometry and a line symbol. A polyline is defined as a sequence of points.
Polylines have one or more distinct parts. Each part is a sequence of points. For a continuous line, you can use the Polyline constructor to create a polyline with just one part. To create a polyline with more than one part, use a PolylineBuilder.
-
Create a
PolylineandSimpleLineSymbol.-
To create the
Polyline, create a newPointCollection(com.esri.arcgisruntime.geometry.SpatialReference)with aSpatialReferenceand add newPointobjects to it. -
To create the
SimpleLineSymbol, provide the shape that makes up the symbol, the interior color of the symbol, and the size of the area to place the symbol in.
Polyline graphics support a number of symbol types such as
SimpleLineSymbolandTextSymbol. Learn more aboutSymbolin the API Reference documentation.App.javaUse dark colors for code blocks Add line. Add line. Add line. Add line. Add line. Add line. Add line. Add line. Add line. Add line. Add line. Add line. // add the point graphic to the graphics overlay graphicsOverlay.getGraphics().add(pointGraphic); // create a point collection with a spatial reference, and add three points to it PointCollection polylinePoints = new PointCollection(SpatialReferences.getWgs84()); polylinePoints.add(new Point(-118.821527826096, 34.0139576938577)); polylinePoints.add(new Point(-118.814893761649, 34.0080602407843)); polylinePoints.add(new Point(-118.808878330345, 34.0016642996246)); // create a polyline geometry from the point collection Polyline polyline = new Polyline(polylinePoints); // create an opaque blue line symbol for the polyline SimpleLineSymbol polylineSymbol = new SimpleLineSymbol(SimpleLineSymbol.Style.SOLID, Color.BLUE, 3); -
-
Create a
Graphicwith thepolylineandpolyline. Display theSymbol Graphicby adding it to thegraphics's graphics collection withOverlay GraphicsOverlay.getGraphics().App.javaUse dark colors for code blocks Add line. Add line. Add line. Add line. Add line. // create an opaque blue line symbol for the polyline SimpleLineSymbol polylineSymbol = new SimpleLineSymbol(SimpleLineSymbol.Style.SOLID, Color.BLUE, 3); // create a polyline graphic with the polyline geometry and symbol Graphic polylineGraphic = new Graphic(polyline, polylineSymbol); // add the polyline graphic to the graphics overlay graphicsOverlay.getGraphics().add(polylineGraphic); -
Run the app. Ensure to run the app as a Gradle task and not as an application in your IDE. In the Gradle tool window, under Tasks > application, double-click run.
You should see a point and a line graphic along Westward Beach.
Add a polygon graphic
A polygon graphic is created using a polygon geometry and a fill symbol. A polygon is defined as a sequence of points that describe a closed boundary.
Polygons have one or more distinct parts. Each part is a sequence of points describing a closed boundary. For a single area with no holes, you can use the Polygon constructor to create a polygon with just one part. To create a polygon with more than one part, use a PolygonBuilder.
-
Create a
PolygonandSimpleFillSymbol.-
To create the
Polygon, create a newPointCollection(com.esri.arcgisruntime.geometry.SpatialReference)with aSpatialReferenceand add newPointobjects to it. -
To create the
SimpleFillSymbol, provide the shape that makes up the symbol, the interior color of the symbol, and the size of the area to place the symbol in.
Polygon graphics support a number of symbol types such as
SimpleFillSymbol,PictureFillSymbol,SimpleMarkerSymbol, andTextSymbol. Learn more aboutSymbolin the API Reference documentation.App.javaUse dark colors for code blocks Add line. Add line. Add line. Add line. Add line. Add line. Add line. Add line. Add line. Add line. Add line. Add line. Add line. Add line. // add the polyline graphic to the graphics overlay graphicsOverlay.getGraphics().add(polylineGraphic); // create a point collection with a spatial reference, and add five points to it PointCollection polygonPoints = new PointCollection(SpatialReferences.getWgs84()); polygonPoints.add(new Point(-118.818984489994, 34.0137559967283)); polygonPoints.add(new Point(-118.806796597377, 34.0215816298725)); polygonPoints.add(new Point(-118.791432890735, 34.0163883241613)); polygonPoints.add(new Point(-118.795966865355, 34.0085648646355)); polygonPoints.add(new Point(-118.808558110679, 34.0035027131376)); // create a polygon geometry from the point collection Polygon polygon = new Polygon(polygonPoints); // create an orange-red fill symbol with 20% transparency and the opaque blue simple line symbol SimpleFillSymbol polygonFillSymbol = new SimpleFillSymbol(SimpleFillSymbol.Style.SOLID, Color.web("#FF4500", .8), blueOutlineSymbol); -
-
Create a
Graphicwith thepolygongeometry andpolygon. Display theSymbol Graphicby adding it to thegraphics's graphics collection withOverlay GraphicsOverlay.getGraphics().App.javaUse dark colors for code blocks Add line. Add line. Add line. Add line. // create an orange-red fill symbol with 20% transparency and the opaque blue simple line symbol SimpleFillSymbol polygonFillSymbol = new SimpleFillSymbol(SimpleFillSymbol.Style.SOLID, Color.web("#FF4500", .8), blueOutlineSymbol); // create a polygon graphic from the polygon geometry and symbol Graphic polygonGraphic = new Graphic(polygon, polygonFillSymbol); // add the polygon graphic to the graphics overlay graphicsOverlay.getGraphics().add(polygonGraphic); -
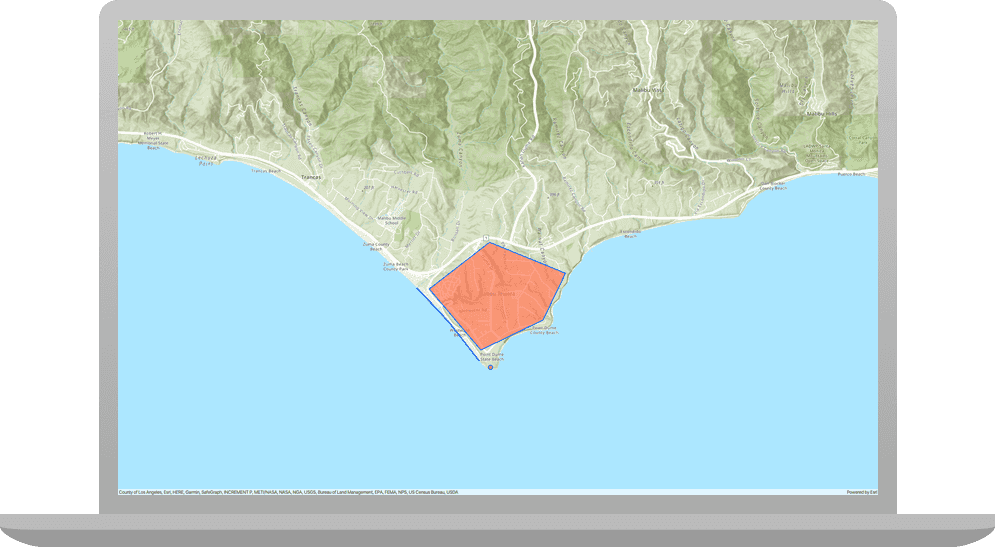
Run the app. Ensure to run the app as a Gradle task and not as an application in your IDE. In the Gradle tool window, under Tasks > application, double-click run.
You should see a point, line, and polygon graphic around Mahou Riviera in the Santa Monica Mountains.
What's next?
Learn how to use additional API features, ArcGIS location services, and ArcGIS tools in these tutorials: