This topic describes how to debug service interceptors. The debugging workflow for service interceptors, does not include a separate application to manage runtime debug settings. Instead, all debug management options are now available in ArcGIS Server Administrator Directory.
How to enable debugging
Follow these steps to enable Service Interceptor debugging.
-
Sign in to the ArcGIS Server Administrator Directory.
-
Browse to System -> properties and click Update.
-
Add a port range for Service Interceptor debug connections by adding the properties JSON (example):
{ "interceptorBegin Port" : "8000", "interceptor End Port" : "8010" } -
Choose a contiguous range of free ports that are not used by other services.

-
Click Update to save the change. ArcGIS Server will select a free port from the range and bind the Service Interceptor processes to that port.
-
Set the server log level to
Debugin ArcGIS Server Admin Directory: go to Site -> Logs -> Settings, set Log level toDebug, and click Save.
-
Check the server logs for the message that reports the port number allocated to the Service Interceptor process. It will appear in the server logs similar to the example below:
"Interceptor debugging enabled on port : 8000"
How to debug extensions using Java IDEs
To debug a Service Interceptor from a Java IDE, first determine the debug port ArcGIS Server assigned to Service Interceptor, then attach a remote debugger from your IDE.
-
Access the ArcGIS server logs in ArcGIS Server Admin Directory.
-
Look for the server logs and shows the debug port. Typical messages is
".Interceptor debugging enabled on port : xxxx" 
If you did not find this log message, it's likely that there is no available port within the port range defined in Properties to bind to the service process. See Debug tips on how to fix it.
-
Attach the debugger in your Java IDE using the
port numberyou found in the ArcGIS server logs.The following sections demonstrates how to attach the debugger in IntelliJ and Eclipse:
Debug extensions using IntelliJ
a. Open the Service Interceptor project in IntelliJ.
b. Click Run > Debug > Edit Configurations.
c. Click the Add New Configuration button (+).
d. Choose Remote in the Add New Configuration menu.
e. Enter the
port numberobtained from the previous steps in the Port text box.f. If your ArcGIS server and Java IDE are installed on the same machine, you can leave
localhostas the Host value. If your ArcGIS server is installed on a different machine from your Java IDE, type in the host name of your server machine.g. Click Debug.

Now the debugger is attached to the process. The message
"appears in the Debug tool window. You can perform service operations now to trigger the interceptor's breakpoint.Connected to the target V M, address : 'localhost :9001', transport : 'socket' " Debug extensions using Eclipse
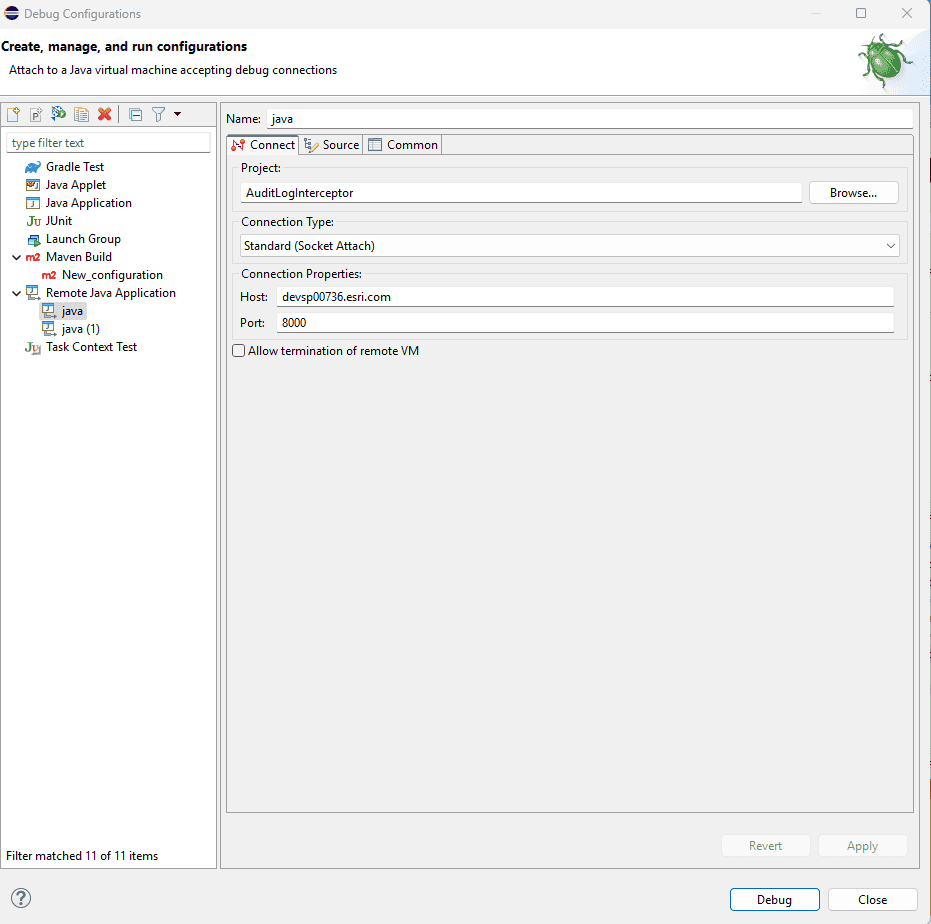
a. Open the Service Interceptor project in Eclipse.
b. Right-click your project and select Debug As….
c. Click Remote Java Application in the list of types of applications.
d. If this item doesn't contain any debug configurations, double-click Remote Java Application. This creates a debug configuration based on your project.

e. In the Port text box, type in the
port numbercopied from ArcGIS server logs.f. If your ArcGIS server and Java IDE are installed on the same machine, you can leave
localhostas the Host value. If your server is installed on a different machine from your Java IDE, type in the host name of your server machine.g. Click Debug.
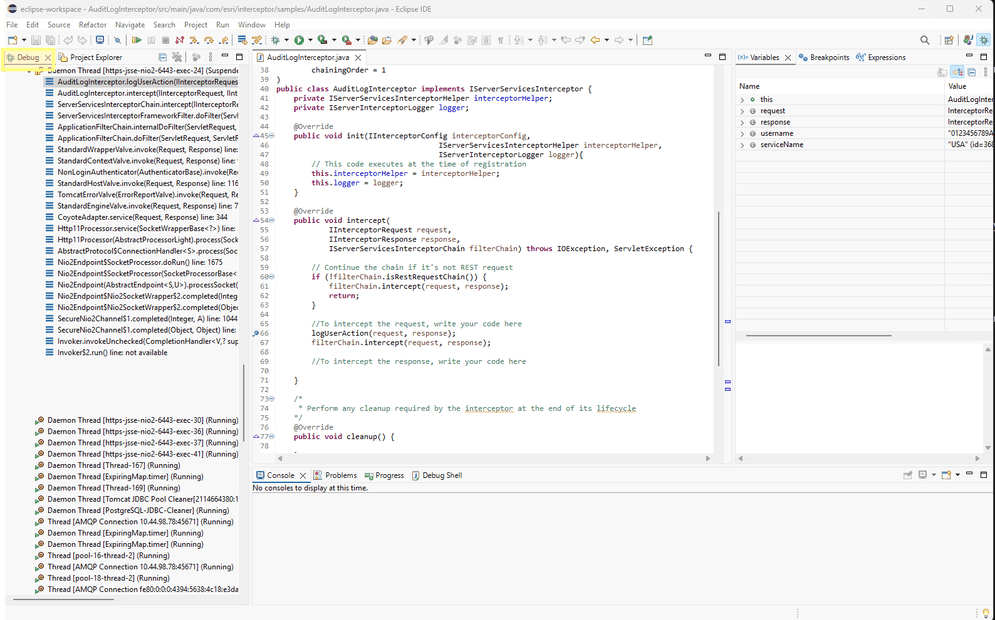
Now the debugger successfully attaches to the target process, a Debug tab becomes available in the left-side menu bar. You can then perform the relevant service operations, and the interceptor’s breakpoints will be triggered accordingly.

How to disable debugging
-
Sign in to ArcGIS Server Admin Directory.
-
Browse to System -> properties and click Update.

-
Update the properties json to a empty json to disable debugging.

-
Click Update. Debugging is now disabled in ArcGIS Server.

Debug Tips
-
Set log level to
Debug.Before turning debugging on, open the Logs page in ArcGIS Server Admin Directory and verify that the log level in both Settings and Log Filter are set to
Debug. Setting log level toDebugensures that logs at all the levels can be captured, especially for the logs showingport number. -
Adjust the port range.
If you can't find the
port numberin server logs as the screenshot above, all the ports within the port range may be in use. In this scenario, start again with a different range of ports. -
Remember to disable debugging.
Remember to turn debugging off in the System -> properties, update the properties json to a empty json, and click Update after your debugging session is over.