Use a symbol style to display a graphic on a graphics overlay.
Use case
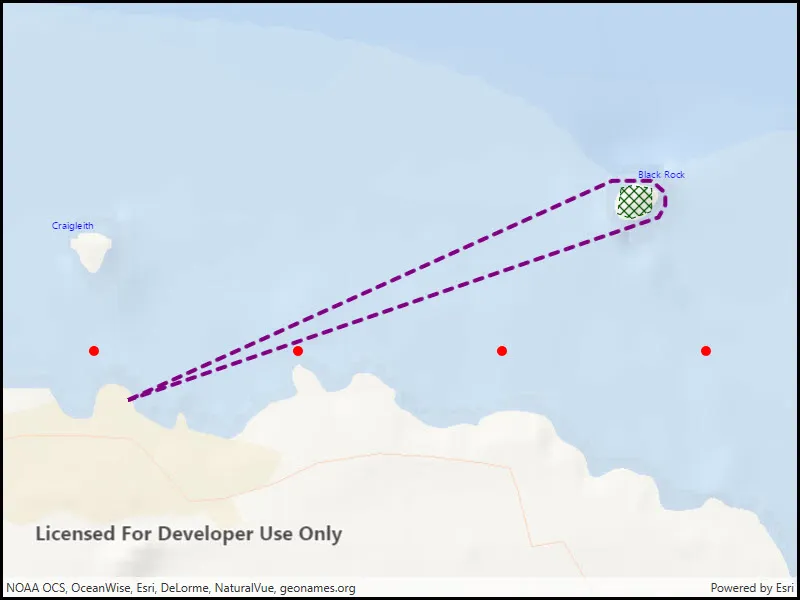
Allows you to customize a graphic by assigning a unique symbol. For example, you may wish to display individual graphics for different landmarks across a region, and to style each one with a unique symbol.
How to use the sample
Observe the graphics on the map.
How it works
- Create a
GraphicsOverlayand add it to theMapView. - Create a
Symbolsuch asSimpleMarkerSymbol,SimpleLineSymbolorSimpleFillSymbol. - Create a
Graphic, specifying aGeometryand aSymbol. - Add the
Graphicto theGraphicsOverlay.
Relevant API
- Geometry
- Graphic
- GraphicsOverlay
- SimpleFillSymbol
- SimpleLineSymbol
- SimpleMarkerSymbol
Additional information
To set a symbol style across a number of graphics (e.g. showing trees as graphics sharing a symbol in a park), see the “Add graphics with renderer” sample.
Tags
display, fill, graphics, line, marker, overlay, point, symbol
Sample code
// Copyright 2018 Esri.//// Licensed under the Apache License, Version 2.0 (the "License"); you may not use this file except in compliance with the License.// You may obtain a copy of the License at: http://www.apache.org/licenses/LICENSE-2.0//// Unless required by applicable law or agreed to in writing, software distributed under the License is distributed on an// "AS IS" BASIS, WITHOUT WARRANTIES OR CONDITIONS OF ANY KIND, either express or implied. See the License for the specific// language governing permissions and limitations under the License.
using Esri.ArcGISRuntime.Geometry;using Esri.ArcGISRuntime.Mapping;using Esri.ArcGISRuntime.Symbology;using Esri.ArcGISRuntime.UI;using System.Drawing;
namespace ArcGIS.WPF.Samples.AddGraphicsWithSymbols{    [ArcGIS.Samples.Shared.Attributes.Sample(        name: "Add graphics with symbols",        category: "GraphicsOverlay",        description: "Use a symbol style to display a graphic on a graphics overlay.",        instructions: "Observe the graphics on the map.",        tags: new[] { "display", "fill", "graphics", "line", "marker", "overlay", "point", "symbol" })]    public partial class AddGraphicsWithSymbols    {        // Create the graphics overlay.        private readonly GraphicsOverlay _overlay = new GraphicsOverlay();
        public AddGraphicsWithSymbols()        {            InitializeComponent();
            Initialize();        }
        private void Initialize()        {            // Create the map.            Map myMap = new Map(BasemapStyle.ArcGISOceans);            myMap.InitialViewpoint = new Viewpoint(56.075844, -2.681572, 14);
            // Add the map to the map view.            MyMapView.Map = myMap;
            // Add the graphics overlay to the map view.            MyMapView.GraphicsOverlays.Add(_overlay);
            // Call functions to create the graphics.            CreatePoints();            CreatePolygon();            CreatePolyline();            CreateText();
            // Update the extent to encompass all of the symbols.            SetExtent();        }
        private void CreatePoints()        {            // Create a red circle simple marker symbol.            SimpleMarkerSymbol redCircleSymbol = new SimpleMarkerSymbol(SimpleMarkerSymbolStyle.Circle, Color.FromArgb(0xFF, 0xFF, 0x00, 0x00), 10);
            // Create graphics and add them to graphics overlay.            Graphic graphic = new Graphic(new MapPoint(-2.72, 56.065, SpatialReferences.Wgs84), redCircleSymbol);            _overlay.Graphics.Add(graphic);
            graphic = new Graphic(new MapPoint(-2.69, 56.065, SpatialReferences.Wgs84), redCircleSymbol);            _overlay.Graphics.Add(graphic);
            graphic = new Graphic(new MapPoint(-2.66, 56.065, SpatialReferences.Wgs84), redCircleSymbol);            _overlay.Graphics.Add(graphic);
            graphic = new Graphic(new MapPoint(-2.63, 56.065, SpatialReferences.Wgs84), redCircleSymbol);            _overlay.Graphics.Add(graphic);        }
        private void CreatePolyline()        {            // Create a purple simple line symbol.            SimpleLineSymbol lineSymbol = new SimpleLineSymbol(SimpleLineSymbolStyle.Dash, Color.FromArgb(0xFF, 0x80, 0x00, 0x80), 4);
            // Create a new point collection for polyline.            Esri.ArcGISRuntime.Geometry.PointCollection points = new Esri.ArcGISRuntime.Geometry.PointCollection(SpatialReferences.Wgs84)            {                // Create and add points to the point collection.                new MapPoint(-2.715, 56.061),                new MapPoint(-2.6438, 56.079),                new MapPoint(-2.638, 56.079),                new MapPoint(-2.636, 56.078),                new MapPoint(-2.636, 56.077),                new MapPoint(-2.637, 56.076),                new MapPoint(-2.715, 56.061)            };
            // Create the polyline from the point collection.            Polyline polyline = new Polyline(points);
            // Create the graphic with polyline and symbol.            Graphic graphic = new Graphic(polyline, lineSymbol);
            // Add graphic to the graphics overlay.            _overlay.Graphics.Add(graphic);        }
        private void CreatePolygon()        {            // Create a green simple line symbol.            SimpleLineSymbol outlineSymbol = new SimpleLineSymbol(SimpleLineSymbolStyle.Dash, Color.FromArgb(0xFF, 0x00, 0x50, 0x00), 1);
            // Create a green mesh simple fill symbol.            SimpleFillSymbol fillSymbol = new SimpleFillSymbol(SimpleFillSymbolStyle.DiagonalCross, Color.FromArgb(0xFF, 0x00, 0x50, 0x00), outlineSymbol);
            // Create a new point collection for polygon.            Esri.ArcGISRuntime.Geometry.PointCollection points = new Esri.ArcGISRuntime.Geometry.PointCollection(SpatialReferences.Wgs84)            {                // Create and add points to the point collection.                new MapPoint(-2.6425, 56.0784),                new MapPoint(-2.6430, 56.0763),                new MapPoint(-2.6410, 56.0759),                new MapPoint(-2.6380, 56.0765),                new MapPoint(-2.6380, 56.0784),                new MapPoint(-2.6410, 56.0786)            };
            // Create the polyline from the point collection.            Polygon polygon = new Polygon(points);
            // Create the graphic with polyline and symbol.            Graphic graphic = new Graphic(polygon, fillSymbol);
            // Add graphic to the graphics overlay.            _overlay.Graphics.Add(graphic);        }
        private void CreateText()        {            // Create two text symbols.            TextSymbol bassRockTextSymbol = new TextSymbol("Black Rock", Color.Blue, 10,                Esri.ArcGISRuntime.Symbology.HorizontalAlignment.Left, Esri.ArcGISRuntime.Symbology.VerticalAlignment.Bottom);
            TextSymbol craigleithTextSymbol = new TextSymbol("Craigleith", Color.Blue, 10,                Esri.ArcGISRuntime.Symbology.HorizontalAlignment.Right, Esri.ArcGISRuntime.Symbology.VerticalAlignment.Top);
            // Create two points.            MapPoint bassPoint = new MapPoint(-2.64, 56.079, SpatialReferences.Wgs84);            MapPoint craigleithPoint = new MapPoint(-2.72, 56.076, SpatialReferences.Wgs84);
            // Create two graphics from the points and symbols.            Graphic bassRockGraphic = new Graphic(bassPoint, bassRockTextSymbol);            Graphic craigleithGraphic = new Graphic(craigleithPoint, craigleithTextSymbol);
            // Add graphics to the graphics overlay.            _overlay.Graphics.Add(bassRockGraphic);            _overlay.Graphics.Add(craigleithGraphic);        }
        private void SetExtent()        {            // Get all of the graphics contained in the graphics overlay.            GraphicCollection myGraphicCollection = _overlay.Graphics;
            // Create a new envelope builder using the same spatial reference as the graphics.            EnvelopeBuilder myEnvelopeBuilder = new EnvelopeBuilder(SpatialReferences.Wgs84);
            // Loop through each graphic in the graphic collection.            foreach (Graphic oneGraphic in myGraphicCollection)            {                // Union the extent of each graphic in the envelope builder.                myEnvelopeBuilder.UnionOf(oneGraphic.Geometry.Extent);            }
            // Expand the envelope builder by 30%.            myEnvelopeBuilder.Expand(1.3);
// Adjust the viewable area of the map to encompass all of the graphics in the // graphics overlay plus an extra 30% margin for better viewing. MyMapView.SetViewpointAsync(new Viewpoint(myEnvelopeBuilder.Extent)); } }}<UserControl x:Class="ArcGIS.WPF.Samples.AddGraphicsWithSymbols.AddGraphicsWithSymbols" xmlns="http://schemas.microsoft.com/winfx/2006/xaml/presentation" xmlns:x="http://schemas.microsoft.com/winfx/2006/xaml" xmlns:esri="http://schemas.esri.com/arcgis/runtime/2013"> <Grid> <esri:MapView x:Name="MyMapView" /> </Grid></UserControl>