The map widget
The GIS object includes a map widget for displaying geographic locations, visualizing GIS content, as well as the results of your analysis. To use the map widget, call gis.map() and assign it to a variable that you can then query to bring up the widget in the notebook:
import arcgis
from arcgis.gis import GIS
# Create a GIS object, as an anonymous user for this example
gis = GIS()
# Create a map widget
map1 = gis.map('Paris') # Passing a place name to the constructor
# will initialize the extent of the map.
map1
Setting the map properties
Zoom level
The map widget has several properties that you can query and set, such as its zoom level, basemap, height, etc:
map1.zoom12.0
Assigning a value to the zoom property will update the widget.
map1.zoom = 10Your notebook can have as many of these widgets as you wish. Let us create another map widget and modify some of its properties.
Map center
The center property reveals the coordinates of the center of the map.
map2 = gis.map() # creating a map object with default parameters
map2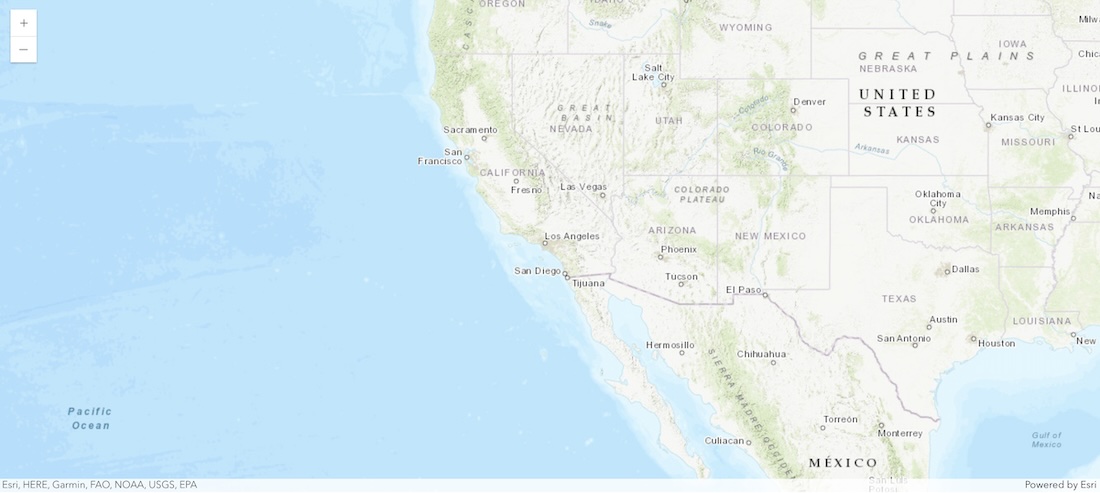
map2.center[-95.22142011666926, 38.14549630928053]
If you know the latitude and longitude of your place of interest, you can assign it to the center property.
map2.center = [34, -118] # here we are setting the map's center to Los AngelesYou can use geocoding to get the coordinates of place names and drive the widget. Geocoding converts place names to coordinates and can be used using arcgis.geocoding.geocode() function.
Let us geocode Times Square, NY and set the map's extent to the geocoded location's extent.
map3 = gis.map()
map3
location = arcgis.geocoding.geocode('Times Square, NY', max_locations=1)[0]
location['extent'].update({'spatialReference': {'wkid': 4326}})
map3.extent = location['extent']
Basemaps
Basemaps are the foundation for your maps and provide context for your work. An individual basemap can be made of multiple feature, raster, or web layers, and serves as a reference map on which you overlay data from layers and visualize geographic information. They typically span the full extent of the world and provide context to your GIS layers. It helps viewers understand where each feature is located as they pan and zoom to various extents. An organization can configure many basemaps to use in web maps.
To see which basemaps are available for use with the map widget, use the Map's basemap property to initialize a BasemapManager, and then use the basemaps property to return a list of basemaps currently configured with the organization:
from arcgis.gis import GIS
gis = GIS(profile="your_online_profile")
map4 = gis.map()
map4.basemap.basemaps['satellite', 'hybrid', 'terrain', 'oceans', 'osm', 'dark-gray-vector', 'gray-vector', 'streets-vector', 'topo-vector', 'streets-night-vector', 'streets-relief-vector', 'streets-navigation-vector', 'arcgis-imagery', 'arcgis-imagery-standard', 'arcgis-imagery-labels', 'arcgis-light-gray', 'arcgis-dark-gray', 'arcgis-navigation', 'arcgis-navigation-night', 'arcgis-streets', 'arcgis-streets-night', 'arcgis-streets-relief', 'arcgis-topographic', 'arcgis-oceans', 'osm-standard', 'osm-standard-relief', 'osm-streets', 'osm-streets-relief', 'osm-light-gray', 'osm-dark-gray', 'arcgis-terrain', 'arcgis-community', 'arcgis-charted-territory', 'arcgis-colored-pencil', 'arcgis-nova', 'arcgis-modern-antique', 'arcgis-midcentury', 'arcgis-newspaper', 'arcgis-hillshade-light', 'arcgis-hillshade-dark', 'arcgis-human-geography', 'arcgis-human-geography-dark']
note: The basemaps prefixed with the word
arcgisrequire a subscription in ArcGIS Online to use. If you have not signed into ArcGIS Online, you will be asked to when trying to access one of these basemaps.
You can assign any one of the supported basemaps to the basemap property to change the basemap. For instance, you can change the basemap to the dark gray vector basemap as below:
map4.basemap.basemap = 'dark-gray-vector'map4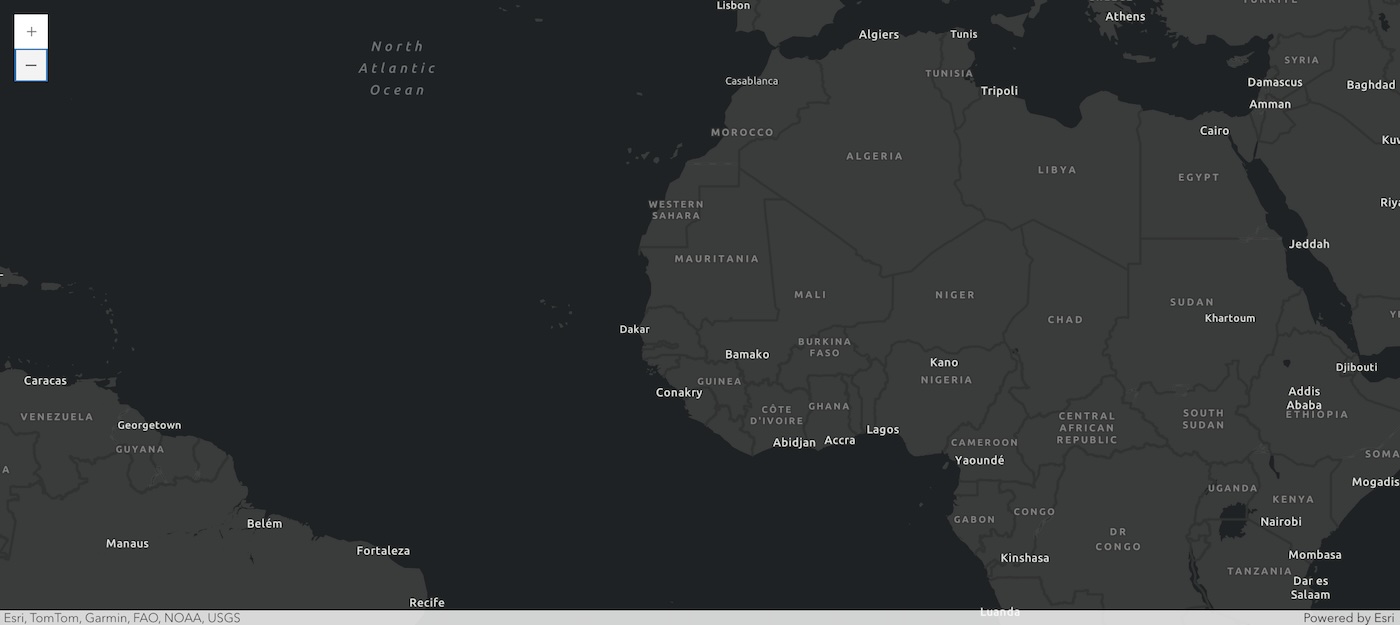
Query the basemap property to find what the current basemap is
map4.basemap.basemap{'baseMapLayers': [{'id': 'dark-gray-base-layer',
'layerType': 'VectorTileLayer',
'opacity': 1.0,
'styleUrl': 'https://www.arcgis.com/sharing/rest/content/items/5e9b3685f4c24d8781073dd928ebda50/resources/styles/root.json',
'title': 'Dark Gray Base',
'visibility': True},
{'id': 'dark-gray-reference-layer',
'isReference': True,
'layerType': 'VectorTileLayer',
'opacity': 1.0,
'styleUrl': 'https://www.arcgis.com/sharing/rest/content/items/747cb7a5329c478cbe6981076cc879c5/resources/styles/root.json',
'title': 'Dark Gray Reference',
'visibility': True}],
'title': 'Dark Gray Vector'}See below for an animation preview of some of the basemaps listed above:
map5 = gis.map('New York City, NY')
map5
import time

for basemap in map5.basemap.basemaps:
    map5.basemap.basemap = basemap
    time.sleep(3)
Displaying in 3D
Previous iterations of the map widget supported a 3D mode for display. With the Python API 2.4, this capability has been transferred into a new Scene class for a more comprehensive experience. Let's investigate using the map widget for 3D display. First, initialize a new scene:
from arcgis.map import Scenenew_scene = Scene()
new_scene
new_scene.zoom = 3Use the camera property to access the properties of the scene view.
new_scene.camera{'position': {'spatialReference': {'latestWkid': 3857, 'wkid': 102100},
'x': -10600000,
'y': 4543533.773902684,
'z': 25512548.000000007},
'heading': 8.537736462515939e-07,
'tilt': 0.0999905733927796}You can pan by clicking-and-dragging with the left mouse button, and you can zoom with the mouse wheel. Click-and-drag with the right mouse button to modify the tilt and heading properties of the scene camera.
See the ArcGIS Pro Camera Properties documentation for more details.
The tilt property is a number from 0-90: 0 represents a top-down 'birds-eye' view, while 90 represents a view parallel to the ground, facing the horizon. The circular arrow button on the widget changes the tilt property. The heading property indicates the direction the camera is pointing as a compass position. 0 indicates North, 180 indicates south. Set the heading value to observe camera view.
Try running the below two cells, and replace them with your own values!
new_scene.tilt = 0new_scene.heading = 45Read more about 3D mode by reading the advanced map widget useage guide page, or by reading the API reference.
Adding layers to the map
An important functionality of the map widget is its ability to add and render GIS layers. To add a layer call the .content.add() method and pass the layer object as an argument.
# Log into to GIS as we will save the widget as a web map later
gis = GIS(profile="your_online_profile")
usa_map = gis.map('USA')  # you can specify the zoom level when creating a map
usa_map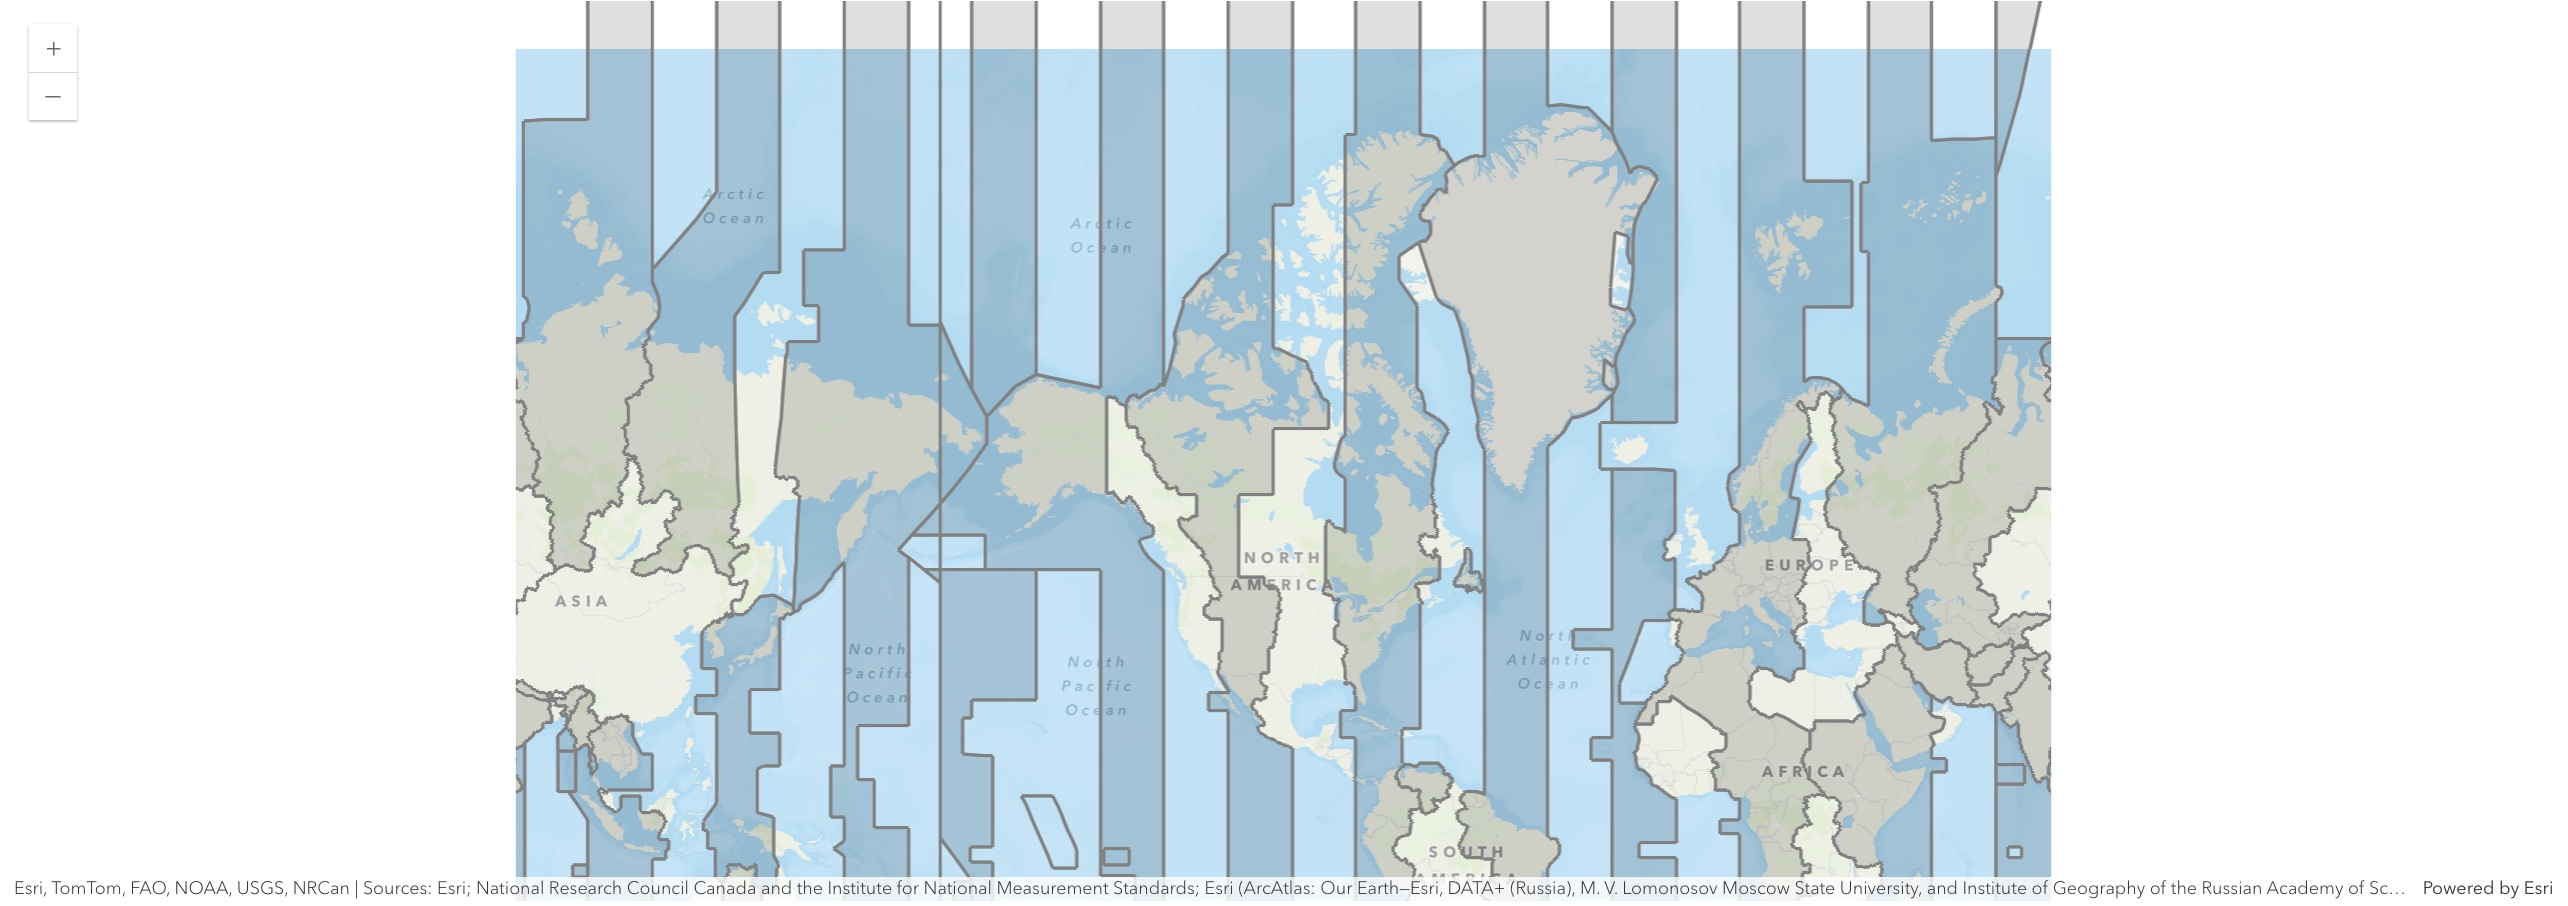
Adding Item objects to the map
You can add Item objects to a map by passing it to the .content.add() method.
world_timezones_item = gis.content.get('312cebfea2624e108e234220b04460b8')
usa_map.content.add(world_timezones_item)
Adding layer objects to the map
You can add a number of different layer objects such as FeatureLayer, FeatureCollection, ImageryLayer, MapImageLayer to the map. You can add a FeatureLayer as shown below:
world_map = gis.map()
world_map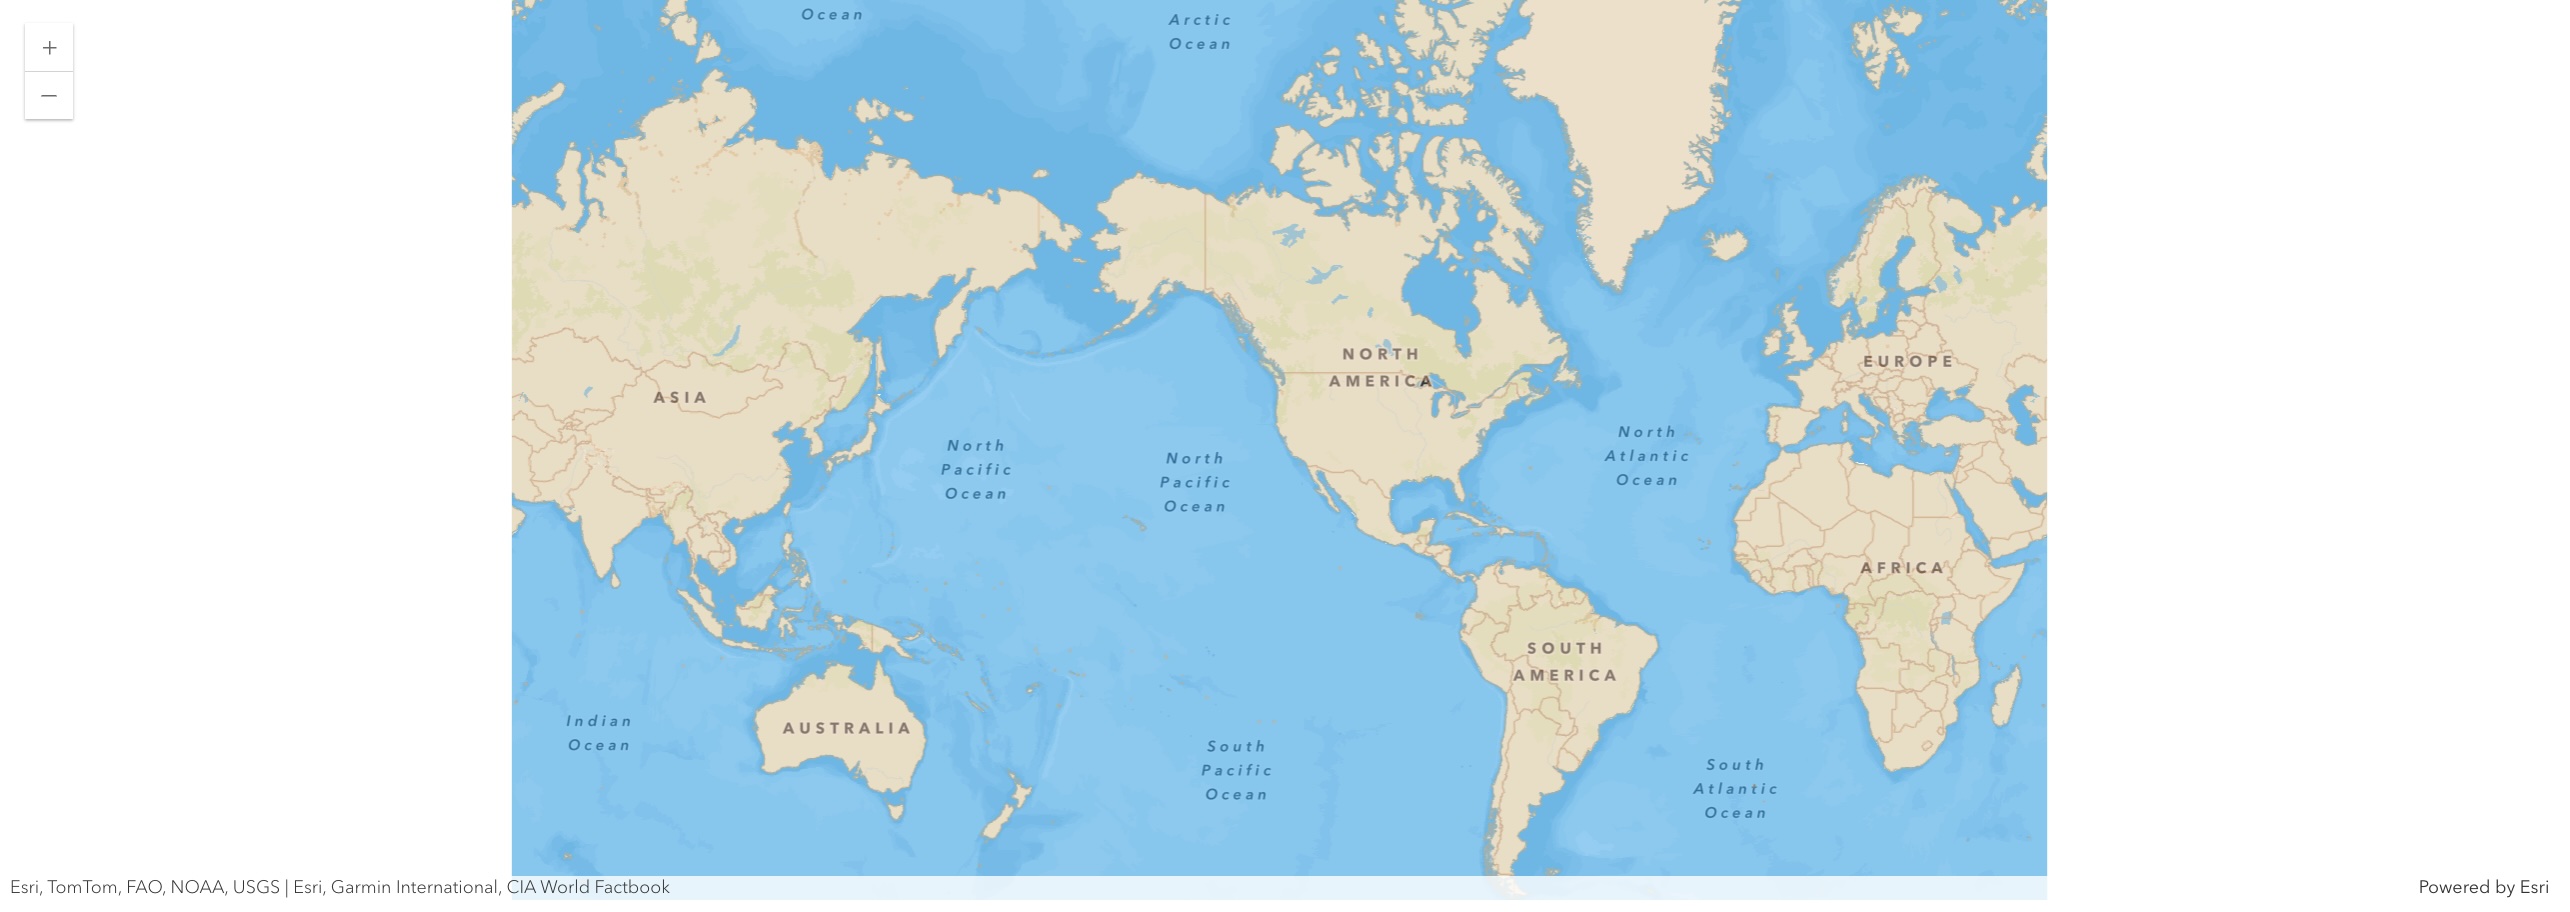
world_map.zoom = 1world_countries_item = gis.content.get('ac80670eb213440ea5899bbf92a04998')
world_countries_layer = world_countries_item.layers[0]
world_countries_layer<FeatureLayer url:"https://services.arcgis.com/P3ePLMYs2RVChkJx/arcgis/rest/services/World_Countries/FeatureServer/0">
world_map.content.add(world_countries_layer, options={'opacity':0.4})Adding imagery layers
Similar to FeatureLayers, you can also add ImageryLayers and imagery layer items. You can also specify either a built-in raster function or a custom one for rendering.
img_map = gis.map()
img_map
img_map.zoom = 2landsat_item = GIS().content.search("Landsat 8 Views", "Imagery Layer", max_items=2)[0]
landsat_item
img_map.content.add(landsat_item)Listing the layers added to the map
You can list the layers added to the map using the MapContent (accessed from the content property of a map object) object's layers property.
img_map.content.layers[<ImageryLayer url:"https://landsat2.arcgis.com/arcgis/rest/services/Landsat/PS/ImageServer">]
Removing layers from the map
To remove one or more layers, call the remove() method on the Map object, and pass a layer index value (or list of indexes) of the layer to remove. To get a list of valid layers that can be removed and their index positions, enumerate the map.content.layers output:.
The code below shows how to remove the timezone layers from the map we drew earlier:
for idx,lyr in enumerate(usa_map.content.layers):
    print(f"{idx:<6}{lyr}")
0 <FeatureLayer url:"https://services.arcgis.com/P3ePLMYs2RVChkJx/arcgis/rest/services/World_Time_Zones/FeatureServer/0">
usa_map.content.remove(0)True
usa_map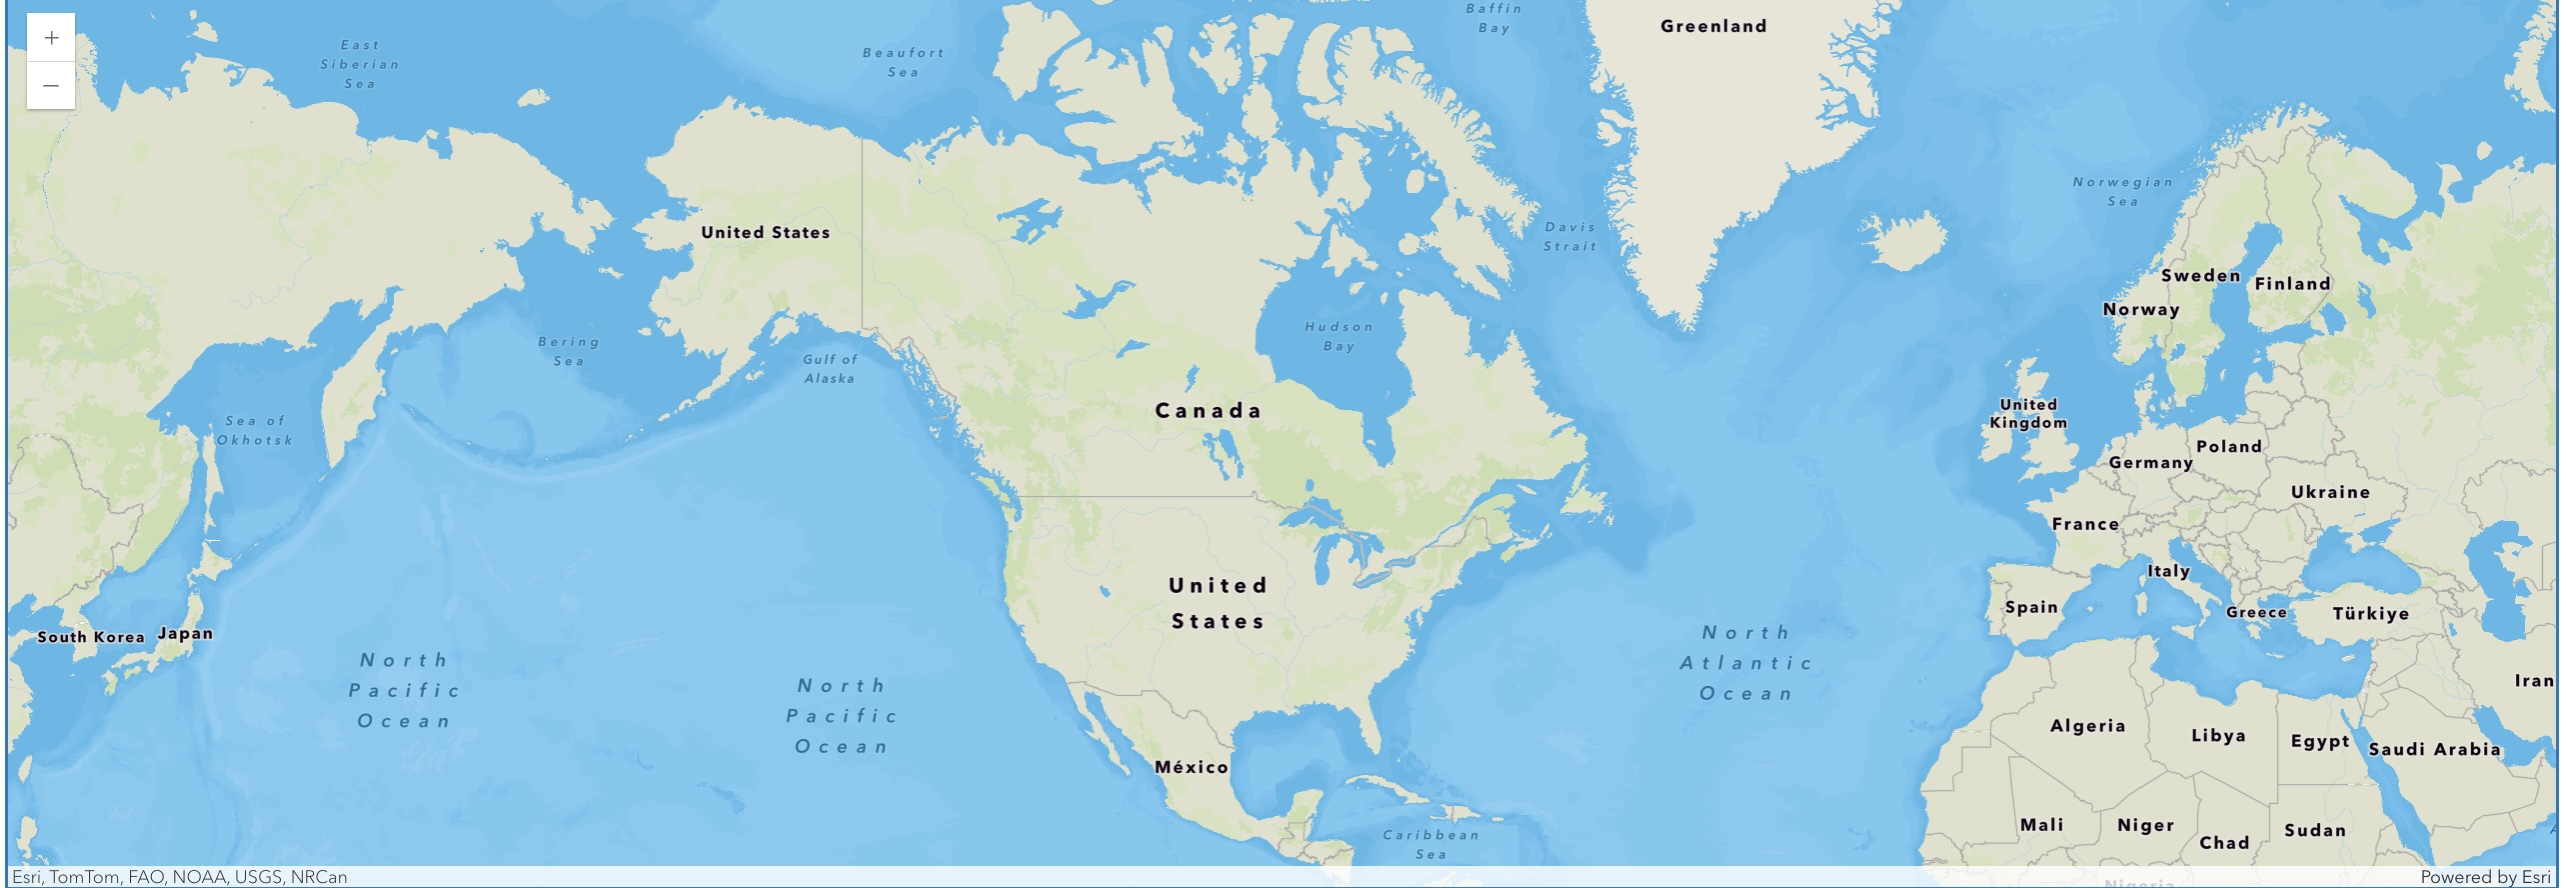
Zooming to Layer
To zoom to one or more layers, call the zoom_to_layer() method and pass a layer or list of layers that you want to snap your map to. The supplied item can be a single or a list of Items, layers, DataFrame, FeatureSet, FeatureCollection.
The code below shows how to zoom to a single layer or multiple items.
world_map# Zoom to a single layer
world_map.zoom_to_layer(world_countries_layer)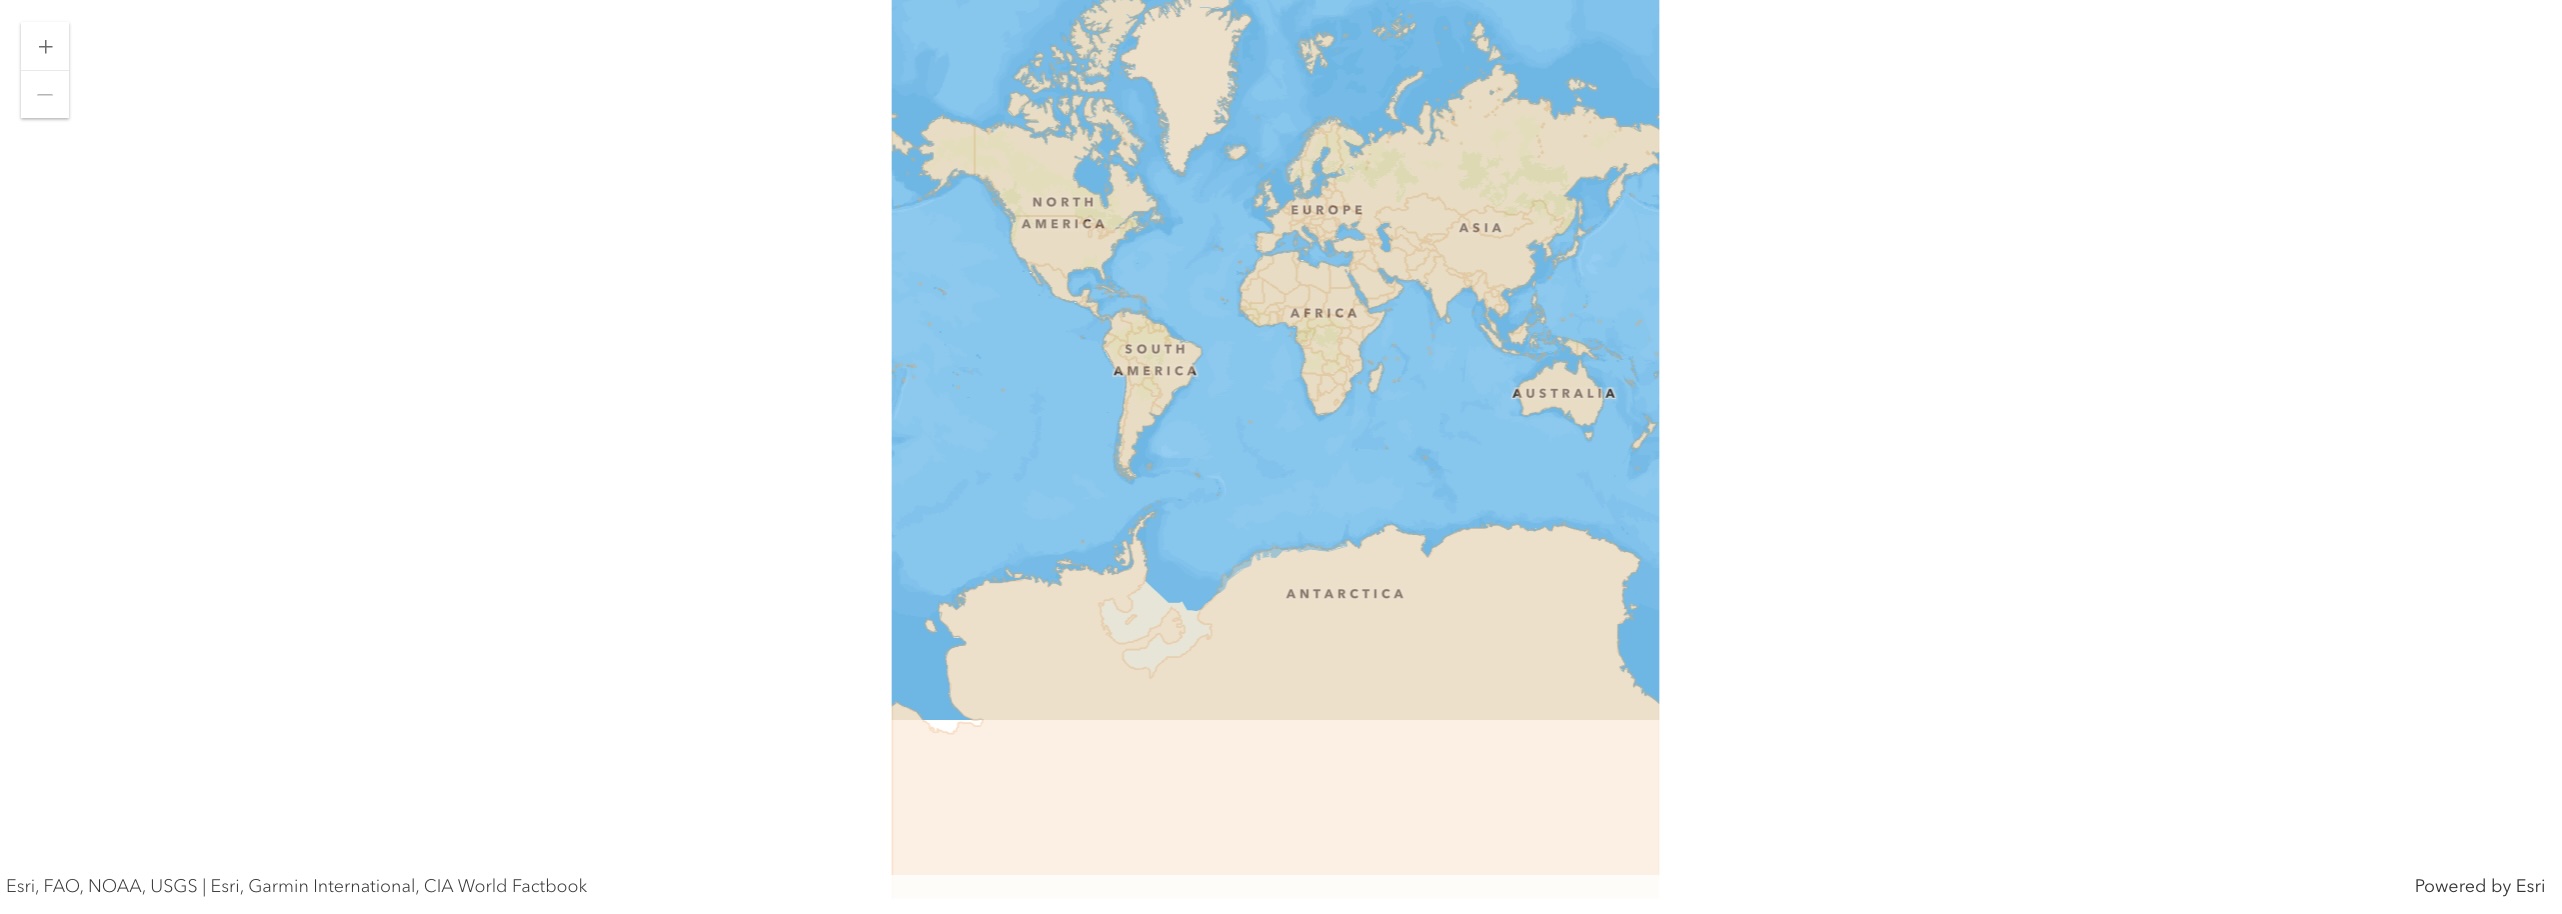
Drawing FeatureSet objects on the map
In addition to sketches, you can send FeatureSet objects to the draw() method. This capability comes in handy as you can get a FeatureSet object through various different operations using the Python API. For instance, you can get results of a geocoding operation as a FeatureSet or the results of a query() operation on a FeatureLayer as a FeatureSet that can you visualize on the map using the draw() method and a defined symbol.
The snippet below geocodes the locations of a few capitol buildings in the USA.
from arcgis.geocoding import geocode
usa_extent = geocode('USA')[0]['extent']
usa_extent
{'xmin': -145.49461919,
'ymin': -6.681296844,
'xmax': -53.33461919,
'ymax': 84.9}usa_capitols_fset = geocode('Capitol', search_extent=usa_extent, max_locations=10, as_featureset=True)
usa_capitols_fset<FeatureSet> 10 features
Drawing with custom symbols
While drawing a graphic, you can specify a custom symbol. For instance, you can pick a business marker symbol from a url for the capitol buildings as shown below:
usa2_map = gis.map("United States")
usa2_map
usa2_map.content.add(world_timezones_item)from arcgis.map.symbols import PictureMarkerSymbolEsriPMS
capitol_symbol = PictureMarkerSymbolEsriPMS(
**{"angle":0,
"xoffset":0,
"yoffset":0,
"type":"esriPMS",
"url":"https://static.arcgis.com/images/Symbols/PeoplePlaces/esriBusinessMarker_57.png",
"contentType":"image/png",
"width":24,
"height":24}
)capitol_symbolPictureMarkerSymbolEsriPMS(angle=0.0, content_type='image/png', height=24, image_data=None, type='esriPMS', url='https://static.arcgis.com/images/Symbols/PeoplePlaces/esriBusinessMarker_57.png', width=24, xoffset=0, yoffset=0)
usa2_map.content.draw(usa_capitols_fset, symbol=capitol_symbol)Saving the map as a web map
Starting with the Python API version 1.3, you can save the map widget as a web map in your GIS. This process persistes all the basemaps, layers added with or without your custom symbology including smart mapping, pop-ups, extent, graphics drawn with or without custom symbols as layers in your web map.
To save the map, call the save() method. This method creates and returns a new Web Map Item object. As parameters, you can specify all valid Item properties as shown below:
webmap_properties = {'title':'USA time zones and capitols',
                    'snippet': 'Jupyter notebook widget saved as a web map',
                    'tags':['automation', 'python']}

webmap_item = usa2_map.save(webmap_properties, thumbnail='./webmap_thumbnail.png', folder='webmaps')
webmap_item
You can use this web map back in the notebook, or in any ArcGIS app capabale of rendering web maps. To learn how you can use this read this web map using the Python API, refer to the guide titled working with web maps and scenes