Learn how to create a park maintenance survey with ArcGIS Survey123 and use ArcGIS Dashboards to monitor submitted maintenance reports.

In this tutorial, you will create a survey that maintenance workers can use to report issues. You will then build a dashboard that displays report locations, maintenance types, priorities, and summary statistics.
Publishing the survey creates the data source that stores submitted reports. The dashboard uses that data source to visualize and summarize the reports.
Prerequisites
You need the following:
- An ArcGIS Online or ArcGIS Enterprise account with publishing privileges
- Access to ArcGIS Survey123 and ArcGIS Dashboards
- A web browser
Steps
Create the maintenance survey
- Go to ArcGIS Survey123 and sign in.
- Select Create new survey, and then select Web designer.
- Select Blank survey.
- Enter the following survey details:
- Name:
Park Maintenance Reports - Tags:
parks, maintenance, reports - Summary:
Survey for reporting park maintenance issues
- Name:
Add the survey questions
Add the following questions in the order shown:
| Question type | Label | Options or settings | Required |
|---|---|---|---|
| Select from list | Type of Issue | Equipment Repair, Landscaping, Cleaning, Safety Hazard, and Other | Yes |
| Select from list | Priority Level | High, Medium, and Low | Yes |
| Map | Location of Issue | Enable search and location tracking. | Yes |
| Date | Date Reported | Set the default value to the current date. | Yes |
| Multiline text | Description | Add the hint Provide details about the maintenance issue. | Yes |
| Image | Photo of Issue | Allow multiple images. | No |
Configure and preview the survey
- Select Settings.
- Under Form settings, configure the following settings:
- Enable Collect accurate location.
- Set Submit data to Always.
- Select Save.
- Preview the survey and confirm that:
- All six questions appear in the expected order.
- The first five questions are required.
- The Photo of Issue question is optional.
Publish and test the survey
- Select Publish.
- Share the survey with your organization.
- Open the published survey.
- Submit a test maintenance report:
- Select an issue type and priority level.
- Mark a location.
- Enter a description.
- Optionally, add a test photo.
You should be able to submit the report without validation errors. The report provides data to use while configuring the dashboard.
Create the dashboard
- Go to ArcGIS Dashboards.
- Select Create new dashboard.
- Enter
Park Maintenance Dashboardas the title. - Save the dashboard.
Add the maintenance map
- Select Add element, and then select Map.
- Select the feature layer associated with Park Maintenance Reports.
- Configure the map to use Type of Issue to distinguish maintenance reports.
- Configure the pop-up to display:
- Type of Issue
- Priority Level
- Description
- Photo of Issue, when available
- Save the map configuration.
Confirm that the test report appears at the location you submitted.
Add a chart for issue types
- Select Add element, and then select Serial chart.
- Use the survey's feature layer as the data source.
- Group reports by Type of Issue and display the number of reports in each category.
- Select a vertical bar chart.
- Enter
Issues by Typeas the title, and save the chart.
Confirm that the chart contains a category for the issue type used in your test report.
Add a chart for priority levels
- Select Add element, and then select Pie chart.
- Use the survey's feature layer as the data source.
- Group reports by Priority Level and display the number of reports in each category.
- Enter
Issues by Priorityas the title, and save the chart.
Confirm that the chart contains a segment for the priority used in your test report.
Add an indicator for total reports
- Select Add element, and then select Indicator.
- Use the survey's feature layer as the data source.
- Configure the indicator to display the total number of maintenance reports.
- Enter
Total Issues Reportedas the title, and save the indicator.
The indicator should display at least 1 for the test report you submitted.
Add a list of recent reports
- Select Add element, and then select List.
- Use the survey's feature layer as the data source.
- Configure the list to display:
- Date Reported
- Type of Issue
- Priority Level
- Description
- Configure the list to show the most recent reports first, and save it.
Confirm that your test report appears in the list.
Configure dashboard interactions
Configure a map action so that selecting maintenance reports on the map filters the list to matching reports.
Test the completed workflow
- Open the published survey in a new tab.
- Submit a second report with a different issue type, priority level, and location.
- Return to the dashboard.
- Confirm that:
- The second report appears on the map and in the list.
- The issue-type and priority charts include the new report.
- The total number of reports increases.
- Selecting a report on the map filters the list as expected.
If the report does not appear, verify that each dashboard element uses the feature layer associated with Park Maintenance Reports.
Share the solution
- In the dashboard, select Share.
- Share the dashboard with the intended audience according to your organization's requirements.
- Copy the dashboard URL to distribute it to dashboard users.
If maintenance staff need access through an ArcGIS group, create or select the appropriate group and share the required survey and dashboard content with it.
Production considerations
Before deploying the solution:
- Use choice questions for values that users need to group, filter, or summarize.
- Require only the questions necessary for a useful maintenance report.
- Test the workflow from survey submission through dashboard display.
- Review your organization's data-sharing requirements.
- Evaluate attachment use, data volume, and refresh behavior when planning for performance.
For workflows that collect sensitive information, determine whether a feature layer view or another data-access strategy is appropriate before sharing the dashboard.
Tutorials
Create a simple survey
Learn how to use ArcGIS Survey123 to create a simple survey.
Low-code/no-code
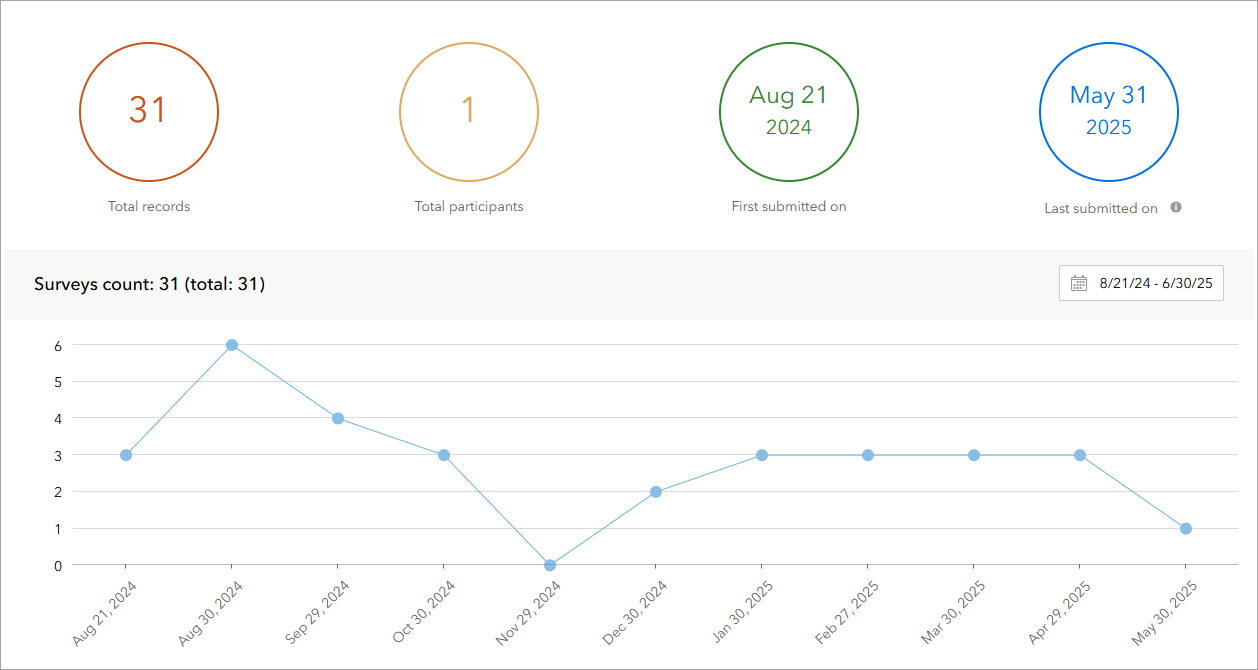
Analyze survey results
Learn how to use ArcGIS Survey123 to analyze survey results.
Low-code/no-code
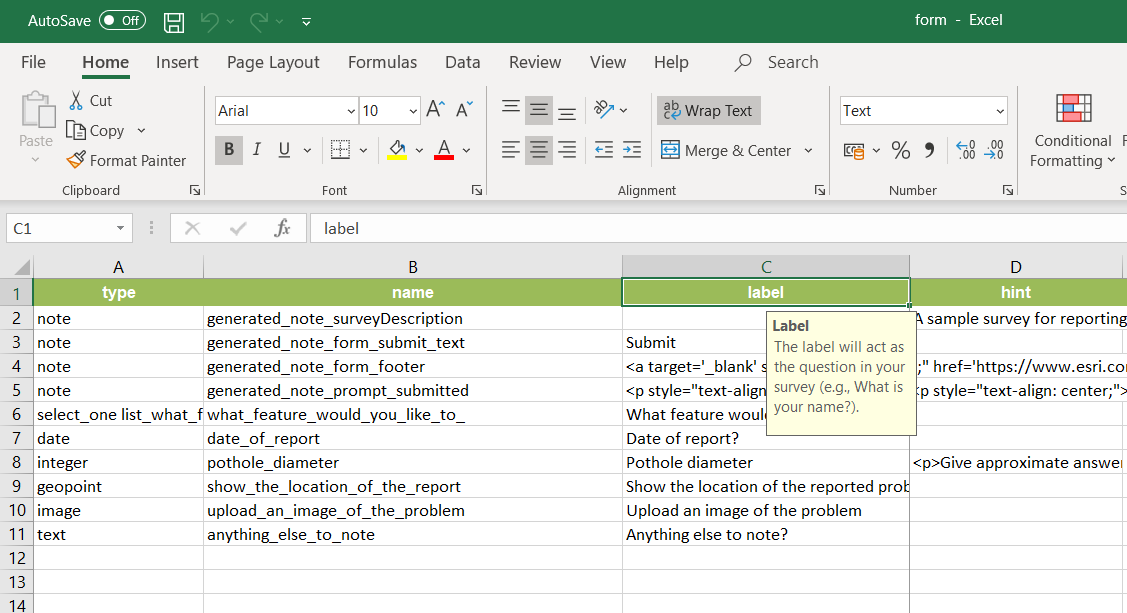
Create a smarter, responsive survey
Learn how to create intelligent surveys with conditional logic, hidden fields, and dynamic visibility using ArcGIS Survey123 and XLSForm.
Low-code/no-code