Hide Table of Contents
View Get driving directions sample in sandbox
Get driving directions

Description

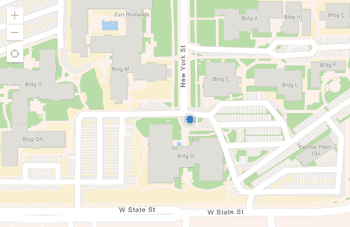
This sample shows how you can calculate a route and display driving directions, similar to the functionality on many popular Web mapping sites. Clicking on one of the directions zooms the map to the relevant segment of the route.

When you set up the parameters for your Route Task, you can specify whether directions should be included with the returned route:

routeParams.returnDirections = true;

Each result in the DirectionsFeatureSet corresponds to a segment of the route. This sample iterates through the segments and creates an ordered list of hyperlinksThese values are returned both for the entire route and for each segment.

This sample requires a proxy to handle communications with the Routing and Directions service. This example uses an ArcGIS Online hosted proxy. You can either remove it and log in once prompted, or you can set up your ownservice proxy.

Code

<!DOCTYPE html>
<html>
<head>
  <meta http-equiv="Content-Type" content="text/html; charset=utf-8">
  <meta name="viewport" content="initial-scale=1, maximum-scale=1,user-scalable=no">
  <title>Driving Directions</title>

  <link rel="stylesheet" href="https://js.arcgis.com/3.46/dijit/themes/claro/claro.css">
  <link rel="stylesheet" href="https://js.arcgis.com/3.46/dgrid/css/dgrid.css">
  <link rel="stylesheet" href="https://js.arcgis.com/3.46/esri/css/esri.css">
  <style>
    html,body {
      font-family: Arial,Helvetica,sans-serif;
      height:100%;
      margin:0;
    }
    #map {
      height:100%;
      overflow:hidden;
    }
    #dialog {
      top: 15px;
      right: 15px;
      position: absolute;
      padding: 5px;
      width: 380px;
      background-color: #ffffff;
      border-radius: 5px;
      margin: 8px;
      box-shadow: 0px 1px 3px #888;
    }
    #dialog input{
      margin: 0.5em;
      width: 20em;
    }
    #grid{
      overflow-x:hidden;
      overflow-y:auto;
    }
    input#directions {
      margin: 0.5em auto;
      width:  8em;
      display: block;
    }
    .dgrid-row{
      padding:5px;
      margin-bottom:5px;
      min-height:50px;
      border-bottom: solid 1px #C0C0C0;
    }
    .dgrid-row .detail div {
      cursor: pointer;
    }
    .dgrid-row .detail div:hover{
      text-decoration:underline;
    }
    .distance{
      float:right;
      color:#C0C0C0;
      font-style:italic;
    }
  </style>
  <script src="https://js.arcgis.com/3.46/"></script>
  <script>
    var map;

    require([
      "esri/map", "esri/tasks/locator", "esri/SpatialReference",
      "esri/tasks/RouteTask", "esri/tasks/RouteParameters",
      "esri/tasks/FeatureSet", "esri/units", "esri/config", "esri/lang",
      "esri/symbols/PictureMarkerSymbol", "esri/graphic",
      "esri/symbols/SimpleLineSymbol",
      "dojo/promise/all", "dojo/_base/array", "esri/Color",
      "dojo/dom", "dojo/dom-construct", "dojo/on", "dojo/number",
      "dgrid/Grid", "dojo/domReady!"
    ], function(
      Map, Locator, SpatialReference,
      RouteTask, RouteParameters,
      FeatureSet, esriUnits, esriConfig, esriLang,
      PictureMarkerSymbol, Graphic,
      SimpleLineSymbol,
      all, arrayUtils, Color,
      dom, domConstruct, on, number,
      Grid
    ) {
      var locator, routeTask, routeParams = [], segmentGraphic, directionFeatures, grid;

      on(dom.byId("directions"), "click", getDirections);

      //Create a map with an initial extent. Change the extent to match the area you would like to show.
      map = new Map("map", {
        basemap: "streets-vector",
        center: [-117.185, 34.065],
        zoom: 13
      });

      //Add a geocoding server as the locator. This locator will be used to find the origin and destination coordinates by input addresses.
      locator = new Locator("https://geocode.arcgis.com/arcgis/rest/services/World/GeocodeServer");
      locator.outSpatialReference = map.spatialReference;

      //Fire errorHandler if the locator return en error.
      locator.on("error", errorHandler);

      //Add a network analyst server with related parameters to execute the routing task.
      routeTask = new RouteTask("https://utility.arcgis.com/usrsvcs/appservices/srsKxBIxJZB0pTZ0/rest/services/World/Route/NAServer/Route_World/solve");
      routeParams = new RouteParameters();
      routeParams.stops = new FeatureSet();
      routeParams.returnRoutes = false;
      routeParams.returnDirections = true;
      routeParams.directionsLengthUnits = esriUnits.MILES;
      routeParams.outSpatialReference = new SpatialReference({ wkid:102100 });

      //Show the route when the routing task is solved successfully, otherwise fire errorHandler.
      routeTask.on("solve-complete", showRoute);
      routeTask.on("error", errorHandler);

      //Execute a routing task when clicking "get direction".
      function getDirections() {
        routeParams.stops.features = [];
        map.graphics.clear();

        //Get origin address.
        var optionsFrom = {
          address: { "SingleLine": dom.byId("fromTxf").value },
          outFields: ["Loc_name"]
        };
        var fromAddress = locator.addressToLocations(optionsFrom);

        //Get destination address.
        var optionsTo = {
          address: { "SingleLine": dom.byId("toTxf").value },
          outFields: ["Loc_name"]
        };
        var toAddress = locator.addressToLocations(optionsTo);

        //Use dojo/promises/all to manage multiple asynchronous tasks. Once both geocodes finish, a route is calculated.
        //http://livedocs.dojotoolkit.org/dojo/promise/all
        all({
          from: fromAddress,
          to: toAddress
        }).then(configureRoute);
      }

      //Check if the origin and destination addresses are executed successfully
      //and solve the routing task.
      function configureRoute(results) {
        //Configure symbols to be used for destinations and route segments.
        var fromSymbol = new PictureMarkerSymbol({
          "angle":0,
          "xoffset":0,
          "yoffset":10,
          "type":"esriPMS",
          "url":"https://static.arcgis.com/images/Symbols/Shapes/GreenPin1LargeB.png",
          "contentType":"image/png",
          "width":24,
          "height":24
        });
        var toSymbol = new PictureMarkerSymbol({
          "angle":0,
          "xoffset":0,
          "yoffset":12,
          "type":"esriPMS",
          "url":"https://static.arcgis.com/images/Symbols/Shapes/RedPin1LargeB.png",
          "contentType":"image/png",
          "width":24,
          "height":24
        });

        var fromStop = getCandidate(results.from);
        if ( fromStop === null ) {
          errorHandler("The origin address is invalid");
        } else {
          var fromGraphic = new Graphic(fromStop.location, fromSymbol, { address:fromStop.address });
          routeParams.stops.features[0] = map.graphics.add(fromGraphic);
          fromGraphic.getShape().moveToFront();
        }

        var toStop = getCandidate(results.to);
        if ( toStop === null ) {
          errorHandler("The destination address is invalid");
        } else {
          var toGraphic = new Graphic(toStop.location, toSymbol, { address:toStop.address });
          routeParams.stops.features[1] = map.graphics.add(toGraphic);
          toGraphic.getShape().moveToFront();
        }

        if ( fromStop !== null && toStop !== null ) {
          routeTask.solve(routeParams);
        }
      }

      //Handle all the coordinate candidates of the origin and destination addresses and
      //return the candidate with the highest score.
      function getCandidate(candidates){
        var stop = null, score = 0;
        arrayUtils.forEach(candidates, function(candidate){
          if( candidate.score > score ) {
           stop = candidate;
           score = candidate.score;
          }
        });
        return stop;
      }

      //Show the result of the routing task.
      function showRoute(e) {
        var data = [];
        if ( grid ) {
          grid.refresh();
        }

        var directions = e.result.routeResults[0].directions;
        directionFeatures = directions.features;
        var routeSymbol = new SimpleLineSymbol().setColor(new Color([0,0,255,0.5])).setWidth(4);

        // Zoom to results.
        map.setExtent(directions.mergedGeometry.getExtent(), true);

        // Add route to the map.
        var routeGraphic = new Graphic(directions.mergedGeometry, routeSymbol);
        map.graphics.add(routeGraphic);
        map.setExtent(directions.extent, true);

        //Display the directions.
        var directionsInfo = e.result.routeResults[0].directions.features;
        var totalDistance = number.format(directions.totalLength);
        var totalLength = number.format(directions.totalTime);
        data = arrayUtils.map(directionsInfo,function(feature,index){
          return {
            "detail": feature.attributes.text,
            "distance": number.format(feature.attributes.length,{places:2}),
            "index": index
          };
        });
        grid = new Grid({
          renderRow: renderList,
          showHeader:false
        }, "grid");
        grid.renderArray(data);
        grid.on(".dgrid-row:click", zoomToSegment);
      }

      function renderList(obj,options){
        var template = "<div class='detail'><div style='max-width:70%;float:left;'>${detail}</div><span style='float:right;' class='distance'>${distance} mi</span></div>";
        return domConstruct.create("div", { innerHTML: esriLang.substitute(obj, template) });
      }
      //Display any errors that were caught when attempting to solve the route.
      function errorHandler(err) {
        alert("An error occured\n" + err);
      }

      function zoomToSegment(e) {
        //Grid row id corresponds to the segment to highlight.
        var index = grid.row(e).id;
        var segment = directionFeatures[index];
        var segmentSymbol = new SimpleLineSymbol().setColor(new Color([255,0,0,0.5])).setWidth(8);

        map.setExtent(segment.geometry.getExtent(), true);
        if ( !segmentGraphic ) {
          segmentGraphic = map.graphics.add(new Graphic(segment.geometry, segmentSymbol));
        } else {
          segmentGraphic.setGeometry(segment.geometry);
        }
      }
    });
  </script>
</head>
<body class="claro">
  <div id="map"></div>
  <div id="dialog">
    <div>
      <label for="fromTxf"><img src="https://static.arcgis.com/images/Symbols/Shapes/GreenPin1LargeB.png" width=24 height=24></label>
      <input type="text" id="fromTxf" value="380 New York St, Redlands, CA 92373">
    </div>
    <div >
      <label for="toTxf"><img src="https://static.arcgis.com/images/Symbols/Shapes/RedPin1LargeB.png" width=24 height=24></label>
      <input type="text" id="toTxf" value="1320 Mona Ave, Redlands, CA 92374">
    </div>
    <input id="directions" type="button" value="Get Directions">
    <div id="directionsDetail" style="clear:both;">
      <div id="grid"></div>
    </div>
  </div>

</body>
</html>
 
          
Show Modal