Create graphics for utility associations in a utility network.
Use case
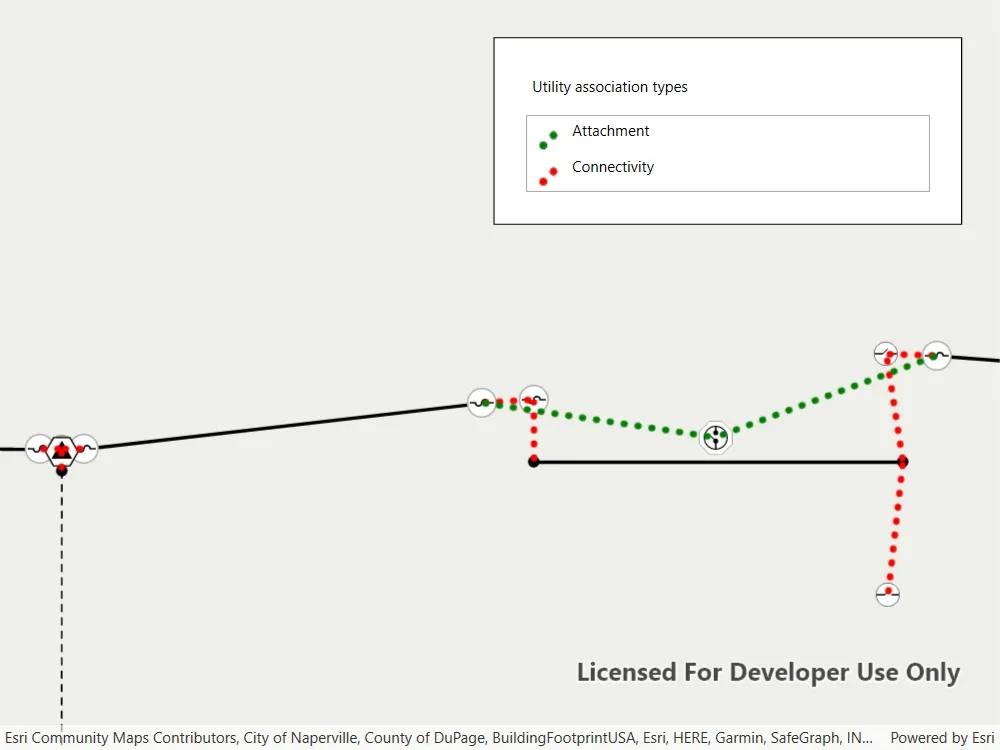
Visualizing utility associations can help you to better understand trace results and the topology of your utility network. For example, connectivity associations allow you to model connectivity between two junctions that don’t have geometric coincidence (are not in the same location); structural attachment associations allow you to model equipment that may be attached to structures; and containment associations allow you to model features contained within other features.
How to use the sample
Pan and zoom around the map. Observe graphics that show utility associations between junctions.
How it works
- Create and load a
Mapwith a web map item URL that contains aUtilityNetwork. - Get and load the first
UtilityNetworkfrom the web map. - Create a
GraphicsOverlayfor the utility associations. - Add an event handler for the
ViewpointChangedevent of theMapView. - When the sample starts and every time the viewpoint changes, do the following steps.
- Get the geometry of the mapview’s extent using
GetCurrentViewpoint(ViewpointType.BoundingGeometry)?.TargetGeometry?.Extent. - Get the associations that are within the current extent using
GetAssociationsAsync(extent). - Get the
UtilityAssociationTypefor each association. - Create a
Graphicusing theGeometryproperty of the association and a preferred symbol. - Add the graphic to the graphics overlay.
Relevant API
- GraphicsOverlay
- UtilityAssociation
- UtilityAssociationType
- UtilityNetwork
About the data
The Naperville Electric Map web map contains a utility network used to run the subnetwork-based trace in this sample. Authentication is required and handled within the sample code.
Additional information
Using utility network on ArcGIS Enterprise 10.8 requires an ArcGIS Enterprise member account licensed with the Utility Network user type extension. Please refer to the utility network services documentation.
Tags
associating, association, attachment, connectivity, containment, relationships
Sample code
// Copyright 2020 Esri.//// Licensed under the Apache License, Version 2.0 (the "License"); you may not use this file except in compliance with the License.// You may obtain a copy of the License at: http://www.apache.org/licenses/LICENSE-2.0//// Unless required by applicable law or agreed to in writing, software distributed under the License is distributed on an// "AS IS" BASIS, WITHOUT WARRANTIES OR CONDITIONS OF ANY KIND, either express or implied. See the License for the specific// language governing permissions and limitations under the License.
using Esri.ArcGISRuntime;using Esri.ArcGISRuntime.Geometry;using Esri.ArcGISRuntime.Mapping;using Esri.ArcGISRuntime.Security;using Esri.ArcGISRuntime.Symbology;using Esri.ArcGISRuntime.UI;using Esri.ArcGISRuntime.UtilityNetworks;using System;using System.Collections.Generic;using System.Diagnostics;using System.Drawing;using System.Linq;using System.Threading.Tasks;using System.Windows;
namespace ArcGIS.WPF.Samples.DisplayUtilityAssociations{    [ArcGIS.Samples.Shared.Attributes.Sample(        name: "Display utility associations",        category: "Utility network",        description: "Create graphics for utility associations in a utility network.",        instructions: "Pan and zoom around the map. Observe graphics that show utility associations between junctions.",        tags: new[] { "associating", "association", "attachment", "connectivity", "containment", "relationships" })]    public partial class DisplayUtilityAssociations    {        // This viewpoint shows several associations clearly in the utility network.        private readonly Viewpoint InitialViewpoint = new Viewpoint(new MapPoint(-9812698.37297436, 5131928.33743317, SpatialReferences.WebMercator), 22d);
        // Max scale at which to create graphics for the associations.        private const double _maxScale = 2000;
        // Overlay to hold graphics for all of the associations.        private GraphicsOverlay _associationsOverlay;
        // Utility network that will be created from the feature server.        private UtilityNetwork _utilityNetwork;
        public DisplayUtilityAssociations()        {            InitializeComponent();            _ = Initialize();        }
        private async Task Initialize()        {            // As of ArcGIS Enterprise 10.8.1, using utility network functionality requires a licensed user. The following login for the sample server is licensed to perform utility network operations.            AuthenticationManager.Current.ChallengeHandler = new ChallengeHandler(async (info) =>            {                try                {                    // WARNING: Never hardcode login information in a production application. This is done solely for the sake of the sample.                    string sampleServer7User = "viewer01";                    string sampleServer7Pass = "I68VGU^nMurF";
                    return await AccessTokenCredential.CreateAsync(info.ServiceUri, sampleServer7User, sampleServer7Pass);                }                catch (Exception ex)                {                    Debug.WriteLine(ex.Message);                    return null;                }            });
            try            {                // Create the map.                MyMapView.Map = new Map(new Uri("https://sampleserver7.arcgisonline.com/portal/home/item.html?id=be0e4637620a453584118107931f718b"));                await MyMapView.Map.LoadAsync();
                // Get the utility network from the map.                _utilityNetwork = MyMapView.Map.UtilityNetworks.FirstOrDefault();                await _utilityNetwork.LoadAsync();
                // Create a graphics overlay for associations.                _associationsOverlay = new GraphicsOverlay();                MyMapView.GraphicsOverlays.Add(_associationsOverlay);
                // Symbols for the associations.                Symbol attachmentSymbol = new SimpleLineSymbol(SimpleLineSymbolStyle.Dot, Color.Green, 5d);                Symbol connectivitySymbol = new SimpleLineSymbol(SimpleLineSymbolStyle.Dot, Color.Red, 5d);
                // Create a renderer for the associations.                var attachmentValue = new UniqueValue("Attachment", string.Empty, attachmentSymbol, UtilityAssociationType.Attachment.ToString());                var connectivityValue = new UniqueValue("Connectivity", string.Empty, connectivitySymbol, UtilityAssociationType.Connectivity.ToString());                _associationsOverlay.Renderer = new UniqueValueRenderer(new List<string> { "AssociationType" }, new List<UniqueValue> { attachmentValue, connectivityValue }, string.Empty, null);
                // Populate the legend in the UI.                Dictionary<UtilityAssociationType, System.Windows.Media.ImageSource> legend;                legend = new Dictionary<UtilityAssociationType, System.Windows.Media.ImageSource>();
                RuntimeImage attachmentSwatch = await attachmentSymbol.CreateSwatchAsync();                legend[UtilityAssociationType.Attachment] = await attachmentSwatch?.ToImageSourceAsync();
                RuntimeImage connectSwatch = await connectivitySymbol.CreateSwatchAsync();                legend[UtilityAssociationType.Connectivity] = await connectSwatch?.ToImageSourceAsync();
                AssociationLegend.ItemsSource = legend;
                // Set the starting viewpoint.                await MyMapView.SetViewpointAsync(InitialViewpoint);
                // Add the associations in the starting viewpoint.                _ = AddAssociations();            }            catch (Exception ex)            {                MessageBox.Show(ex.Message, ex.GetType().Name, MessageBoxButton.OK, MessageBoxImage.Error);            }        }
        private void OnNavigationCompleted(object sender, EventArgs e)        {            _ = AddAssociations();        }
        private async Task AddAssociations()        {            try            {                // Check if the current viewpoint is outside of the max scale.                if (MyMapView.GetCurrentViewpoint(ViewpointType.CenterAndScale)?.TargetScale >= _maxScale)                {                    return;                }
                // Check if the current viewpoint has an extent.                Envelope extent = MyMapView.GetCurrentViewpoint(ViewpointType.BoundingGeometry)?.TargetGeometry?.Extent;                if (extent == null)                {                    return;                }
                // Get all of the associations in extent of the viewpoint.                IEnumerable<UtilityAssociation> associations = await _utilityNetwork.GetAssociationsAsync(extent);                foreach (UtilityAssociation association in associations)                {                    // Check if the graphics overlay already contains the association.                    if (_associationsOverlay.Graphics.Any(g => g.Attributes.ContainsKey("GlobalId") && (Guid)g.Attributes["GlobalId"] == association.GlobalId))                    {                        continue;                    }
                    // Add a graphic for the association.                    Graphic graphic = new Graphic(association.Geometry);                    graphic.Attributes["GlobalId"] = association.GlobalId;                    graphic.Attributes["AssociationType"] = association.AssociationType.ToString();                    _associationsOverlay.Graphics.Add(graphic);                }            }
// This is thrown when there are too many associations in the extent. catch (TooManyAssociationsException) { } catch (Exception ex) { MessageBox.Show(ex.Message, ex.GetType().Name, MessageBoxButton.OK, MessageBoxImage.Error); } } }}<UserControl x:Class="ArcGIS.WPF.Samples.DisplayUtilityAssociations.DisplayUtilityAssociations" xmlns="http://schemas.microsoft.com/winfx/2006/xaml/presentation" xmlns:x="http://schemas.microsoft.com/winfx/2006/xaml" xmlns:esri="http://schemas.esri.com/arcgis/runtime/2013"> <UserControl.Resources> <DataTemplate x:Key="AssociationLegendItemTemplate"> <Grid> <Grid.ColumnDefinitions> <ColumnDefinition Width="30" /> <ColumnDefinition Width="*" /> </Grid.ColumnDefinitions> <Image Width="25" Height="25" Source="{Binding Value}" /> <TextBlock Grid.Column="1" Text="{Binding Key}" /> </Grid> </DataTemplate> </UserControl.Resources> <Grid> <esri:MapView x:Name="MyMapView" NavigationCompleted="OnNavigationCompleted" /> <Border Style="{StaticResource BorderStyle}"> <StackPanel> <Label Margin="5" Content="Utility association types" /> <ListView x:Name="AssociationLegend" Margin="5" IsHitTestVisible="False" ItemTemplate="{StaticResource AssociationLegendItemTemplate}" /> </StackPanel> </Border> </Grid></UserControl>