Introduction
Now we have learned about Network Datasets and Network Analysis Services, and how to find routes from one point to another, and among multiple points, let's move onto the third topic - how to generate Service Area. Please refer to the road map below if you want to revisit the previous topics or jump to the next topic -
- Network Dataset and Network Analysis services Part 1
- Find Routes Part 2
- Generate Service Area (You are here!)
- Find Closest Facility Part 3
- Generate Origin Destination Cost Matrix Part 5
- Solve Location Allocation Part 6
- Vehicle Routing Problem Service Part 7
This part of guide to Networking Analysis will help you find out what's occurring within a set distance of a feature, or what's within traveling range (measured using distance, time, or cost), and bring you these benefits (1):
- allow you to identify the area - and the features inside the area - affected by an event or activity. For instance, a city planner needs to notify residents within 500 feet of a proposed liquor store of its forthcoming.
- let you monitor activities in the area. For instance, staff working at state forestry department needs to monitor logging that should not happen within 100 meters buffer along streams.
- help define the area served by a facility. For example, the chief of fire department wants to know which streets are within 3-minute drive of a fire station, and/or a GIS analyst in search of a good retail store location wants to find out how many people live within a 15-minute drive of a proposed store location.
- help delineate areas that are suitable for/capable of supporting a specific use. Take a wildlife biologist as an example, he/she might need to map the area within a half-mile of streams combined with vegetation type, slope, and other factors that could be used to identify prime deer habitats.
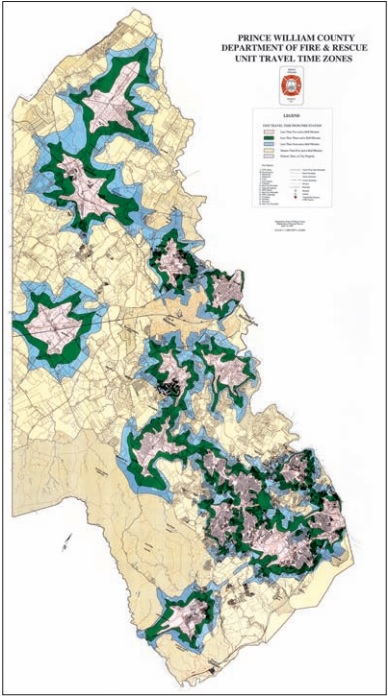
Fig 1. The department of fire and rescue in Prince William County , VA, mapped areas within 5, 10, and 15 minutes of drive to fire stations, in order to help decide where to build new stations (1).
To find what's nearby, the first step is to decide how to measure the "nearness". You can measure by straight-line distance, distance or cost over a network, or cost over a surface (1).
- When what's nearby is defined by
straight-line distance, you need to specify the source feature and the distance, then the ArcGIS API for Python finds the area or the surrounding features within the distance. This approach is good for creating a boundary or selecting features at a set distance around a source (as shown in Fig 2(L)). - When what's nearby is defined by
distance or cost over a network, you need to specify the source locations and a distance (or travel cost) along each linear feature, then the API finds which segments of the network are within the distance/cost. This approach is good for finding what's within a travel distance or cost of a location, over a fixed network (as shown in Fig 2(M)). - When what's nearby is defined by
cost over a surface, you need to specify the location of the source features and a travel cost, then the API creates a new layer showing the travel cost from each source feature. This approach is good for calculating overland travel cost (as shown in Fig 2(R)).
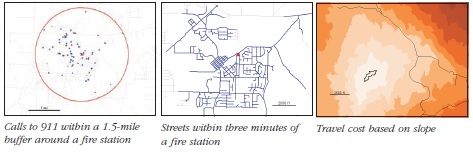
Fig 2. (Left) Creates a buffer by straight-line distance measurement; (Middle) Calculates distance or cost over a network; (Right) Uses the travel cost map based on slopes from source to destinations (1).
Service areas are commonly used to visualize and measure accessibility. For example, a three-minute, drive-time polygon around a grocery store can determine which residents are able to reach the store within three minutes and are thus more likely to shop there (2). Service areas also help evaluate accessibility. Concentric service areas show how accessibility varies. Once service areas are created, you can use them to identify how much land, how many people, or how much of anything else is within the neighborhood or region. Service area solver provides functionality for finding out how far a vehicle could go within a specified time or distance limit.
Now that we have learned why generating service area is needed, and the basis of measuring the nearness, it is time to play with some code!
Data
The first step to everything is always importing all required modules and establishing a GIS connection to ArcGIS Online organization or your enterprise for ArcGIS.
If you have already set up a profile to connect to your ArcGIS Online organization, execute the cell below to load the profile and create the GIS class object. If not, use a traditional username/password log-in e.g. my_gis = GIS('https://www.arcgis.com', 'username', 'password', verify_cert=False, set_active=True)
from arcgis.gis import GIS
import arcgis.network as network
from arcgis.features import FeatureLayer, Feature, FeatureSet, use_proximity
import pandas as pd
import datetime as dt
import time
my_gis = GIS('home')Define Facilities Layer
If you do not have access to the hospital layer provided by Esri_livingatlas as referenced in the cell below, an alternative approach is for you to download the hospital listing of San Bernadino County from this source and publish the csv to the organization before proceeding forward.
""" This try-except block will help you download the CSV and publish to current GIS object, if
    "You do not have permissions to access this resource or perform this operation."
"""
try:
    hospital_item = my_gis.content.get("a2817bf9632a43f5ad1c6b0c153b0fab")
except RuntimeError as ne:
    try:
        print("Trying from an alternative source...")
        hospital_item = my_gis.content.get("50fb63f303304835a048d16bd86c3024")
    except RuntimeError as ne:
        print("Trying to publish from csv...")
        import requests
        import csv
        import os

        out_file_name = 'hospitals_SB_county.csv'
        url = "https://data.chhs.ca.gov/datastore/dump/641c5557-7d65-4379-8fea-6b7dedbda40b?q=&sort=_id+asc&fields=OSHPD_ID%2CFACILITY_NAME%2CLICENSE_NUM%2CFACILITY_LEVEL_DESC%2CDBA_ADDRESS1%2CDBA_CITY%2CDBA_ZIP_CODE%2CCOUNTY_CODE%2CCOUNTY_NAME%2CER_SERVICE_LEVEL_DESC%2CTOTAL_NUMBER_BEDS%2CFACILITY_STATUS_DESC%2CFACILITY_STATUS_DATE%2CLICENSE_TYPE_DESC%2CLICENSE_CATEGORY_DESC%2CLATITUDE%2CLONGITUDE&filters=%7B%22COUNTY_CODE%22%3A+%5B%2236%22%5D%7D&format=csv"
        download = requests.get(url)

        with open(out_file_name, 'w') as out_file:
            out_file.writelines(download.text)
            print(out_file_name)
        csv_item = my_gis.content.add({}, out_file_name)
        hospital_item = csv_item.publish()
display(hospital_item)
You do not have permissions to access this resource or perform this operation.
Trying from an alternative source...

From the Feature Layer item, we would derive the url of its first Feature Service, and create into a Feature Layer class object, which will then be used to make queries.
hospital_fl = FeatureLayer(hospital_item.url + "/0")
hospital_fl
<FeatureLayer url:"https://services7.arcgis.com/JEwYeAy2cc8qOe3o/arcgis/rest/services/hospitals_SB_county/FeatureServer/0">
""" If you are using the exisiting layer from Esri_LivngAtlas, there is a "County" column in the dataset;
    or else, the feature layer collection published from the downloaded CSV file is already targetted at SB County.
"""
try:
    facilities = hospital_fl.query(where="County='SAN BERNARDINO' AND State='CA'", as_df=False)
except RuntimeError as re:
    """ when seeing 'Invalid field: County' parameter is invalid
    """
    print("Trying from an alternative approach...")
    facilities = hospital_fl.query(where="Dba_city='REDLANDS' or Dba_city='LOMA LINDA'", as_df=False)
display(facilities)
'Invalid field: County' parameter is invalid
Trying from an alternative approach...
<FeatureSet> 33 features
If the procedures all go well, you will be seeing a facilities object of a FeatureSet that contains 33 features. With such, we can draw the output FeatureSet with customized symbology in the map widget below.
map1 = my_gis.map('SAN BERNARDINO, CA', zoomlevel=12)
map1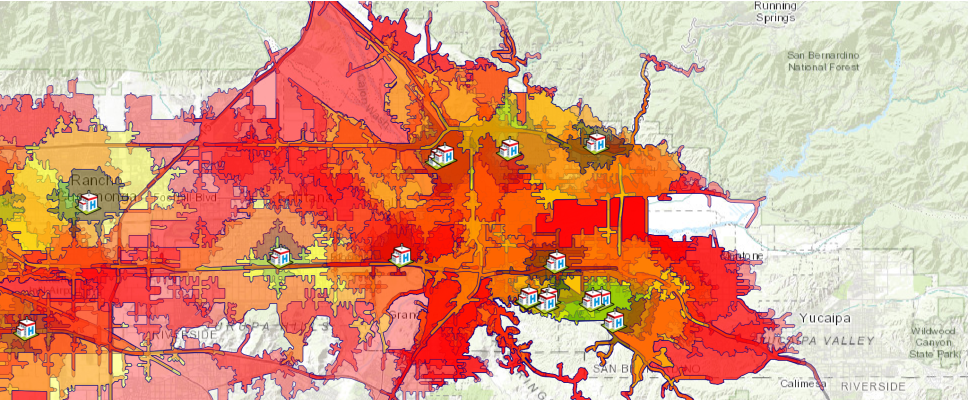
hospital_symbol = {"type":"esriPMS",
                   "url":"http://static.arcgis.com/images/Symbols/SafetyHealth/Hospital.png",
                   "contentType": "image/png", "width":20, "height":20}

map1.draw(facilities, symbol=hospital_symbol)
Methods
The ArcGIS API for Python provides three ways to solve a service area generation problem, which are namely, ServiceAreaLayer.solve, generate_service_areas, and create_drive_time_areas.
| Operation | network.analysis | features.use_proximity |
|---|---|---|
| Route | find_routes | plan_routes |
| ServiceArea | generate_service_areas | create_drive_time_areas |
| ClosestFacility | find_closest_facilities | find_nearest |
These three methods are defined in different modules of the arcgis package, and will make distinct REST calls in the back end. A key distinction between ServiceAreaLayer.solve and generate_service_areas, create_drive_time_areas is, the former is meant for custom or advanced service area creating workflows where you need to publish your own Network Analysis layers. The latter tools work against service are generation services hosted on ArcGIS Online or available on your Enterprise via proxy services and will cost you credits.
In this part of guide, we will walk through the workflows of using network.analysis.generate_service_areas() and features.use_proximity.create_drive_time_areas() in solving the same problem - creating service areas for facilities defined as hospitals here, and further explore the differences in the process.
Method 1 - using arcgis.network.analysis.generate_service_areas
The generate_service_areas tool determines network service areas around facilities. A network service area is a region that encompasses all streets that can be accessed within a given distance or travel time from one or more facilities. For instance, the 10-minute service area for a facility includes all the streets that can be reached within 10 minutes from that facility. Service areas are commonly used to visualize and measure accessibility. For example, a three-minute drive-time polygon around a grocery store can determine which residents are able to reach the store within three minutes and are thus more likely to shop there. Parameters used in the example below include:
facilities: Facilities (FeatureSet). Required parameter. The facilities around which service areas are generated.break_values: Break Values (str). Required parameter. Specifies the size and number of service area polygons to generate for each facilitybreak_units: Break Units (str). Required parameter. The unit for the Break Values parameter.time_of_day: Time of Day (datetime). Optional parameter. The time to depart from or arrive at the facilities.
For more information, please refer to the API help doc.
list_of_breaks = [5,10,15]
if isinstance(list_of_breaks, list):
    string_of_breaks = ' '.join(map(str, list_of_breaks))
    print(string_of_breaks)
5 10 15
%%time

current_time = dt.datetime.now()

result1 = network.analysis.generate_service_areas(facilities=facilities, break_values=string_of_breaks,
                                                  break_units="Minutes", time_of_day=current_time)
Wall time: 22.3 s
print("Is the tool finished successfully?", result1.solve_succeeded)Is the tool finished successfully? True
result1ToolOutput(service_areas=<FeatureSet> 99 features, solve_succeeded=True, output_network_analysis_layer=None, output_facilities=<FeatureSet> 33 features, output_service_area_lines=<FeatureSet> 0 features, output_result_file=None)
As shown above, the output result1 is of type arcgis.geoprocessing._support.ToolOutput that contains multiple components, e.g. service_areas, output_facilities and output_service_area_lines are FeatureSet objects which will be further explored in the following:
Tabularizing the response from generate_service_area
We can read the service_areas component of the returned object as DataFrame:
cols = ['FromBreak', 'ToBreak', 'COUNTY_CODE', 'COUNTY_NAME', 'DBA_ADDRESS1', 'DBA_CITY',  \
        'DBA_ZIP_CODE', 'FACILITY_LEVEL_DESC', 'FACILITY_NAME', 'FACILITY_STATUS_DATE', 'FACILITY_STATUS_DESC', \
        'LICENSE_CATEGORY_DESC', 'LICENSE_NUM', 'LICENSE_TYPE_DESC', 'Name', \
        'OSHPD_ID', 'TOTAL_NUMBER_BEDS']
df = result1.service_areas.sdf[cols]
df.sort_values('FromBreak', inplace=True, ascending=True)
df.head()| FromBreak | ToBreak | COUNTY_CODE | COUNTY_NAME | DBA_ADDRESS1 | DBA_CITY | DBA_ZIP_CODE | FACILITY_LEVEL_DESC | FACILITY_NAME | FACILITY_STATUS_DATE | FACILITY_STATUS_DESC | LICENSE_CATEGORY_DESC | LICENSE_NUM | LICENSE_TYPE_DESC | Name | OSHPD_ID | TOTAL_NUMBER_BEDS | |
|---|---|---|---|---|---|---|---|---|---|---|---|---|---|---|---|---|---|
| 98 | 0 | 5 | 36 | SAN BERNARDINO | 35 BLUE JAY LANE | REDLANDS | 92374 | Parent Facility | BLUE JAY MANOR, LLC | 2017-10-03 | Open | Congregate Living Health Facility | 550003969 | Long Term Care Facility | Location 10 : 0 - 5 | 206361004 | 6.0 |
| 77 | 0 | 5 | 36 | SAN BERNARDINO | 812 CONCORD LANE | REDLANDS | 92374 | Parent Facility | SERENE CONGREGATE LIVING, LLC | 2018-01-18 | Open | Congregate Living Health Facility | 550004194 | Long Term Care Facility | Location 9 : 0 - 5 | 206360023 | 6.0 |
| 20 | 0 | 5 | 36 | SAN BERNARDINO | 1710 BARTON ROAD | REDLANDS | 92373 | Parent Facility | LOMA LINDA UNIVERSITY BEHAVIORAL MEDICINE CENTER | 1988-01-16 | Open | Acute Psychiatric Hospital | 240000281 | Hospital | Location 5 : 0 - 5 | 106364014 | 89.0 |
| 56 | 0 | 5 | 36 | SAN BERNARDINO | 1620 WEST FERN AVENUE | REDLANDS | 92373 | Parent Facility | REDLANDS HEALTHCARE CENTER | 1966-04-25 | Open | Skilled Nursing Facility | 240000211 | Long Term Care Facility | Location 16 : 0 - 5 | 206361351 | 78.0 |
| 74 | 0 | 5 | 36 | SAN BERNARDINO | 42 WEST HILTON AVENUE | REDLANDS | 92373 | Parent Facility | HILTON MANOR, LLC | 2016-11-10 | Open | Congregate Living Health Facility | 550003708 | Long Term Care Facility | Location 19 : 0 - 5 | 206364580 | 6.0 |
df.tail()| FromBreak | ToBreak | COUNTY_CODE | COUNTY_NAME | DBA_ADDRESS1 | DBA_CITY | DBA_ZIP_CODE | FACILITY_LEVEL_DESC | FACILITY_NAME | FACILITY_STATUS_DATE | FACILITY_STATUS_DESC | LICENSE_CATEGORY_DESC | LICENSE_NUM | LICENSE_TYPE_DESC | Name | OSHPD_ID | TOTAL_NUMBER_BEDS | |
|---|---|---|---|---|---|---|---|---|---|---|---|---|---|---|---|---|---|
| 21 | 10 | 15 | 36 | SAN BERNARDINO | 1720 MOUNTAIN VIEW AVE | LOMA LINDA | 92354 | Parent Facility | TOTALLY KIDS REHABILITATION HOSPITAL | 2014-06-20 | Open | General Acute Care Hospital | 550002720 | Hospital | Location 7 : 10 - 15 | 106364451 | 81.0 |
| 57 | 10 | 15 | 36 | SAN BERNARDINO | 1618 LAUREL AVENUE | REDLANDS | 92373 | Parent Facility | TERRACINA POST ACUTE | 1989-03-16 | Open | Skilled Nursing Facility | 240000307 | Long Term Care Facility | Location 17 : 10 - 15 | 206364036 | 243.0 |
| 78 | 10 | 15 | 36 | SAN BERNARDINO | 819 SALEM DRIVE | REDLANDS | 92373 | Parent Facility | PLYMOUTH VILLAGE | 1968-03-24 | Open | Skilled Nursing Facility | 240000189 | Long Term Care Facility | Location 15 : 10 - 15 | 206361301 | 48.0 |
| 72 | 10 | 15 | 36 | SAN BERNARDINO | 42 WEST HILTON AVENUE | REDLANDS | 92373 | Parent Facility | HILTON MANOR, LLC | 2016-11-10 | Open | Congregate Living Health Facility | 550003708 | Long Term Care Facility | Location 19 : 10 - 15 | 206364580 | 6.0 |
| 0 | 10 | 15 | 36 | SAN BERNARDINO | 26780 BARTON ROAD | REDLANDS | 92373 | Consolidated Facility | LOMA LINDA UNIVERSITY SURGICAL HOSPITAL | 2009-01-02 | Open | General Acute Care Hospital | 240000169 | Hospital | Location 6 : 10 - 15 | 106364268 | 28.0 |
Visualizing the response from generate_service_area
The service area at these breaks for each hospitals can then be rendered as rings on the map widget.
map3 = my_gis.map('SAN BERNARDINO, CA', zoomlevel=12)
map3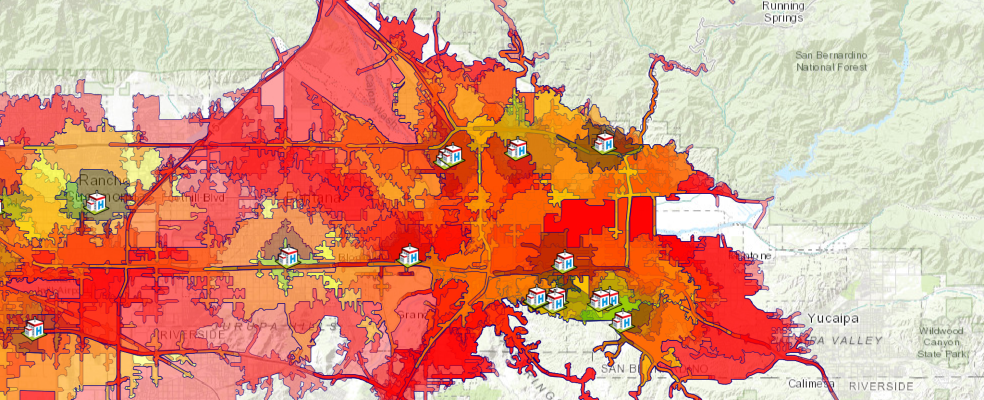
colors = {5: [0, 128, 0, 90],
          10: [255, 255, 0, 90],
          15: [255, 0, 0, 90]}

fill_symbol = {"type": "esriSFS","style": "esriSFSSolid",
               "color": [115,76,0,255],
               "outline":{"color":[0,0,128,255],"width":0.25,"type":"esriSLS","style":"esriSLSSolid"}}
map3.clear_graphics()
for service_area in result1.service_areas.features:
#set color based on drive time
fill_symbol['color'] = colors[service_area.attributes['ToBreak']]
#set popup
popup={"title": "Service area",
"content": "{} minutes".format(service_area.attributes['ToBreak'])}
#draw service area
map3.draw(service_area.geometry, symbol=fill_symbol, popup=popup,
attributes={"title": service_area.attributes['Name']})
map3.draw(facilities, symbol=hospital_symbol)item_properties = {
"title": "Hospital Service Areas of San Bernadino County (2)",
"tags" : "Service area",
"snippet": " Hospital Service Areas of San Bernadino County",
"description": "a web map of Hospital Service Areas of San Bernadino County"
}
item = map3.save(item_properties)
item
Constructing service areas for different times of the day
Now, let's expand the topic to an advanced level, by looking at a slightly more complicated application of generating service area. Traffic conditions tend to be varied for rush hours, day time and evening, it is essential that the Emergency Response Center makes sure the ambulance can also get to the patient at the earliest convenience. Instead of solving the problem based on a specified time of a day, let's construct the service areas for different times of the day, for instance, at 6AM, 10AM, 14PM, 18PM, 22PM, respectively.
Instead of looking at the service areas of all 33 hospitals in the area, we will just pick one of the hospitals and construct service areas for this single facility.
Also note that, we are changing the breaks from [5,10,15] to [3,9,15] here.
times = [dt.datetime(2017, 6, 10, h).timestamp() * 1000
         for h in [6, 10, 14, 18, 22]]

# Hospital location (Pick one from Loma Linda) 34.048967, -117.220557
hospital = '-117.220557, 34.048967'

#loop through each time of the day and compute the service area
sa_results = []
for daytime in times:
    result = network.analysis.generate_service_areas(facilities=facilities, break_values='3 9 15',
                                                     break_units="Minutes", time_of_day=daytime)
    sa_results.append(result)
Loma_linda_fset_list=[]
for result in sa_results:
Loma_linda_fset_list.append(result.service_areas)map2= my_gis.map("Loma Linda, CA")
map2
colors1 = {0: [255, 255, 128, 90],
          1: [128, 0, 128, 90],
          2: [0, 128, 0, 90],
          3: [255, 255, 0, 90],
          4: [255, 0, 0, 90]}

fill_symbol1 = {"type": "esriSFS","style": "esriSFSSolid",
               "color": [115,76,0,255],
               "outline":{"color":[0,0,128,255],"width":0.25,"type":"esriSLS","style":"esriSLSSolid"}}
map2.clear_graphics()
times = ['6 am', '10 am', '2 pm', '6 pm', '10 pm']
j=0
time.sleep(2)
for fset in Loma_linda_fset_list:
print(times[j])
fill_symbol1['color'] = colors1[j]
map2.draw(fset, symbol=fill_symbol1)
j+=1
time.sleep(1)6 am 10 am 2 pm 6 pm 10 pm
We have been using the generate_service_areas tool in the network.analysis module up to this point. From now on, let's use a different method - create_service_areas - defined in the features.use_proximity module, to achieve a workflow driven, Feature Service to Feature Service user experience.
Method 2 - using arcgis.features.use_proximity.create_drive_time_areas
The create_drive_time_areas method creates areas that can be reached within a given drive time or drive distance. It can help you answer questions such as:
- How far can I drive from here in five minutes?
- What areas are covered within a three-mile drive distance of my stores?
- What areas are within four minutes of our fire stations?
Parameters to be used in the following examples include:
input_layer: Required point feature layer. The points around which travel areas based on a mode of transportation will be drawnbreak_values: Optional list of floats. The size of the polygons to create. The units for break_values is specified with the break_units parameter.time_of_day: Optional datetime.datetime. Specify whether travel times should consider traffic conditions.context: Optional dict. Context contains additional settings that affect task execution. For create_drive_time_areas, there are two settings - extent and outSR.output_name: Optional string. Output feature service name. If not provided, a feature collection is returned.
In the following, we will explore the two approaches - with output_name specified, and without.
With output_name specified
When you have specified the output_name in the input parameters, the returned value from create_drive_time_areas is a feature layer collection.
"""If you are referencing the feature layer collection published from downloaded CSV
"""
hospital_layer = {'url': hospital_fl.url,
                  'filter': "Dba_city='REDLANDS' or Dba_city='Loma Linda'"}

result2 = use_proximity.create_drive_time_areas(input_layer=hospital_layer, break_values=list_of_breaks,
                                                time_of_day = current_time,
                                                context={'outSR': {"wkid": 4326}},
                                                output_name="Create Service Area from Hospitals in SB County 2")
result2
A FeatureLayer object can be created from the item listed above, and hence we can make queries to it and get back a DataFrame object if as_df set to True.
service_area_sublayer = FeatureLayer.fromitem(result2, layer_id=0)
service_area_sublayer.url
'https://<your organization>/arcgis/rest/services/Create Service Area from Hospitals in SB County 2/FeatureServer/0'
sa_df = service_area_sublayer.query(where='1=1', as_df=True)[cols]
sa_df.sort_values('FromBreak', inplace=True, ascending=True)
sa_df.head()| FromBreak | ToBreak | COUNTY_CODE | COUNTY_NAME | DBA_ADDRESS1 | DBA_CITY | DBA_ZIP_CODE | FACILITY_LEVEL_DESC | FACILITY_NAME | FACILITY_STATUS_DATE | FACILITY_STATUS_DESC | LICENSE_CATEGORY_DESC | LICENSE_NUM | LICENSE_TYPE_DESC | Name | OSHPD_ID | TOTAL_NUMBER_BEDS | |
|---|---|---|---|---|---|---|---|---|---|---|---|---|---|---|---|---|---|
| 98 | 0 | 5 | 36 | SAN BERNARDINO | 35 BLUE JAY LANE | REDLANDS | 92374 | Parent Facility | BLUE JAY MANOR, LLC | 2017-10-03 | Open | Congregate Living Health Facility | 550003969 | Long Term Care Facility | Location 10 : 0 - 5 | 206361004 | 6.0 |
| 77 | 0 | 5 | 36 | SAN BERNARDINO | 812 CONCORD LANE | REDLANDS | 92374 | Parent Facility | SERENE CONGREGATE LIVING, LLC | 2018-01-18 | Open | Congregate Living Health Facility | 550004194 | Long Term Care Facility | Location 9 : 0 - 5 | 206360023 | 6.0 |
| 20 | 0 | 5 | 36 | SAN BERNARDINO | 1710 BARTON ROAD | REDLANDS | 92373 | Parent Facility | LOMA LINDA UNIVERSITY BEHAVIORAL MEDICINE CENTER | 1988-01-16 | Open | Acute Psychiatric Hospital | 240000281 | Hospital | Location 5 : 0 - 5 | 106364014 | 89.0 |
| 56 | 0 | 5 | 36 | SAN BERNARDINO | 1620 WEST FERN AVENUE | REDLANDS | 92373 | Parent Facility | REDLANDS HEALTHCARE CENTER | 1966-04-25 | Open | Skilled Nursing Facility | 240000211 | Long Term Care Facility | Location 16 : 0 - 5 | 206361351 | 78.0 |
| 74 | 0 | 5 | 36 | SAN BERNARDINO | 42 WEST HILTON AVENUE | REDLANDS | 92373 | Parent Facility | HILTON MANOR, LLC | 2016-11-10 | Open | Congregate Living Health Facility | 550003708 | Long Term Care Facility | Location 19 : 0 - 5 | 206364580 | 6.0 |
sa_df.tail()| FromBreak | ToBreak | COUNTY_CODE | COUNTY_NAME | DBA_ADDRESS1 | DBA_CITY | DBA_ZIP_CODE | FACILITY_LEVEL_DESC | FACILITY_NAME | FACILITY_STATUS_DATE | FACILITY_STATUS_DESC | LICENSE_CATEGORY_DESC | LICENSE_NUM | LICENSE_TYPE_DESC | Name | OSHPD_ID | TOTAL_NUMBER_BEDS | |
|---|---|---|---|---|---|---|---|---|---|---|---|---|---|---|---|---|---|
| 21 | 10 | 15 | 36 | SAN BERNARDINO | 1720 MOUNTAIN VIEW AVE | LOMA LINDA | 92354 | Parent Facility | TOTALLY KIDS REHABILITATION HOSPITAL | 2014-06-20 | Open | General Acute Care Hospital | 550002720 | Hospital | Location 7 : 10 - 15 | 106364451 | 81.0 |
| 57 | 10 | 15 | 36 | SAN BERNARDINO | 1618 LAUREL AVENUE | REDLANDS | 92373 | Parent Facility | TERRACINA POST ACUTE | 1989-03-16 | Open | Skilled Nursing Facility | 240000307 | Long Term Care Facility | Location 17 : 10 - 15 | 206364036 | 243.0 |
| 78 | 10 | 15 | 36 | SAN BERNARDINO | 819 SALEM DRIVE | REDLANDS | 92373 | Parent Facility | PLYMOUTH VILLAGE | 1968-03-24 | Open | Skilled Nursing Facility | 240000189 | Long Term Care Facility | Location 15 : 10 - 15 | 206361301 | 48.0 |
| 72 | 10 | 15 | 36 | SAN BERNARDINO | 42 WEST HILTON AVENUE | REDLANDS | 92373 | Parent Facility | HILTON MANOR, LLC | 2016-11-10 | Open | Congregate Living Health Facility | 550003708 | Long Term Care Facility | Location 19 : 10 - 15 | 206364580 | 6.0 |
| 0 | 10 | 15 | 36 | SAN BERNARDINO | 26780 BARTON ROAD | REDLANDS | 92373 | Consolidated Facility | LOMA LINDA UNIVERSITY SURGICAL HOSPITAL | 2009-01-02 | Open | General Acute Care Hospital | 240000169 | Hospital | Location 6 : 10 - 15 | 106364268 | 28.0 |
Not only can we tabularize the result, but we can also render the output Feature Service on to the map widget (as below).
map4a = my_gis.map('SAN BERNARDINO, CA', zoomlevel=12)
map4a
map4a.add_layer(result2)This concludes the workflow of Feature Service (as input) to Feature Service (as output) user experience. Next, let's use the same use_proximity.create_drive_time_areas but without the output_name specified, from which a FeatureCollection will be returned (instead of a Feature Service).
Without output_name specified
When you have not specified the output_name in the input parameters, the returned value from create_drive_time_areas is a FeatureCollection object, and detailed parsing needs to be done in order to get the information on demand.
%%time

result2b = use_proximity.create_drive_time_areas(input_layer=hospital_layer, break_values=list_of_breaks,
                                                time_of_day = current_time,
                                                context={'outSR': {"wkid": 4326}})
Wall time: 50.6 s
result2b, result2b.query()(<FeatureCollection>, <FeatureSet> 99 features)
Tabularizing the response from create_drive_time_areas
We can create a DataFrame out of the features contained in the returned FeatureCollection object.
df2 = result2b.query().sdf[cols]
df2.sort_values('FromBreak', inplace=True, ascending=True)
df2.head()| FromBreak | ToBreak | COUNTY_CODE | COUNTY_NAME | DBA_ADDRESS1 | DBA_CITY | DBA_ZIP_CODE | FACILITY_LEVEL_DESC | FACILITY_NAME | FACILITY_STATUS_DATE | FACILITY_STATUS_DESC | LICENSE_CATEGORY_DESC | LICENSE_NUM | LICENSE_TYPE_DESC | Name | OSHPD_ID | TOTAL_NUMBER_BEDS | |
|---|---|---|---|---|---|---|---|---|---|---|---|---|---|---|---|---|---|
| 98 | 0 | 5 | 36 | SAN BERNARDINO | 35 BLUE JAY LANE | REDLANDS | 92374 | Parent Facility | BLUE JAY MANOR, LLC | 2017-10-03 | Open | Congregate Living Health Facility | 550003969 | Long Term Care Facility | Location 10 : 0 - 5 | 206361004 | 6.0 |
| 77 | 0 | 5 | 36 | SAN BERNARDINO | 812 CONCORD LANE | REDLANDS | 92374 | Parent Facility | SERENE CONGREGATE LIVING, LLC | 2018-01-18 | Open | Congregate Living Health Facility | 550004194 | Long Term Care Facility | Location 9 : 0 - 5 | 206360023 | 6.0 |
| 20 | 0 | 5 | 36 | SAN BERNARDINO | 1710 BARTON ROAD | REDLANDS | 92373 | Parent Facility | LOMA LINDA UNIVERSITY BEHAVIORAL MEDICINE CENTER | 1988-01-16 | Open | Acute Psychiatric Hospital | 240000281 | Hospital | Location 5 : 0 - 5 | 106364014 | 89.0 |
| 56 | 0 | 5 | 36 | SAN BERNARDINO | 1620 WEST FERN AVENUE | REDLANDS | 92373 | Parent Facility | REDLANDS HEALTHCARE CENTER | 1966-04-25 | Open | Skilled Nursing Facility | 240000211 | Long Term Care Facility | Location 16 : 0 - 5 | 206361351 | 78.0 |
| 74 | 0 | 5 | 36 | SAN BERNARDINO | 42 WEST HILTON AVENUE | REDLANDS | 92373 | Parent Facility | HILTON MANOR, LLC | 2016-11-10 | Open | Congregate Living Health Facility | 550003708 | Long Term Care Facility | Location 19 : 0 - 5 | 206364580 | 6.0 |
df2.tail()| FromBreak | ToBreak | COUNTY_CODE | COUNTY_NAME | DBA_ADDRESS1 | DBA_CITY | DBA_ZIP_CODE | FACILITY_LEVEL_DESC | FACILITY_NAME | FACILITY_STATUS_DATE | FACILITY_STATUS_DESC | LICENSE_CATEGORY_DESC | LICENSE_NUM | LICENSE_TYPE_DESC | Name | OSHPD_ID | TOTAL_NUMBER_BEDS | |
|---|---|---|---|---|---|---|---|---|---|---|---|---|---|---|---|---|---|
| 21 | 10 | 15 | 36 | SAN BERNARDINO | 1720 MOUNTAIN VIEW AVE | LOMA LINDA | 92354 | Parent Facility | TOTALLY KIDS REHABILITATION HOSPITAL | 2014-06-20 | Open | General Acute Care Hospital | 550002720 | Hospital | Location 7 : 10 - 15 | 106364451 | 81.0 |
| 57 | 10 | 15 | 36 | SAN BERNARDINO | 1618 LAUREL AVENUE | REDLANDS | 92373 | Parent Facility | TERRACINA POST ACUTE | 1989-03-16 | Open | Skilled Nursing Facility | 240000307 | Long Term Care Facility | Location 17 : 10 - 15 | 206364036 | 243.0 |
| 78 | 10 | 15 | 36 | SAN BERNARDINO | 819 SALEM DRIVE | REDLANDS | 92373 | Parent Facility | PLYMOUTH VILLAGE | 1968-03-24 | Open | Skilled Nursing Facility | 240000189 | Long Term Care Facility | Location 15 : 10 - 15 | 206361301 | 48.0 |
| 72 | 10 | 15 | 36 | SAN BERNARDINO | 42 WEST HILTON AVENUE | REDLANDS | 92373 | Parent Facility | HILTON MANOR, LLC | 2016-11-10 | Open | Congregate Living Health Facility | 550003708 | Long Term Care Facility | Location 19 : 10 - 15 | 206364580 | 6.0 |
| 0 | 10 | 15 | 36 | SAN BERNARDINO | 26780 BARTON ROAD | REDLANDS | 92373 | Consolidated Facility | LOMA LINDA UNIVERSITY SURGICAL HOSPITAL | 2009-01-02 | Open | General Acute Care Hospital | 240000169 | Hospital | Location 6 : 10 - 15 | 106364268 | 28.0 |
Visualizing the response from create_drive_time_areas
For service area features contained in result2b, we can assign different colors to each service area based on their ToBreak value, and render a map of service areas from closer proximity to farther coverage.
map4 = my_gis.map('SAN BERNARDINO, CA', zoomlevel=12)
map4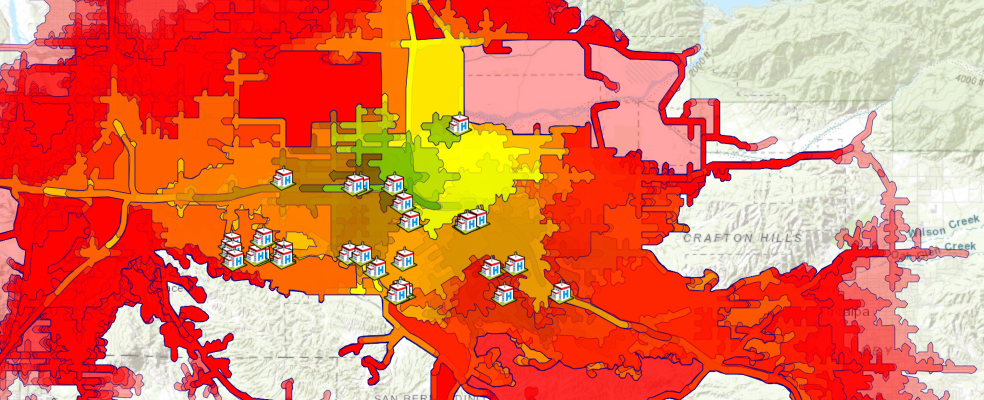
Also customize the symbologies for the service areas and the facilities:
colors = {5: [0, 128, 0, 90],
          10: [255, 255, 0, 90],
          15: [255, 0, 0, 90]}

fill_symbol = {"type": "esriSFS","style": "esriSFSSolid",
               "color": [115,76,0,255],
               "outline":{"color":[0,0,128,255],"width":0.25,"type":"esriSLS","style":"esriSLSSolid"}}

hospital_symbol = {"type":"esriPMS",
                   "url":"http://static.arcgis.com/images/Symbols/SafetyHealth/Hospital.png",
                   "contentType": "image/png", "width":20, "height":20}
service_area_fset = result2b.query()
for f in service_area_fset.features:
#set color based on drive time
fill_symbol['color'] = colors[f.attributes['ToBreak']]
#set popup
popup={"title": "Service area",
"content": "{} minutes".format(f.attributes['ToBreak'])}
#draw service area
map4.draw(f.geometry, symbol=fill_symbol, popup=popup,
attributes={"title": service_area.attributes['Name']})
# draw hospitals
map4.draw(facilities, symbol=hospital_symbol)The service areas and the facilities shall be successfully rendered on map4 now. Also, if you would like to save the map view as a web map, execute the following cell:
item_properties["title"] = "Hospital Service Areas of San Bernadino County (3)"
item = map4.save(item_properties)
itemIn the last section of this guide, we have adopted a different method - arcgis.features.use_proximity.create_drive_time_areas - in generating service areas from facilities to areas accessible with a given time break. In doing so, we also explored the two scenarios with output_name specified (which forms a Feature Service to Feature Service user experience), and a more traditional compute/parse/draw approach when output_name is not present.
What's next?
Part 3 has introduced arcgis.network.analysis.generate_service_areas and arcgis.features.use_proximity.create_drive_time_areas as solvers to the service area creating problem, how to prepare for data required as input arguments by these solvers, and ways to tabularize, map, and the save the output from solvers.
Now that we have mastered techniques in generating service areas, let's proceed to the next topic - finding closest facilities with network.analysis and features.use_proximity modules in Part 4
References
[1] Andy Mitchell, "The ESRI Guide to GIS Analysis, Volume 1: Geographic patterns & relationships", Esri Press, August 1999
[2] "Generate Service Areas", http://desktop.arcgis.com/en/arcmap/10.3/tools/network-analyst-toolbox/generate-service-areas.htm, accessed on 09/16/2019
[3] "Make Service Area Layer", http://desktop.arcgis.com/en/arcmap/10.3/tools/network-analyst-toolbox/make-service-area-layer.htm, accessed on 09/16/2019