Learn how to access local data, such as spending trends, for the United States with the GeoEnrichment service
The GeoEnrichment service provides detailed local data for specific countries. Each individual data field is represented by an analysis variable
In this tutorial, you use the GeoEnrichment service to display spending trend information for a study area within the United States.
Steps
Import modules and log in
-
Import the
GISclass from thearcgis.gismodule. TheGISclass provides helper objects to manage (search, create, and manage) GIS resources such as content, users, and groups. Additionally, import theGeometryandPointclasses from thearcgis.geometrymodule, theFeatureclass fromSet arcgis.featuresmodule and theCountrymethod from thearcgis.geoenrichmentmodule.Use dark colors for code blocks from arcgis.gis import GIS from arcgis.features import FeatureSet from arcgis.geoenrichment import Country from arcgis.geometry import Geometry, Point -
Log in to your portal
ArcGIS portal, also known as a portal, is a website with applications and tools that can be used to create, manage, access, and share geospatial content and data. It supports security and authentication, developer credentials, content and data service management, user and group management, and site administration. A portal can be hosted in Esri's infrastructure or your own infrastructure. . In a hosted notebook, You can use thehomeparameter to use the credentials of the currently logged in account.Use dark colors for code blocks from arcgis.gis import GIS from arcgis.features import FeatureSet from arcgis.geoenrichment import Country from arcgis.geometry import Geometry, Point portal = GIS("home") print(f"Connected to {portal.properties.name} as {portal.properties.user.username}")
Create study area point
-
Use the
Pointclass to construct a point geometry by passing in the coordinatesA coordinate is a value that denotes the location of a vertex. Coordinates can represent 2D ( and spatial referencex,y) or 3D (x,y,z) space. The meaning of thex,y,zcoordinates are determined by a coordinate system.A spatial reference is a set of parameters, typically defined by a WKID, that define the coordinate system and spatial properties for geographic data. Applications use a spatial reference to correctly display the position of geographic data in a map or scene. representing a location in Nashville, Tennessee.Use dark colors for code blocks portal = GIS("home") print(f"Connected to {portal.properties.name} as {portal.properties.user.username}") study_area_pt = Point({"x": -86.7679, "y": 36.1745, "spatialReference": {"wkid": 4326}})
Get demographic data
-
Use the
Countryclass from thearcgis.geoenrichmentmodule. This provides access to local variables for a specific country. Pass in the study area point and the following variable names :PsychographicsShopping. M P28067 A _B transportation.X7027 _I entertainment.X9005 _I lifemodegroupsNE W. TLIFENAME
To learn more about the data collections and variables, go to Data Collections and GeoEnrichment coverage.
Use dark colors for code blocks study_area_pt = Point({"x": -86.7679, "y": 36.1745, "spatialReference": {"wkid": 4326}}) usa_data = Country("usa", portal) enrich_results = usa_data.enrich( study_areas=[study_area_pt], enrich_variables=[ "PsychographicsShopping.MP28067A_B", "transportation.X7027_I", "entertainment.X9005_I", "lifemodegroupsNEW.TLIFENAME", ], ) -
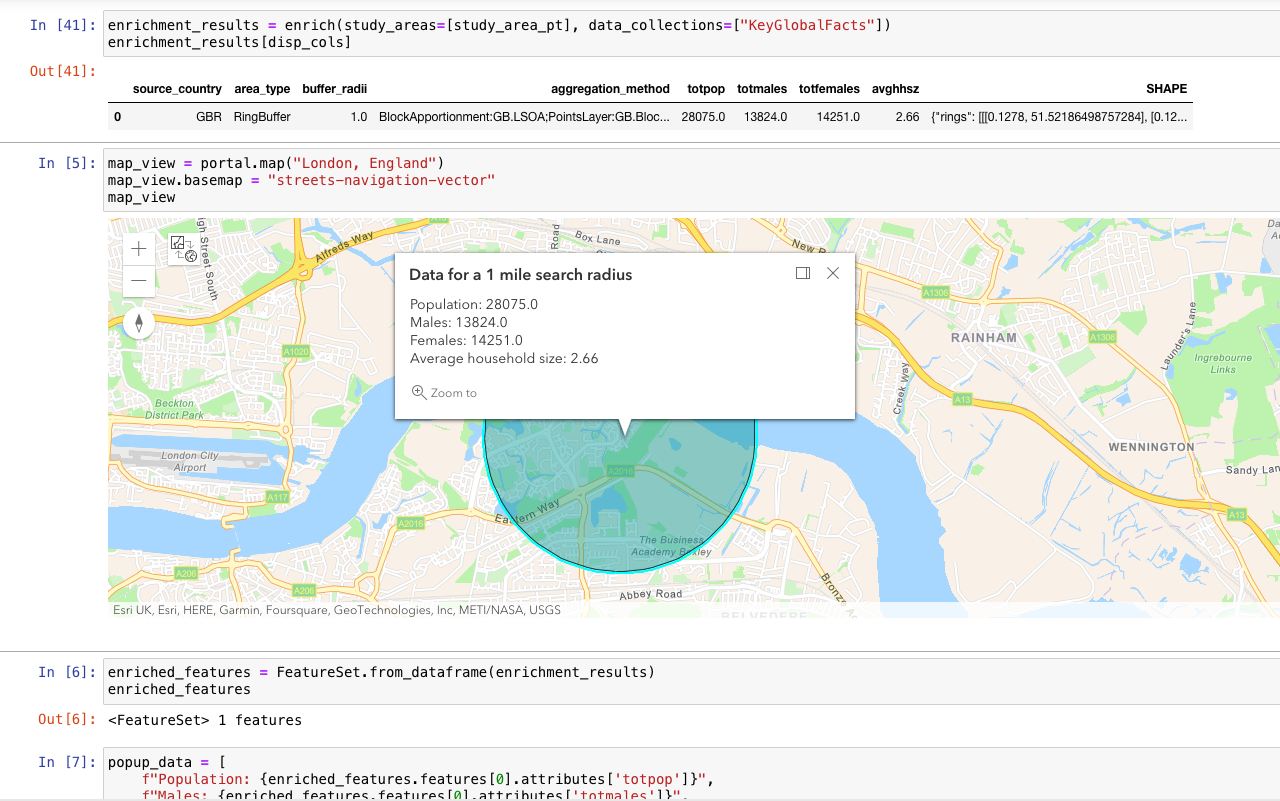
To view the values returned from the enrichment, use the
dataframeobject returned from theenrichmethod to display the results as a table. Pass in an array of field names to limit the results to a subset of columns.Use dark colors for code blocks usa_data = Country("usa", portal) enrich_results = usa_data.enrich( study_areas=[study_area_pt], enrich_variables=[ "PsychographicsShopping.MP28067A_B", "transportation.X7027_I", "entertainment.X9005_I", "lifemodegroupsNEW.TLIFENAME", ], ) display_cols = [ "aggregation_method", "population_to_polygon_size_rating", "apportionment_confidence", "tlifename", "x9005_i", "mp28067a_b", "x7027_i", ] enrich_results[display_cols]
Display the results on a map
-
Use the
mapproperty from theGISclass to create a map. To set the initial extent of the map, pass in the stringNashville, TNThis will set the map to an extent that is appropriate for the results. Set the basemap of the map toarcgis-navigation.Use dark colors for code blocks display_cols = [ "aggregation_method", "population_to_polygon_size_rating", "apportionment_confidence", "tlifename", "x9005_i", "mp28067a_b", "x7027_i", ] enrich_results[display_cols] map = portal.map("Nashville, TN") map.basemap.basemap = "arcgis-navigation" map -
Use the
Featureclass to convert the returned Pandas DataFrame into a feature setSet A feature set is an in-memory data structure that contains a collection of features. It is used by APIs such as ArcGIS Maps SDK for JavaScript, ArcGIS Arcade, and ArcGIS API for Python. . Create a popup object that will display formatted attribute values when a feature is clicked in the map.Use dark colors for code blocks map = portal.map("Nashville, TN") map.basemap.basemap = "arcgis-navigation" map enrich_features = FeatureSet.from_dataframe(enrich_results) enrich_features # set popup info from arcgis.map.popups import PopupInfo popup_fields = [ "Buys natural products: {mp28067a_b}", "Membership fees for Social Clubs: {x9005_i}", "Auto/Truck rental on trips: {x7027_i}", "Tapestry group name: {tlifename}", ] pi = PopupInfo( title="Data for a 1 mile search radius", description="<br>".join(popup_fields) ) -
Use the
addmethod to pass in the enriched geometry and popup info to add the results to the map content.Use dark colors for code blocks enrich_features = FeatureSet.from_dataframe(enrich_results) enrich_features # set popup info from arcgis.map.popups import PopupInfo popup_fields = [ "Buys natural products: {mp28067a_b}", "Membership fees for Social Clubs: {x9005_i}", "Auto/Truck rental on trips: {x7027_i}", "Tapestry group name: {tlifename}", ] pi = PopupInfo( title="Data for a 1 mile search radius", description="<br>".join(popup_fields) ) map.content.add(enrich_features, popup_info=pi)
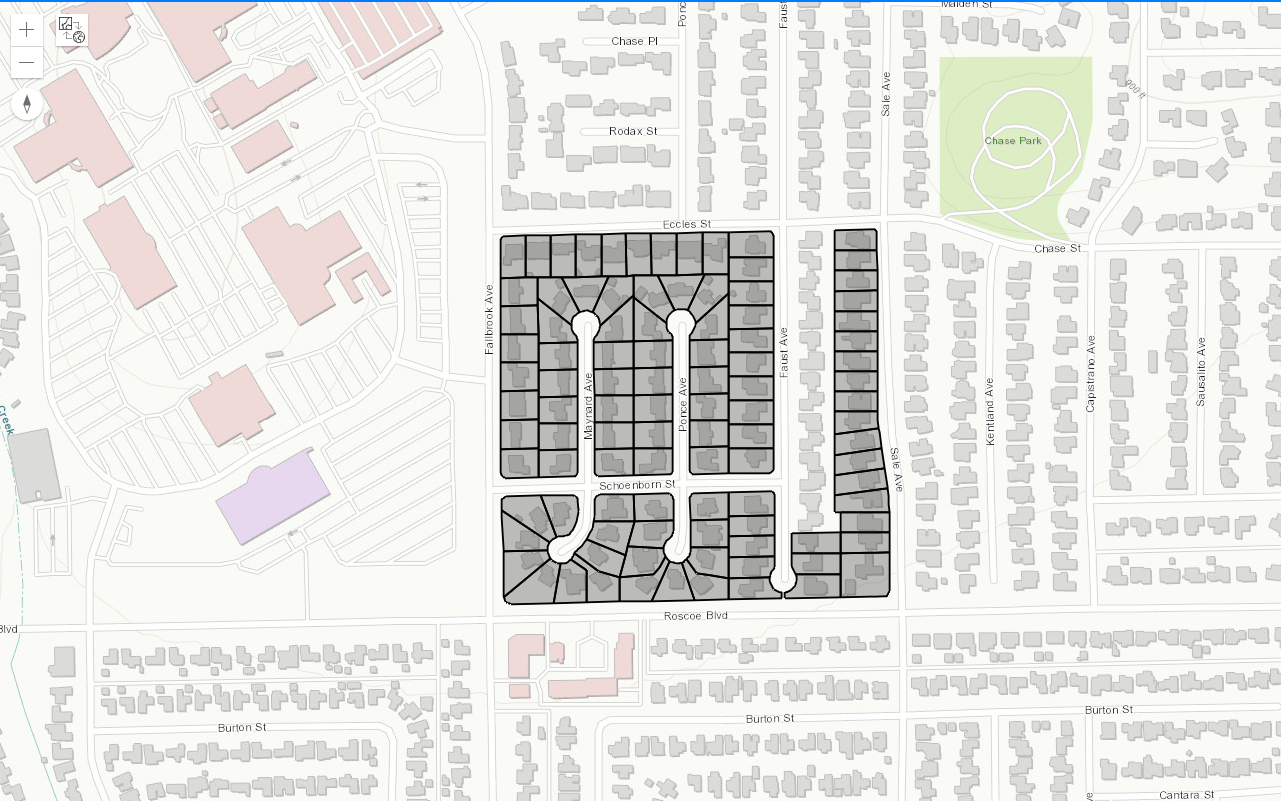
You should see a map centered around Nashville, TN with a graphic representing a 1 mile radius around the study area point. Click on the graphic to display a popup containing local demographic values.
What's next?
Learn how to use additional functionality in these tutorials: