Learn how to display features in a feature layer.
A map contains layers of geographic data. A map contains a basemap layer and, optionally, one or more data layers. This tutorial shows you how to access and display feature layers in a map. You access feature layers with an item ID or URL.
A feature layer is a spatially-enabled table in a feature service that contains features. Each feature layer contains features with a single geometry type (point, polyline, or polygon), and a set of attributes. You can access and display features by making query requests to the feature service and displaying them in a map.
In this tutorial, you access and display three different feature layers hosted in ArcGIS Online:
Prerequisites
The ArcGIS API for Python tutorials use Jupyter Notebooks to execute Python code. If you are new to this environment, please see the guide to install the API and use notebooks locally.
Steps
Import modules
-
Import the
arcgis.gismodule. This module is the entry point into the GIS and provides the functionality to manage GIS content, users, and groups. Additionally, import theServiceclass from thearcgis.layersmodule, which has functions for accessing, managing, and displaying features from feature services.Use dark colors for code blocks from arcgis.gis import GIS from arcgis.layers import Service -
Log in anonymously to access publicly shared content. The data used in this tutorial is public so you do not need credentials to access it. If it were private data, you would be required to provide authentication.
Use dark colors for code blocks from arcgis.gis import GIS from arcgis.layers import Service portal = GIS()
Create feature layers using URLs
-
Use the
Serviceclass to create afeaturelayerinstance for each layer URL.Use dark colors for code blocks portal = GIS() points_layer = Service( "https://services3.arcgis.com/GVgbJbqm8hXASVYi/arcgis/rest/services/Trailheads/FeatureServer/0" ) points_layer polylines_layer = Service( "https://services3.arcgis.com/GVgbJbqm8hXASVYi/arcgis/rest/services/Trails/FeatureServer/0" ) polylines_layer polygons_layer = Service( "https://services3.arcgis.com/GVgbJbqm8hXASVYi/arcgis/rest/services/Parks_and_Open_Space/FeatureServer/0" ) polygons_layer
Display the feature layers
-
Create a map widget instance by calling the
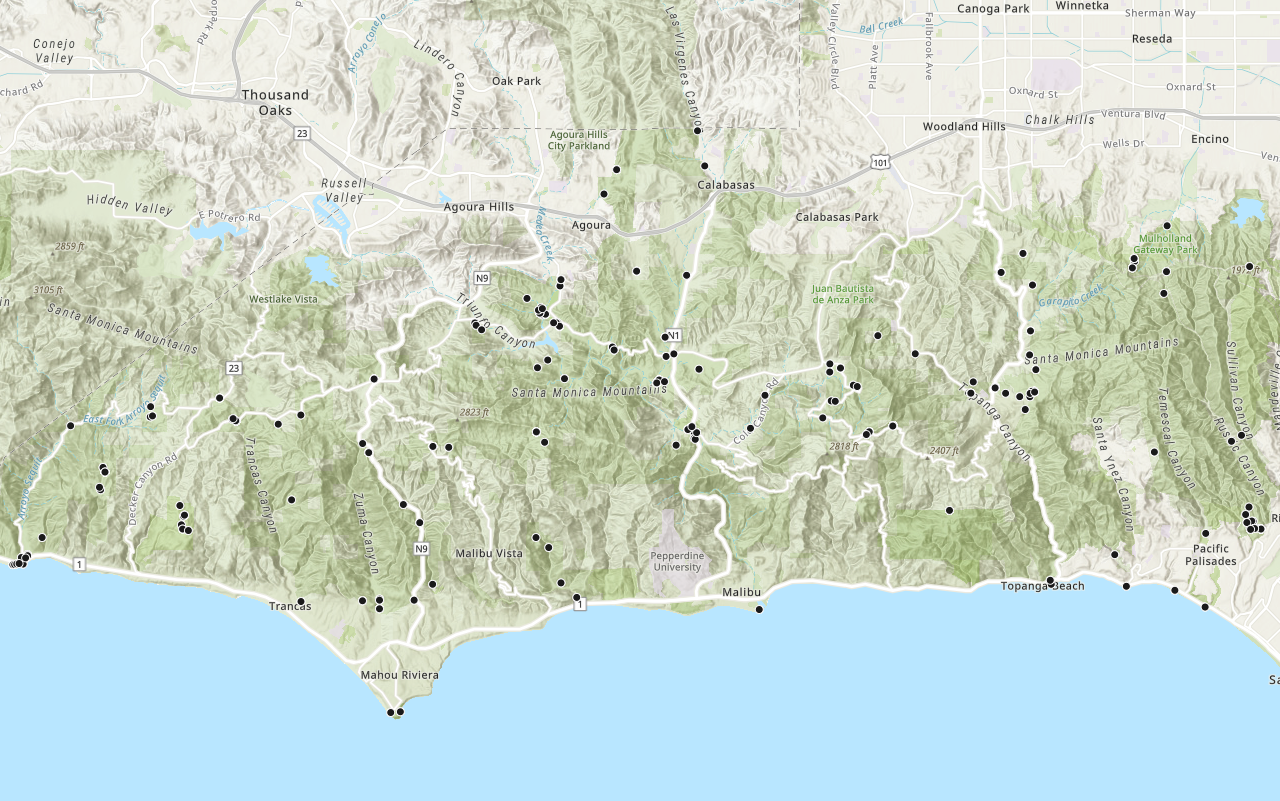
mapmethod and pass in the location ofMalibu, CAto set the maps initial extent. Use theaddmethod of thearcgis.layer.class to add each feature layer to the map.Content Manager Use dark colors for code blocks points_layer = Service( "https://services3.arcgis.com/GVgbJbqm8hXASVYi/arcgis/rest/services/Trailheads/FeatureServer/0" ) points_layer polylines_layer = Service( "https://services3.arcgis.com/GVgbJbqm8hXASVYi/arcgis/rest/services/Trails/FeatureServer/0" ) polylines_layer polygons_layer = Service( "https://services3.arcgis.com/GVgbJbqm8hXASVYi/arcgis/rest/services/Parks_and_Open_Space/FeatureServer/0" ) polygons_layer map = portal.map("Malibu, CA") map for layer in [points_layer, polylines_layer, polygons_layer]: map.content.add(layer) map.center = [34.0761,-118.7055] map.zoom = 12
You should see point, line, and polygon features (representing trailheads, trails, and parks) drawn on the map for an area in the Santa Monica Mountains.
Optional: Export the map widget
- Create a standalone HTML page that can be shared and rendered in a web browser.
Use dark colors for code blocks from os import path, getcwd export_dir = path.join(getcwd(), "home") if not path.isdir(export_dir): os.mkdir(export_dir) export_path = path.join(export_dir, "add-a-feature-layer.html") map.export_to_html(export_path, title="Add a feature layer")
What's next?
Learn how to use additional functionality in these tutorials:
Add a layer from a portal item
Learn how to use a portal item to access and display point features from a feature service.

Query a feature layer (spatial)
Learn how to execute a spatial query to access polygon features from feature services.
Query a feature layer (SQL)
Learn how to execute a SQL query to access polygon features from feature services.