Learn how to display point, line, and polygon graphics in a map.
Graphics are visual elements used to display points, lines, polygons, and text in a map or scene. Graphics are composed of a geometry, symbol, and attributes, and can display a pop-up when clicked. You typically use graphics to display geographic data that is not connected to a database (i.e. a GPS location).
In this tutorial, you will learn how to display points, lines, and polygons on a map as graphics.
Prerequisites
The ArcGIS API for Python tutorials use Jupyter Notebooks to execute Python code. If you are new to this environment, please see the guide to install the API and use notebooks locally.
Steps
Import modules and log in
-
Import the
arcgis.gis,arcgis.geometry,arcgis.map.symbolsandarcgis.map.popupmodules. TheGISclass provides the information model for a GIS hosted in ArcGIS Online or Portal for ArcGIS. Thegeometrymodule provides functions for managing and working with different geometric types. The symbols and popup modules provide the objects and functions needed to visualize and interact with the graphics on the map.Use dark colors for code blocks # Import modules from arcgis import GIS from arcgis.geometry import Point, Polyline, Polygon from arcgis.map.symbols import SimpleMarkerSymbolEsriSMS, SimpleLineSymbolEsriSLS, SimpleFillSymbolEsriSFS, SimpleFillSymbolStyle, SimpleMarkerSymbolStyle, SimpleLineSymbolStyle from arcgis.map.popups import PopupInfo -
Log in anonymously to access publicly shared content. The data used in this tutorial is public so you do not need credentials to access it. If it were private data, you would be required to provide authentication.
Use dark colors for code blocks # Import modules from arcgis import GIS from arcgis.geometry import Point, Polyline, Polygon from arcgis.map.symbols import SimpleMarkerSymbolEsriSMS, SimpleLineSymbolEsriSLS, SimpleFillSymbolEsriSFS, SimpleFillSymbolStyle, SimpleMarkerSymbolStyle, SimpleLineSymbolStyle from arcgis.map.popups import PopupInfo # Log in to portal portal = GIS() # anonymously
Create the graphics
-
Use the
Pointclass to create a new graphic. Use adictobject to create attributes and theSimpleclass to create the point symbol.Marker Symbol Esri SMS Use dark colors for code blocks # Log in to portal portal = GIS() # anonymously point_geometry = Point({"x": -118.8066, "y": 34.0006, "spatialReference": {"wkid":4326}}) point_attributes = {"name": "Point", "description": "I am a point"} point_symbol = SimpleMarkerSymbolEsriSMS( style = SimpleMarkerSymbolStyle.esri_sms_circle, color = [0, 0, 0], outline = SimpleLineSymbolEsriSLS(color = [255, 255, 255], width = 1), ) -
Use the
Polylineclass to create a new graphic object. Use adictobjects to create attributes and theSimpleclass to create the polyline symbol.Line Symbol Esri SLS Use dark colors for code blocks point_geometry = Point({"x": -118.8066, "y": 34.0006, "spatialReference": {"wkid":4326}}) point_attributes = {"name": "Point", "description": "I am a point"} point_symbol = SimpleMarkerSymbolEsriSMS( style = SimpleMarkerSymbolStyle.esri_sms_circle, color = [0, 0, 0], outline = SimpleLineSymbolEsriSLS(color = [255, 255, 255], width = 1), ) polyline_geometry = Polyline({ "paths": [[ [-118.821527826096, 34.0139576938577], [-118.814893761649, 34.0080602407843], [-118.808878330345, 34.0016642996246], ]], "spatialReference": {"wkid":4326} }) polyline_attributes = {"name": "Polyline", "description": "I am a Polyline"} polyline_symbol = SimpleLineSymbolEsriSLS( style = SimpleLineSymbolStyle.esri_sls_solid, color = [255, 155, 128], width = 2 ) -
Use the
Polygonclass to create a new graphic object. Use adictobjects to create attributes and theSimpleclass to create the polygon symbol.Fill Symbol Esri SFS Use dark colors for code blocks polyline_geometry = Polyline({ "paths": [[ [-118.821527826096, 34.0139576938577], [-118.814893761649, 34.0080602407843], [-118.808878330345, 34.0016642996246], ]], "spatialReference": {"wkid":4326} }) polyline_attributes = {"name": "Polyline", "description": "I am a Polyline"} polyline_symbol = SimpleLineSymbolEsriSLS( style = SimpleLineSymbolStyle.esri_sls_solid, color = [255, 155, 128], width = 2 ) polygon_geometry = Polygon( { "rings": [ [ [-118.818984489994, 34.0137559967283], [-118.806796597377, 34.0215816298725], [-118.791432890735, 34.0163883241613], [-118.79596686535, 34.008564864635], [-118.808558110679, 34.0035027131376], ] ], "spatialReference": {"wkid":4326} } ) polygon_attributes = {"name": "Polygon", "description": "I am a Polygon"} polygon_symbol = SimpleFillSymbolEsriSFS( style = SimpleFillSymbolStyle.esri_sfs_solid, color = [50, 100, 200, 125], outline = SimpleLineSymbolEsriSLS(color = [255, 255, 255], width = 1) )
Display the results
-
Use the
mapmethod to create a new map widget.Use dark colors for code blocks polygon_geometry = Polygon( { "rings": [ [ [-118.818984489994, 34.0137559967283], [-118.806796597377, 34.0215816298725], [-118.791432890735, 34.0163883241613], [-118.79596686535, 34.008564864635], [-118.808558110679, 34.0035027131376], ] ], "spatialReference": {"wkid":4326} } ) polygon_attributes = {"name": "Polygon", "description": "I am a Polygon"} polygon_symbol = SimpleFillSymbolEsriSFS( style = SimpleFillSymbolStyle.esri_sfs_solid, color = [50, 100, 200, 125], outline = SimpleLineSymbolEsriSLS(color = [255, 255, 255], width = 1) ) map = portal.map() map -
Use the
drawmethod to add each of the graphics, with their associated symbology and attributes, to the map. Use thepopupparameter to build apopupobject from the attribute values.Info Use dark colors for code blocks map = portal.map() map map.content.draw( shape=polyline_geometry, symbol=polyline_symbol, popup=PopupInfo(title=polyline_attributes["name"], description=polyline_attributes["description"]) ) map.content.draw( shape=point_geometry, symbol=point_symbol, popup=PopupInfo(title=point_attributes["name"], description=point_attributes["description"]) ) map.content.draw( shape=polygon_geometry, symbol=polygon_symbol, popup=PopupInfo(title=polygon_attributes["name"], description=polygon_attributes["description"]) ) -
Set the map center by passing in coordinates and provide a scale level. This will update the map extent so that the newly added graphics are displayed prominently in the view.
Use dark colors for code blocks map.content.draw( shape=polyline_geometry, symbol=polyline_symbol, popup=PopupInfo(title=polyline_attributes["name"], description=polyline_attributes["description"]) ) map.content.draw( shape=point_geometry, symbol=point_symbol, popup=PopupInfo(title=point_attributes["name"], description=point_attributes["description"]) ) map.content.draw( shape=polygon_geometry, symbol=polygon_symbol, popup=PopupInfo(title=polygon_attributes["name"], description=polygon_attributes["description"]) ) map.center = [34.0122, -118.8055] map.zoom = 14 -
Optional: Use the
exportmethod to export the current state of the map widget to a static HTML file which can be viewed in any web browser._to _html Use dark colors for code blocks map.center = [34.0122, -118.8055] map.zoom = 14 import os file_dir = os.path.join(os.getcwd(), "home") if not os.path.isdir(file_dir): os.mkdir(file_dir) file_path = os.path.join(file_dir, "add-a-point-line-and-polygon.html") map.export_to_html(file_path, title="Add a point, line, and polygon")
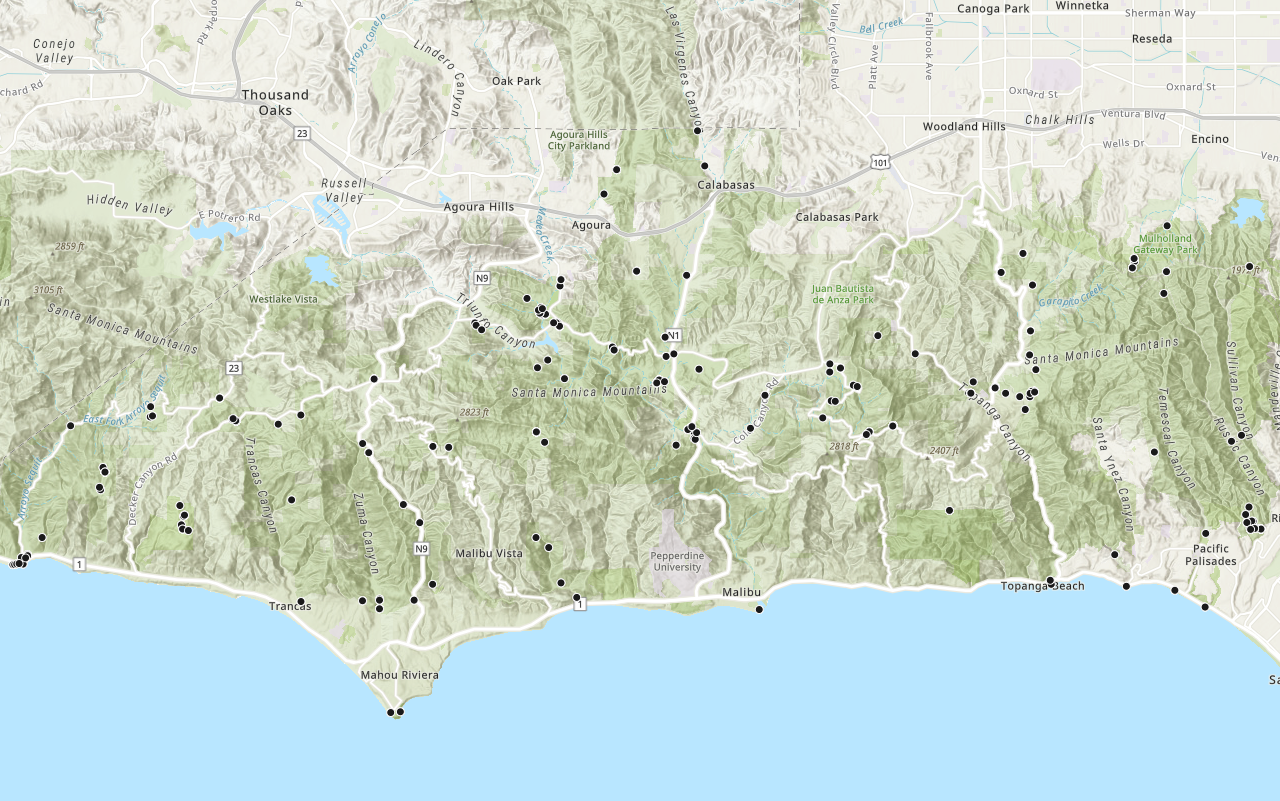
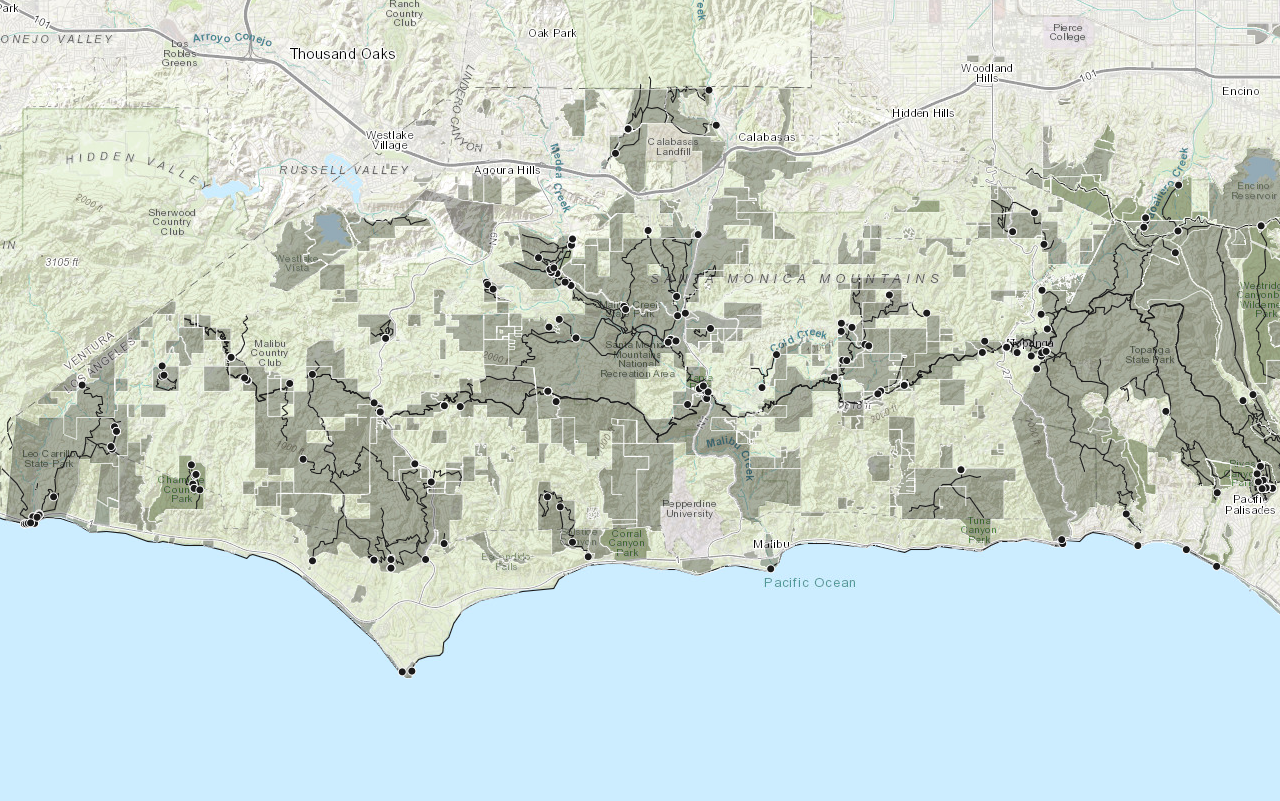
Your map should display three graphics in the Santa Monica Mountains. Click on a graphic to display its popup.
What's next?
Learn how to use additional functionality in these tutorials:
Add a layer from a portal item
Learn how to use a portal item to access and display point features from a feature service.
Add a feature layer
Learn how to access and display point, line, and polygon features from a feature service.

Find place addresses
Search for places such as coffee shops, gas stations, or restaurants.

Find a route
Guide: Learn how to find a route and directions between locations with the routing service.