Use express maps to quickly create maps for your story.
What are express maps?
Express Maps is a feature in ArcGIS StoryMaps that lets you easily create and add interactive maps to your stories. You can quickly highlight important locations or add context to your story by including maps.
Why use express maps?
Some of the key reasons you might want to use Express Maps in ArcGIS StoryMaps are that you can quickly create maps and it is easy to style maps.
Quickly create maps
Express Maps provides a simplified way to create and embed maps within your story. The web interface makes it easy for you to quickly add location-based context to your story. You save time and effort on map preparation and formatting where you:
- Input locations manually
- Import data from a spreadsheet
- Provide latitude and longitude coordinates.
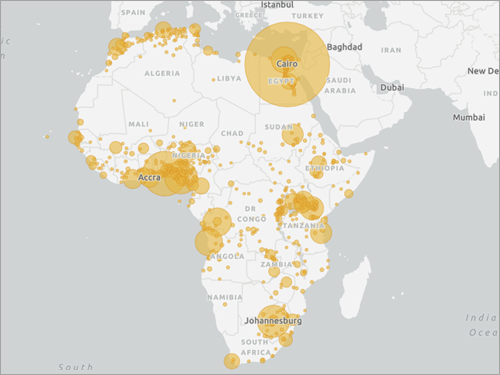
Style maps to support your story
Express Maps provides a spatial context that helps your users better understand the content presented in your story. By incorporating maps, you can show:
- Spatial data distribution
- Data relationships
- Analyze patterns in your data
You can symbolize and color-code your map points based on different attributes, making it easier for users to interpret and analyze information.
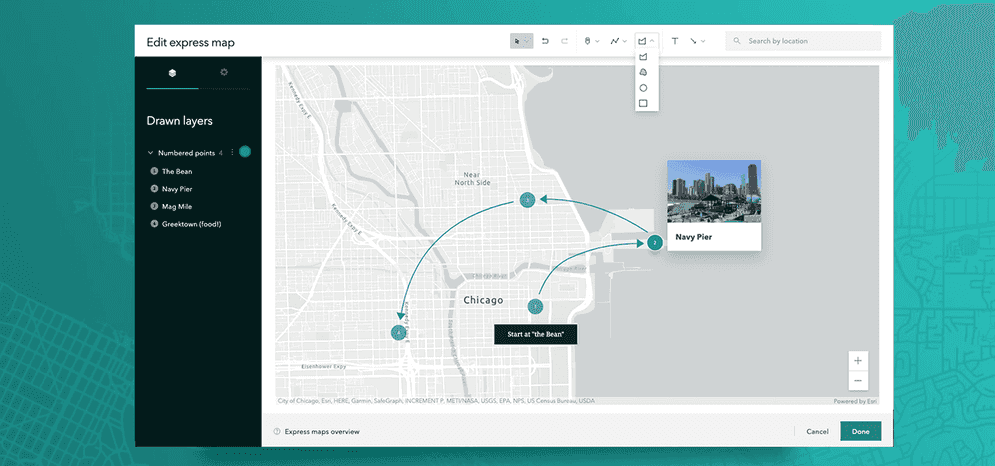
How to use express maps
Listed below are high-level steps on how you can use Express Maps:
-
Click on New Section button or the icon to add a new section when creating or editing a story.
-
In the section options, click Express Maps.
-
Choose a basemap for your map. Basemaps provide the background context for your data and can range from:
- Satellite imagery
- Topographic maps
- Thematic styles
-
Add locations to your map in a few different ways:
- Manually search for a place or address
- Input latitude and longitude coordinates
- Import a spreadsheet or CSV file containing location data
The map will automatically plot your chosen locations as points.
-
Customize the appearance of points on the map by changing the marker symbols, colors, and sizes.
-
Configure pop-ups that appear when users interact with the map points. Choose the attributes to display in the pop-ups, such as names, descriptions, images, or any other relevant data associated with the locations.
-
Click Save to store your changes.
The map will be added as a section within your story. You can further customize the section by adding text, images, or additional media content.
Optional steps
-
Apply filters to dynamically control which points are displayed based on specific conditions. This allows you to create interactive maps that respond to user interactions and provide focused information based on their preferences.
-
Add map actions to explore and interact with your map such as:
- Zooming to a specific location
- Panning to a different extent
- Displaying a pop-up when a map point is clicked
Tutorials

Customize a theme for impactful stories
Recreate an award-winning theme from the 2020 ArcGIS StoryMaps Competition to get to know the capabilities of the StoryMaps theme builder.
Build a sidecard in your story
Use a sidecar to allow others to access your mapped data one step at a time.