In this workflow, you will learn how to create, manage, and access a map tile service in ArcGIS. The process involves importing an existing dataset to create a hosted feature layer and a feature service, managing the service, publishing the map tile service, setting the security level, and then displaying the data in an application.
Prerequisites
You need an account for ArcGIS Platform, ArcGIS Online, or ArcGIS Enterprise to create hosted data services. If you need an account, go to Get started.
Steps
Download the data
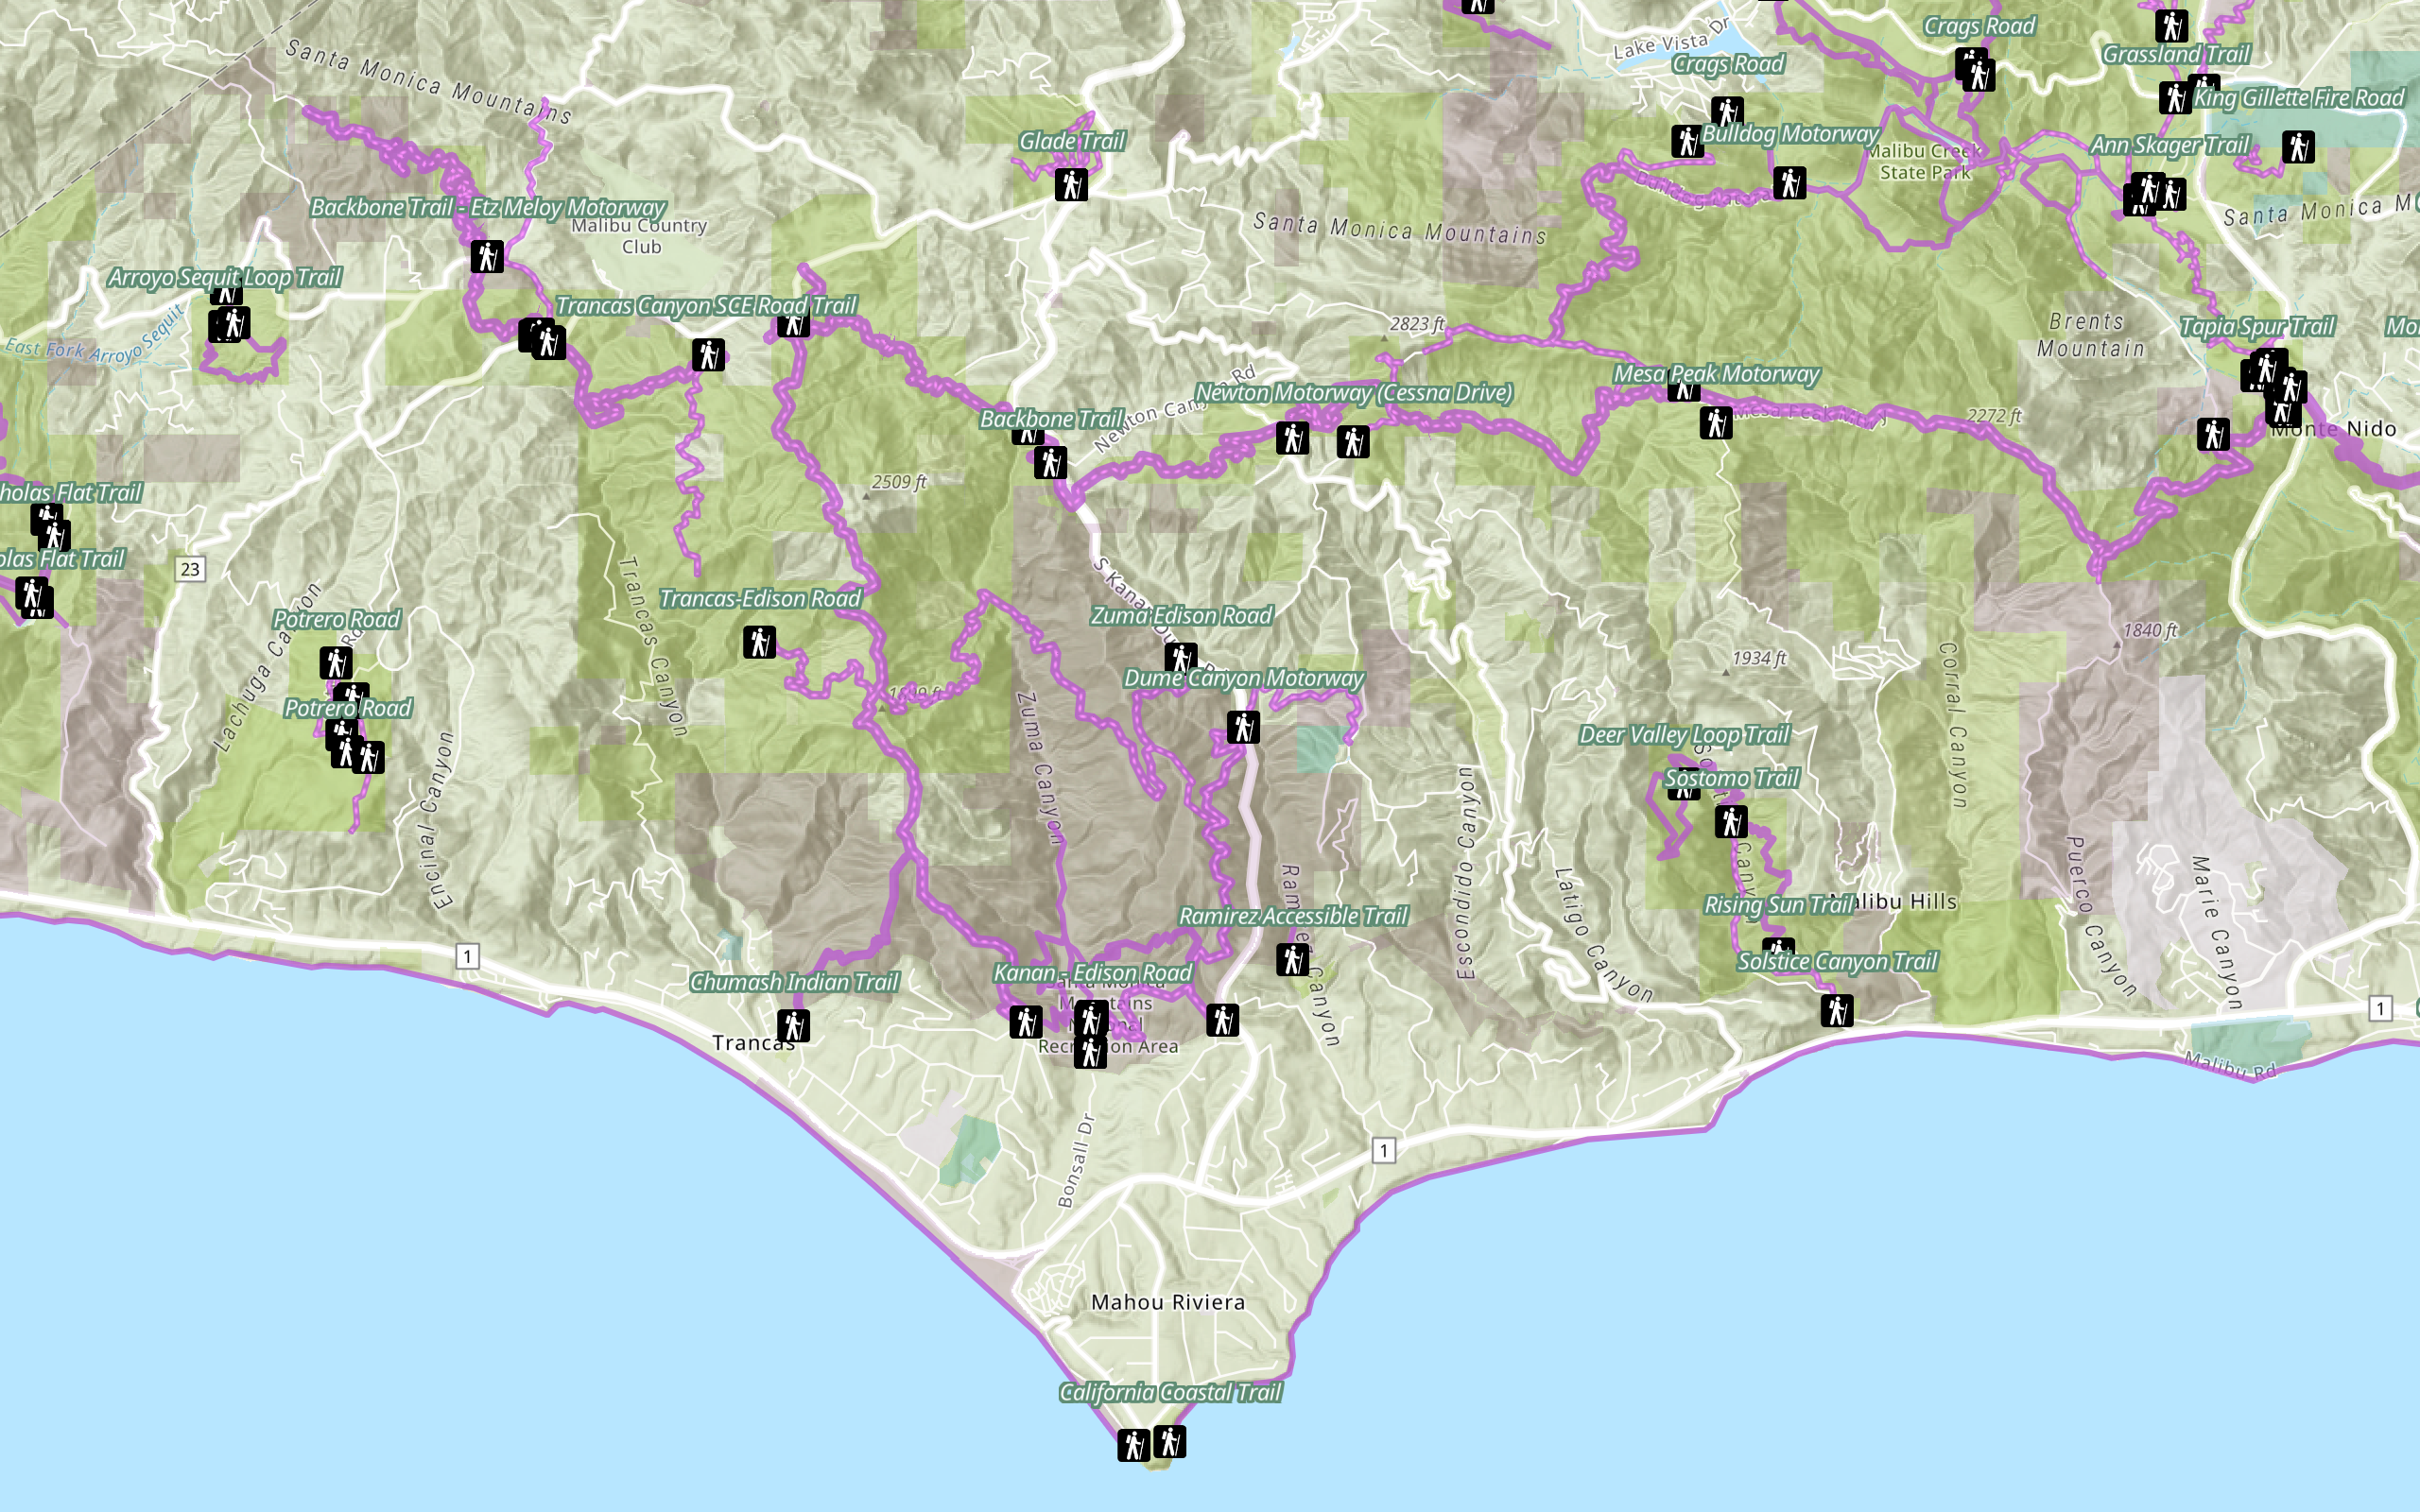
For this workflow, you will use the Santa Monica elevation contours dataset.
-
In your web browswer, go to the Santa Monica elevation contours item.
-
Click the Download button to download the zip file locally. Do not unzip this file.
Create a feature layer
Before you create a map tile layer, you need to create a feature layer.
To create a feature layer in a feature service, you need to upload data into ArcGIS. You can use data management tools or scripting APIs.
Data management tools
Import the shapefile using a data management tool.
In your web browser, go to ArcGIS.com and sign in with your ArcGIS Developer account.
-
In the top navigation bar, click Content.
-
Click New item. To upload the Santa Monica elevation contours Shapefile, you can either:
- Drag and drop the file.
- Or, click Your device and navigate to the file path.
-
Select Santa_Monica_contours_clipped_export.zip and create a hosted feature layer to publish the file as a hosted feature layer.
-
In Fields, leave all fields at their default settings and click Next.
-
In Location settings, leave the default settings and click Next.
-
Set the following information in the item details pane:
- Title:
Santa Monica elevation contours - Tags:
santa,monica,elevation,contours,map tile,service,tutorial - Summary:
City of Santa Monica elevation contours
- Title:
-
Click Next to create the new feature layer and feature service.
In your web browser, go to ArcGIS.com and sign in with your ArcGIS Online account.
-
In the top navigation bar, click Content.
-
Click New item. To upload the Santa Monica elevation contours Shapefile, you can either:
- Drag and drop the file.
- Or, click Your device and navigate to the file path.
-
Select Santa_Monica_contours_clipped_export.zip and create a hosted feature layer to publish the file as a hosted feature layer.
-
In Fields, leave all fields at their default settings and click Next.
-
In Location settings, leave the default settings and click Next.
-
Set the following information in the item details pane:
- Title:
Santa Monica elevation contours - Tags:
santa,monica,elevation,contours,map tile,service,tutorial - Summary:
City of Santa Monica elevation contours
- Title:
-
Click Next to create the new feature layer and feature service.
In your web browser, go to your ArcGIS Enterprise portal website and sign in with your ArcGIS Enterprise account.
-
In the top navigation bar, click Content.
-
Click New item. To upload the Santa Monica elevation contours Shapefile, you can either:
- Drag and drop the file.
- Or, click Your device and navigate to the file path.
-
Select Santa_Monica_contours_clipped_export.zip and create a hosted feature layer to publish the file as a hosted feature layer.
-
In Fields, leave all fields at their default settings and click Next.
-
In Location settings, leave the default settings and click Next.
-
Set the following information in the item details pane:
- Title:
Santa Monica elevation contours - Tags:
santa,monica,elevation,contours,map tile,service,tutorial - Summary:
City of Santa Monica elevation contours
- Title:
-
Click Next to create the new feature layer and feature service.
You can use ArcGIS Pro to import Santa Monica elevation contours data.
- Unzip the Santa_Monica_contours_clipped_export zip file.
- The zip file contains the OverlayedFeatures.shp file.
- Launch ArcGIS Pro.
- Create a new map project.
- A map with
World Topographic MapandWorld Hillshadebasemap layers will be created.
- In the Map ribbon, click on Add Data > Data and select OverlayedFeatures.shp file.
The OverlayedFeatures.shp file is added as a feature layer to the map.
Scripting APIs
You can also import the shapefile with the ArcGIS API for Python or ArcGIS REST JS. The general steps are as follows:
- Import the required libraries.
- Provide an access token.
- Create and publish a portal item.
- Handle the results.
# local path to shapefile zip file
input_file_path = str(
Path(__file__).parent / "Santa_Monica_contours_clipped_export.zip"
)
# add the zip file as an item to portal
shp_item = portal.content.add(
{"title": "Santa Monica elevation contours", "description": "City of Santa Monica elevation contours", "tags": "santa, monica, elevation, contours, map tile, service, tutorial",
"type": "Shapefile", }, input_file_path, )
# publish the item to create a hosted feature service
shp_service = shp_item.publish(None)
print(f"New item id : {shp_service.id,}, url: {shp_service.layers[0].url}") // create item
const zipItem = await createItem({
authentication: auth,
item: {
title: "Santa Monica elevation contours",
description: "City of Santa Monica elevation contours",
tags: "santa, monica, elevation, contours, map tile, service, tutorial",
type: "Shapefile",
},
file: f,
})
// execute publish operation
const publishedService = await request(publishURL, {
authentication: auth,
params: {
itemid: zipItem.id,
filetype: "shapefile",
publishParameters: publishParams,
},
})
// handle results
console.log("New service created: ")
publishedService.services.forEach(s => {
console.log(`\tid: ${s.serviceItemId} \n\turl:${s.serviceurl}`)
})
Manage service settings
The layer has polyline features with large numbers of vertices per feature. To improve performance, enable drawing optimization and CDN caching. Caching will decrease network latency and increase responsiveness.
In ArcGIS.com, use the Settings tab to configure service settings such as cache and drawing optimization.
Enable the following settings:
-
Optimize layer drawing
- In the item page, go to the Settings > Optimize Layer Drawing. Click Optimize layers and select the layer to optimize > Update.
-
Cache control
- In the item page, go to the Settings tab > Cache control. Set the time you want users to wait before seeing updates to the layer.
In your ArcGIS Enterprise portal, use the Settings tab to configure service settings such as cache and drawing optimization.
Enable the following setting:
-
Optimize layer drawing
- In the item page, go to the Settings > Optimize Layer Drawing. Click Optimize layers and select the layer to optimize > Update.
Please see ArcGIS Platform, ArcGIS Online or ArcGIS Enterprise steps to manage service settings.
Set the feature styles
Use data management tools to set the style for a feature layer.
In ArcGIS.com, use the Visualization tab to set the feature styles.
-
Go back to the item page > Visualization.
-
In the left panel, click the Layers and select the Santa Monica contours layer. In the right panel, click Edit layer style.
-
Under Pick a style, click Location (single symbol).
-
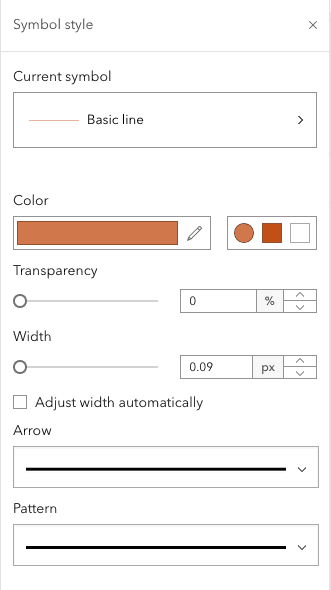
For Symbol style, click on the pencil icon to open the Symbol style pane.
-
Set each of the following properties:
- Color:
#d0774b - Transparency: 0
- Width: 0.09
- Adjust width automatically: false
Your Symbol style pane should look like this:
- Color:
-
Click the X to exit out of Symbol style. Then click Done twice.
-
Click Save to save the style.
-
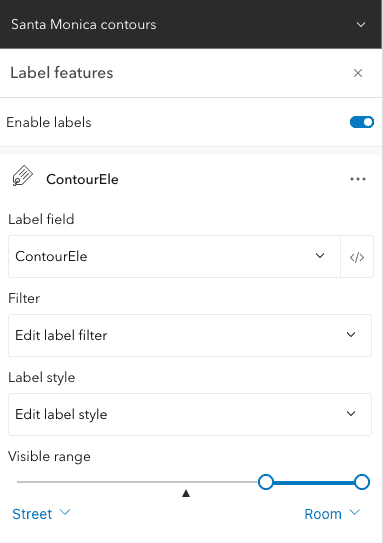
Click on Labels in the right toolbar.
-
Click Enable labels to toggle on.
-
Under Label field, select the
**Contourfield.Ele** -
Under Label Style set the following properties:
- Font:
Arial Regular - Size: 13
- Color:
#d0774b - Allow overrun: false
- Repeat label: true
- Label repeat interval: 0
- Halo: true
- Color:
#ffffff - Size: 1
- Color:
Your Label style pane should look like this:
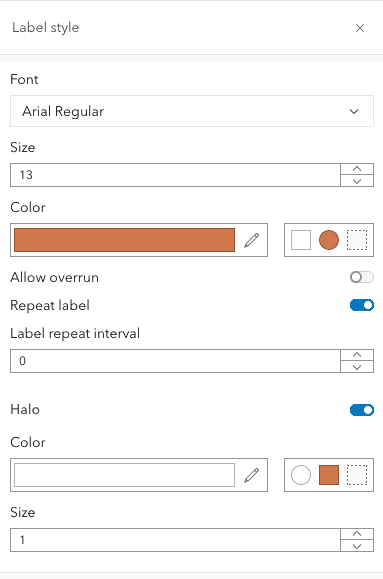
- Font:
-
Click X to dismiss the Label style pane.
-
Under Visible range, set the visible range from
StreettoRoom.Your Label features pane should look like this:
-
Click X to dismiss the Label features pane.
-
Click Save to save the style.
In ArcGIS.com, use the Visualization tab to set the feature styles.
-
Go back to the item page > Visualization.
-
In the left panel, click the Layers and select the Santa Monica contours layer. In the right panel, click Edit layer style.
-
Under Pick a style, click Location (single symbol).
-
For Symbol style, click on the pencil icon to open the Symbol style pane.
-
Set each of the following properties:
- Color:
#d0774b - Transparency: 0
- Width: 0.09
- Adjust width automatically: false
Your Symbol style pane should look like this:
- Color:
-
Click the X to exit out of Symbol style. Then click Done twice.
-
Click Save to save the style.
-
Click on Labels in the right toolbar.
-
Click Enable labels to toggle on.
-
Under Label field, select the
**Contourfield.Ele** -
Under Label Style set the following properties:
- Font:
Arial Regular - Size: 13
- Color:
#d0774b - Allow overrun: false
- Repeat label: true
- Label repeat interval: 0
- Halo: true
- Color:
#ffffff - Size: 1
- Color:
Your Label style pane should look like this:
- Font:
-
Click X to dismiss the Label style pane.
-
Under Visible range, set the visible range from
StreettoRoom.Your Label features pane should look like this:
-
Click X to dismiss the Label features pane.
-
Click Save to save the style.
In your ArcGIS Enterprise portal, use the Visualization tab to set the feature styles.
-
Go back to the item page > Visualization.
-
In the left panel, click the Layers and select the Santa Monica contours layer. In the right panel, click Edit layer style.
-
Under Pick a style, click Location (single symbol).
-
For Symbol style, click on the pencil icon to open the Symbol style pane.
-
Set each of the following properties:
- Color:
#d0774b - Transparency: 0
- Width: 0.09
- Adjust width automatically: false
Your Symbol style pane should look like this:
- Color:
-
Click the X to exit out of Symbol style. Then click Done twice.
-
Click Save to save the style.
-
Click on Labels in the right toolbar.
-
Click Enable labels to toggle on.
-
Under Label field, select the
**Contourfield.Ele** -
Under Label Style set the following properties:
- Font:
Arial Regular - Size: 13
- Color:
#d0774b - Allow overrun: false
- Repeat label: true
- Label repeat interval: 0
- Halo: true
- Color:
#ffffff - Size: 1
- Color:
Your Label style pane should look like this:
- Font:
-
Click X to dismiss the Label style pane.
-
Under Visible range, set the visible range from
StreettoRoom.Your Label features pane should look like this:
-
Click X to dismiss the Label features pane.
-
Click Save to save the style.
You can use ArcGIS Pro to change the visualization of the Santa Monica contours layer.
Change the contour visualization
-
In the Content pane, click on the line symbol. This will display the Symbology pane.
-
In the Symbology pane, click Properties.
-
In the Appearance section:
- Click the color > Color Properties and set the following properties:
- HEX #:
#d0774b - Transparency:
0% - Click OK
- HEX #:
- Line width:
0.09 pt - Click Apply.
- Click the color > Color Properties and set the following properties:
-
Click Save Project.
Add labels to the contour
You will use Arcade to label the Santa_Monica_contours layer.
-
In the Contents pane, right-click Santa_Monica_contours layer and click Labeling Properties.
-
In the Label Class pane, set the following information:
- Language:
Arcade - Expression:
$feature["ContourEle"]
- Language:
-
Click Apply.
-
Click Save Project.
Values from the Contour field are used to label the contour lines in the map.
Scripting APIs
You can also style the elevation contours features using the ArcGIS API for python or ArcGIS REST JS. The general steps are as follows:
- Import the required libraries.
- Provide an access token.
- Retrieve feature layer properties.
- Define a new renderer.
- Update feature layer properties.
- Handle the results.
# update the drawing info
feature_layer_props["drawingInfo"] = new_drawing_info
# reset last edit date
feature_layer_props["editingInfo"]["lastEditDate"] = None
# apply changes
results = feature_layer.manager.update_definition(feature_layer_props)
print(results) // get layer properties
const layerAdminInfo = await getServiceAdminInfo(featureLayerURL, auth);
// update the renderer
layerAdminInfo.drawingInfo = newDrawingInfo;
// reset edit date
layerAdminInfo.editingInfo.lastEditDate = null;
// updateDefinition endpoint
const updateURL = `${adminURL}/updateDefinition`;
// execute updateDefinition operation
const results = await request(updateURL, {
authentication: auth,
params: {
updateDefinition: layerAdminInfo,
},
});
console.log(results);
Publish the map tile service
Use data management tools or scripting APIs to publish a map tile service from the source feature layer.
Data management tools
Use ArcGIS.com to publish the map tile service.
-
Go back to the item page > Overview.
-
Click Publish > Tile layer.
-
In the Create a tile layer modal, select Create tiles automatically
-
Enter a Title and Tags for the new map tile layer. Click OK. You will be directed to the item page page for the new tile service.
Use your ArcGIS Enterprise portal to publish the map tile service.
-
Go back to the item page > Overview.
-
Click Publish > Tile layer.
-
In the Create a tile layer modal, select Create tiles automatically
-
Enter a Title and Tags for the new map tile layer. Click OK. You will be directed to the item page page for the new tile service.
You will create a map tile service from your _Santa Monica Contours hosted layer by creating a map tile package in ArcGIS Pro.
Add the hosted layer to the project
- Launch ArcGIS Pro and create a new map project.
- In the Catalog pane, click Project.
- Right-click on the OverlayedFeatures.shp and click Add To Current Map to add the shapefile to the map.
- Click Save Project to save your project.
Add metadata to the map
Part of the vector tile package creation process is to add metadata to the map. The steps below will outline how metadata can be added to your map project.
- Select and right-click on Map > Edit Metadata in the Contents pane.
- Set the following information in the metadata pane:
- Title:
Santa Monica Contours (map tile) - Tags:
santa,monica,contours,map,tile,service - Summary:
Santa Monica contours map tile package - Description:
Santa Monica contours map tile package
- Title:
- Click New Bounding Box and set the following information:
- West:
-118.521 - East:
-118.440 - South:
33.992 - North:
34.053
- West:
Set the map coordinate System
An additional part of the vector tile creation process is to set the coordinate system of your map.
- Select and right-click on Map > Properties.
- In the Map Properties window, click Coordinate System.
- In the XY Coordinate Systems Available, enter
Web Mercatorin the search textbox. - Select WGS 1984 Web Mercator (auxialiary sphere)
- Click OK
- Click Save Project
Create the map tile package
- In the Analysis ribbon, click Tools. The Geoprocessing pane is displayed.
- In the search textbox, enter create map tile package and click the first item to launch the tool.
- In the Create Map Tile Package geoprocessing tool, set the following information:
- Input Map:
Map - Click the Browse button. Set
Santaas the name and path for the Output FileMonica M a p Tile Package - Tiling Format:
PNG 8 bit - Minimum Level Of Detail:
0 ( 591657527.591555 ) - Maximum Level of Detail:
22 ( 141.062147 ) - Extent:
Default - Package type:
tpkx
- Input Map:
- Click Run.
Publish the map tile package
To share and publish the map tile package, follow these instructions:
- In a web browser, go to ArcGIS.com and sign in with your ArcGIS Developer account.
- In the top navigation bar, click Content.
- Click New item. To upload the SantaMonicaMapTilePackage.tpkx file, you can either:
- Drag and drop the file.
- Or, click Your device and navigate to the file path.
- Select SantaMonicaMapTilePackage.tpkx and create a hosted layer.
- Click Next.
- Set the following information:
- Title:
Santa Monica (map tile) - Tags:
Santa Monica,map,tile,service
- Title:
- Click Save.
The Santa Monica (map tile) hosted map tile layer is created.
Scripting APIs
You can also publish the elevation data feature layer to create a map tile service using the ArcGIS API for Python or ArcGIS REST JS. The general steps are as follows:
- Import the required libraries.
- Reference the source feature layer.
- Define the publish parameters.
- Execute the publish operation.
- Handle the results.
tile_service = item.publish(
publish_parameters=tile_params,
output_type="tiles",
file_type="featureService",
build_initial_cache=False,
)
print(
f"New item created:\n\tid:{tile_service.id}\n\turl: {tile_service.url}"
) // execute publish operation
const publishedService = await request(publishURL, {
authentication: auth,
params: {
itemid: '<YOUR ITEM ID>',
outputType: 'vectorTiles',
filetype: 'featureService',
publishParameters: vectorTileParams,
},
});
// handle results
console.log('New service created: ');
publishedService.services.forEach((s) => {
console.log(`\tid: ${s.serviceItemId} \n\turl:${s.serviceurl}`);
});
Get an access token
By default, the sharing level of an item is set to Owner and requires an access token, such as an API key to access it in a client-side application. If you have an ArcGIS Developer account, you can scope an API key to access private items. You cannot scope an API key to access private items if you have an ArcGIS Online or ArcGIS Enterprise account. Instead, to access private items, you need to generate a token from an OAuth 2.0 workflow.
-
Sign in to the developer dashboard.
-
Click the API keys tab > Edit API key.
-
In the Overview, find the Maps, layers, and data box. If you have an ArcGIS Developer account, you will be able to click Set content item scopes.
-
Select the item you want to scope > Add items.
-
Copy the API key.
In your web browser, go to ArcGIS.com and sign in with your ArcGIS Online account.
- Click Content > My Content.
- Click the New Item > Application.
- Under Application Type, select Other application. Click Next.
- Fill out the following properties:
- Title:
Data hosting workflow - Application Id - Tags:
authentication,appid,data,hosting,workflow - Summary: AppId used to provide authentication for data hosting workflows
- Title:
- Click Save. Once saved, you will be redirected to the item page.
- Click the Overview tab.
- Under Credentials, Temporary Token click Copy to clipboard to copy the access token.
In your web browser, go to your ArcGIS Enterprise portal website and sign in with your ArcGIS Enterprise account.
- Click Content > My Content.
- Click the New Item > Application.
- Under Application Type, select Other application. Click Next.
- Fill out the following properties:
- Title:
Data hosting workflow - Application Id - Tags:
authentication,appid,data,hosting,workflow - Summary: AppId used to provide authentication for data hosting workflows
- Title:
- Click Save. Once saved, you will be redirected to the item page.
- Click the Overview tab.
- Under Credentials, Temporary Token click Copy to clipboard to copy the access token.
Please see ArcGIS Platform, ArcGIS Online or ArcGIS Enterprise steps to get an access token.
Find the service URL and item ID
To access a hosted layer from an application, you need to be able to identify its ID and URL. If a layer is public, you use the URL or item ID to access it directly with your web browser or any application. If the layer is private, you need to provide an access token.
If you are using ArcGIS Maps SDKs:
- In the item page, click View to access the service. Locate the Service ItemId, which will look something like this:
- Service ItemID: 939e50d0f6fc4158b6baf4bec063035c
If you are using open source libraries:
- In the item page, scroll down to the bottom of the page to find the Service URL. For example:
- Service URL:
https://services3.arcgis.com/GVgb Jbqm8h XASVYi/arcgis/rest/services/Santa_ Monica_ contours_ (map_ tiles)/Map Server
- Service URL:
If you are using ArcGIS Maps SDKs:
- In the item page, click View to access the service. Locate the Service ItemId, which will look something like this:
- Service ItemID: 939e50d0f6fc4158b6baf4bec063035c
If you are using open source libraries:
- In the item page, scroll down to the bottom of the page to find the Service URL. For example:
- Service URL:
https://{host}/{webadaptor}/rest/services/Hosted/{service Name}/Map Server
- Service URL:
Please see ArcGIS Platform, ArcGIS Online or ArcGIS Enterprise steps to find the service URL and item ID.
Display tiles
To display map tiles from the Santa Monica elevation contours map tile service, you need to use a client-side mapping API such as an ArcGIS Maps SDK or open source library. Typically, you use a client-side tile layer class and set the service URL and layer index to access the feature layer.
-
Select an ArcGIS Maps SDK or open source library.
-
In the layer item page, find the service URL and layer index or the item ID.
-
In the code, set the service URL to the client-side URL parameter or the item ID to the portal item parameter.
-
Add the layer to the map.
const portal = new Portal({
url: "https://www.arcgis.com/",
authMode: "immediate"
});
// OR
esriConfig.apiKey = "YOUR_API_KEY"
const imageLayer = new TileLayer({
portalItem: {
id: "939e50d0f6fc4158b6baf4bec063035c",
},
})
const map = new Map({
basemap: "arcgis-light-gray",
layers: [imageLayer],
})
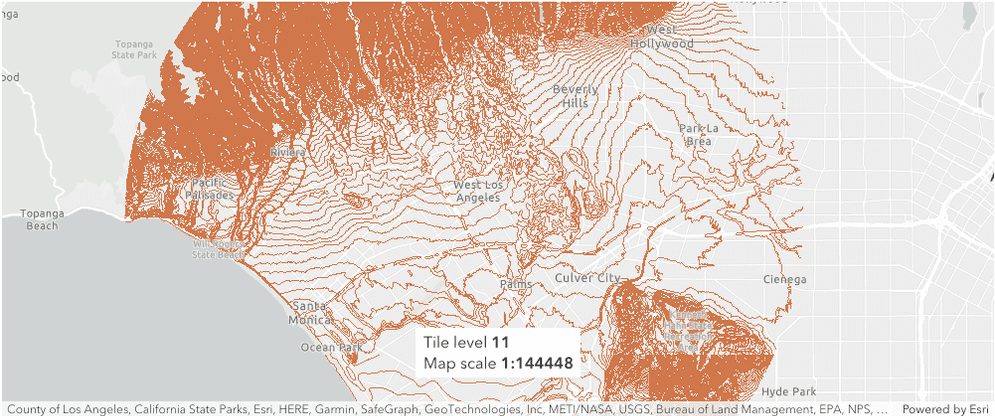
Your app will look something like this:
What's next?
Learn how to use additional tools, APIs, and location services in these tutorials:

Import data to create a feature layer
Use data management tools to import files and create a feature layer in a feature service.
Define a new feature layer
Use data management tools to define and create a new empty feature layer in a feature service.

Manage a feature layer
Use a hosted feature layer item to set the properties and settings of a feature layer in a feature service.

Create a vector tile service
Use data management tools to create a new vector tile service from a feature service.

Create a map tile service
Use ArcGIS Online or scripting APIs to publish a map tile service.
Add a feature layer
Access and display point, line, and polygon features from a feature service.

Add a vector tile layer
Access and display a vector tile layer in a map.

Add a map tile layer
Access and display a map tile layer in a map.
Style a feature layer
Use symbols and renderers to style feature layers.

Query a feature layer (spatial)
Execute a spatial query to get features from a feature layer.

Query a feature layer (SQL)
Execute a SQL query to access polygon features from a feature layer.

Edit feature data
Add, update, and delete features in a feature service.

Display a popup
Format a popup to show attributes in a feature layer.