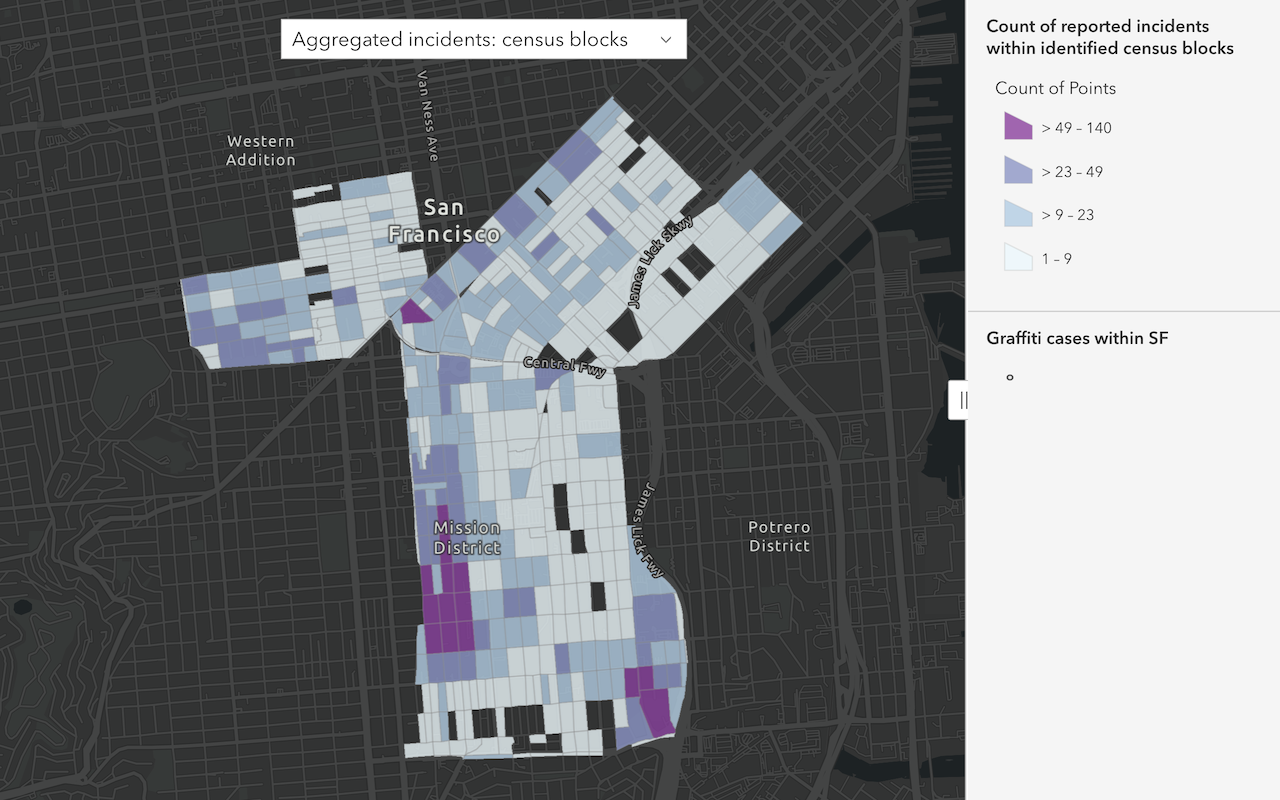
What is an aggregate analysis?
An aggregate analysis is the process of finding which points fall inside polygons using a point-in-polygon spatial relationship. Feature geometry and attribute statistics are also generated for the number of points in each polygon. To execute the analysis, use the spatial analysis service and the Aggregate operation.

Real-world examples of this analysis include the following:
- Simplifying the visualization of high-density point data.
- Aggregating tornado data into state and county boundaries and normalize by population to find the areas most affected by tornadoes.
- Aggregate construction permit points in each zipcode to predict future growth.
How to perform an aggregate analysis
The general steps to performing an aggregate points analysis are as follows:
- Review the parameters for the
Aggregateoperation.Points - Send a request to get the spatial analysis service URL.
- Execute a job request with the following URL and parameters:
- URL:
https://< YOUR_ ANALYSIS_ SERVICE>/arcgis/rest/services/tasks/GPServer/Aggregate Points/submit Job - Parameters:
point: The point features that will be aggregated into the polygons in theLayer polygon.Layer polygon: The polygon features into which the input points will be aggregated.Layer output: A string representing the name of the hosted feature layer to reutrn with the results.Name
- URL:
- Check the status.
- Get the output layer results.
To see examples using ArcGIS API for Python, ArcGIS REST JS, and the ArcGIS REST API, go to Examples below.
URL Request
http://<YOUR_ANALYSIS_SERVICE>/arcgis/rest/services/tasks/GPServer/AggregatePoints/submitJob?Required parameters
Name | Description | Examples |
|---|---|---|
f | The format of the data returned | f=json f=pjson |
token | An OAuth 2.0 access token. Learn how to get an access token in Security and authentication. | token=< |
point | The point features aggregated into the polygons in the polygon. | {"url": < {"layer |
Key parameters
| Name | Description | Examples |
|---|---|---|
polygon | The polygon features (areas) into which the input points will be aggregated. | {"url": <feature service layer url> {"layer |
keep | A Boolean value that specifies whether the polygons that have no points within them should be returned in the output. The default is true. | true | false |
summary | A list of field names and statistical summary type that you want to calculate for all points within each polygon. Note that the count of points within each polygon is always returned. | "summary |
group | A field name in the pointLayer. Points that have the same value for the group by field will have their own counts and summary field statistics. You can create statistical groups using an attribute in the analysis layer. For example, if you are aggregating crimes to neighborhood boundaries, you may have a Crime_ attribute with five crime types. Each unique crime type forms a group, and the statistics you choose will be calculated for each unique value of Crime_. | "group |
output | A string representing the name of the hosted feature layer to return with the results. NOTE: If you do not include this parameter, the results are returned as a feature collection (JSON). | {"service |
Example
Find the number of breweries in counties
This example uses the Aggregate operation to summarize Brewery locations in USA counties. The results can be visualized by rendering the layer based on the calculated count of breweries in each county.
In the analysis, the polygon value is the USA Counties hosted feature layer provided by the ArcGIS Living Atlas of the World.
The point value is a hosted feature layer for brewery locations across the United States. The group parameter is set to use the brewery_ field from the point so statistics will be calculated for each unique type.
APIs
poly_layer = "https://services3.arcgis.com/GVgbJbqm8hXASVYi/arcgis/rest/services/Find_Locations_in_USA_Counties_Generalized_CONUS/FeatureServer/0"
pt_layer = "https://services3.arcgis.com/GVgbJbqm8hXASVYi/arcgis/rest/services/obdb/FeatureServer/0"
results = aggregate_points(
polygon_layer=poly_layer,
point_layer=pt_layer,
keep_boundaries_with_no_points=False,
minority_majority=True,
percent_points=True,
# Outputs results as a hosted feature layer.
output_name="Aggregate points result",
)
print(f"New item created: {results.itemid}")Service requests
Request
POST arcgis.com/sharing/rest/portals/self HTTP/1.1
Content-Type: application/x-www-form-urlencoded
&f=json
&token=<ACCESS_TOKEN>Response (JSON)
{
"helperServices": {
// Other parameters
"analysis": {
"url": "https://<YOUR_ANALYSIS_SERVICE>/arcgis/rest/services/tasks/GPServer"
},
"geoenrichment": {
"url": "https://geoenrich.arcgis.com/arcgis/rest/services/World/GeoenrichmentServer"
}
}
}Request
POST <YOUR_ANALYSIS_SERVICE>/arcgis/rest/services/tasks/GPServer/AggregatePoints/submitJob HTTP/1.1
Content-Type: application/x-www-form-urlencoded
f=json
&token=<ACCESS_TOKEN>
&polygonLayer={"url":"https://services3.arcgis.com/GVgbJbqm8hXASVYi/arcgis/rest/services/Find_Locations_in_USA_Counties_Generalized_CONUS/FeatureServer/0"}
&pointLayer={"url":"https://services3.arcgis.com/GVgbJbqm8hXASVYi/arcgis/rest/services/obdb/FeatureServer/0"}
&keepBoundariesWithNoPoints=false
&groupByField=brewery_type
&minorityMajority=true
&percentPoints=true
&outputName={"serviceProperties":{"name":"Aggregate points results"}}
Response (JSON)
{
"jobId": "<JOB_ID>",
"jobStatus": "esriJobSubmitted",
"results": {},
"inputs": {},
"messages": []
}
Request
POST <YOUR_ANALYSIS_SERVICE>/arcgis/rest/services/tasks/GPServer/AggregatePoints/jobs/<JOB_ID> HTTP/1.1
Content-Type: application/x-www-form-urlencoded
f=json
&token=<ACCESS_TOKEN>
Response (JSON)
{
"jobId": "<JOB_ID>",
"jobStatus": "esriJobSucceeded",
"results": {
"aggregatedLayer": {
"paramUrl": "results/aggregatedLayer"
},
"groupSummary": {
"paramUrl": "results/groupSummary"
}
},
"inputs": {},
"messages": []
}
Request
POST <YOUR_ANALYSIS_SERVICE>/arcgis/rest/services/tasks/GPServer/AggregatePoints/jobs/<JOB_ID>/results/aggregatedLayer HTTP/1.1
Content-Type: application/x-www-form-urlencoded
f=json
&token=<ACCESS_TOKEN>Response (JSON)
{
"paramName": "aggregatedLayer",
"dataType": "GPString",
"value": {
"featureSet": {
"features": [
{
"attributes": {
"OBJECTID_1": 5,
"OBJECTID": 1203,
"NAME": "Ward",
"STATE_NAME": "North Dakota",
"STATE_FIPS": "38",
"CNTY_FIPS": "101",
"FIPS": "38101",
"POPULATION": 75147,
"POP_SQMI": 36.6,
"POP2010": 61675,
"POP10_SQMI": 30,
"WHITE": 55718,
"BLACK": 1542,
"AMERI_ES": 1630,
"ASIAN": 583,
"HAWN_PI": 84,
"HISPANIC": 1869,
"OTHER": 428,
"MULT_RACE": 1690,
"MALES": 31250,
"FEMALES": 30425,
"AGE_UNDER5": 4794,
"AGE_5_9": 3907,
"AGE_10_14": 3622,
"AGE_15_19": 4245,
"AGE_20_24": 6458,
"AGE_25_34": 9486,
"AGE_35_44": 6880,
"AGE_45_54": 7883,
"AGE_55_64": 6374,
"AGE_65_74": 3891,
"AGE_75_84": 2754,
"AGE_85_UP": 1381,
"MED_AGE": 32.9,
"MED_AGE_M": 31.3,
"MED_AGE_F": 34.7,
"HOUSEHOLDS": 25029,
"AVE_HH_SZ": 2.36,
"HSEHLD_1_M": 3659,
"HSEHLD_1_F": 3859,
"MARHH_CHD": 5457,
"MARHH_NO_C": 7022,
"MHH_CHILD": 606,
"FHH_CHILD": 1500,
"FAMILIES": 15597,
"AVE_FAM_SZ": 2.95,
"HSE_UNITS": 26744,
"VACANT": 1715,
"OWNER_OCC": 15920,
"RENTER_OCC": 9109,
"NO_FARMS12": 961,
"AVE_SIZE12": 1117,
"CROP_ACR12": 829363,
"AVE_SALE12": 285596,
"SQMI": 2055.85,
"Shape_Leng": 4.40857096756,
"Shape_Length": 596478.7058866643,
"Shape_Area": 1.1921048656121477e10,
"Point_Count": 2,
"Minority_brewery_type": "brewpub;micro",
"Majority_brewery_type": "brewpub;micro",
"Minority_brewery_type_Percent": 50,
"Majority_brewery_type_Percent": 50,
"Join_ID": 5,
"AnalysisArea": 2044.3497263130587
},
"geometry": {
"rings": [
[
[-1.1239339627088098e7, 6082615.14821779],
[-1.1340982394188097e7, 6082598.725017779],
[-1.1340962925488098e7, 6110923.25681778],
[-1.1345394595388101e7, 6111176.63941779],
[-1.13455623573881e7, 6170101.040617786],
[-1.13514556744881e7, 6170308.897017777],
[-1.1352084042188097e7, 6198297.232017785],
[-1.1380655643488102e7, 6198726.410517782],
[-1.13806574831881e7, 6227904.489317782],
[-1.1372068383488102e7, 6227893.247817785],
[-1.1371813692788102e7, 6241389.041017786],
[-1.1356743460288096e7, 6241389.846517779],
[-1.1356625321688097e7, 6228508.746717788],
[-1.1337406511488099e7, 6227845.510917783],
[-1.1337467558788097e7, 6183928.661217779],
[-1.1250093167988101e7, 6183779.345817789],
[-1.1250171313888103e7, 6168683.559017785],
[-1.1245033718588099e7, 6168519.978917778],
[-1.1244331437788099e7, 6110494.663617782],
[-1.1239226995688103e7, 6110176.560717776],
[-1.1239339627088098e7, 6082615.14821779]
]
]
}
},
{
"attributes": {
"OBJECTID_1": 6,
"OBJECTID": 3,
"NAME": "Anchorage",
"STATE_NAME": "Alaska",
"STATE_FIPS": "02",
"CNTY_FIPS": "020",
"FIPS": "02020",
"POPULATION": 303152,
"POP_SQMI": 174.9,
"POP2010": 291826,
"POP10_SQMI": 168.4,
"WHITE": 192498,
"BLACK": 16226,
"AMERI_ES": 23130,
"ASIAN": 23580,
"HAWN_PI": 5901,
"HISPANIC": 22061,
"OTHER": 6846,
"MULT_RACE": 23645,
"MALES": 148209,
"FEMALES": 143617,
"AGE_UNDER5": 21961,
"AGE_5_9": 20618,
"AGE_10_14": 20443,
"AGE_15_19": 21187,
"AGE_20_24": 24379,
"AGE_25_34": 45440,
"AGE_35_44": 39062,
"AGE_45_54": 44569,
"AGE_55_64": 33028,
"AGE_65_74": 13309,
"AGE_75_84": 5868,
"AGE_85_UP": 1962,
"MED_AGE": 33,
"MED_AGE_M": 32.4,
"MED_AGE_F": 33.7,
"HOUSEHOLDS": 107332,
"AVE_HH_SZ": 2.64,
"HSEHLD_1_M": 14034,
"HSEHLD_1_F": 12727,
"MARHH_CHD": 25454,
"MARHH_NO_C": 26538,
"MHH_CHILD": 3866,
"FHH_CHILD": 8955,
"FAMILIES": 70544,
"AVE_FAM_SZ": 3.19,
"HSE_UNITS": 113032,
"VACANT": 5700,
"OWNER_OCC": 64285,
"RENTER_OCC": 43047,
"NO_FARMS12": 291,
"AVE_SIZE12": 125,
"CROP_ACR12": 17148,
"AVE_SALE12": 103158,
"SQMI": 1733.41,
"Shape_Leng": 4.16679173319,
"Shape_Length": 604125.1265445987,
"Shape_Area": 1.9718437880317596e10,
"Point_Count": 17,
"Minority_brewery_type": "contract;planning",
"Majority_brewery_type": "micro",
"Minority_brewery_type_Percent": 5.88235294117647,
"Majority_brewery_type_Percent": 47.05882352941176,
"Join_ID": 6,
"AnalysisArea": 1777.823094232901
},
"geometry": {
"rings": [
[
[-1.6526492172188103e7, 8724528.080817789],
[-1.65279917417881e7, 8591605.714317791],
[-1.6558333306488097e7, 8590580.85511779],
[-1.6558281243788099e7, 8564972.483817779],
[-1.6591378698488103e7, 8565180.844217785],
[-1.65900835733881e7, 8590858.288017787],
[-1.65899697597881e7, 8590820.79681778],
[-1.6604875205988096e7, 8613009.068917781],
[-1.66259618016881e7, 8609194.21761778],
[-1.6705314355588103e7, 8661242.740917787],
[-1.6663292046588099e7, 8716833.635117784],
[-1.6613842959488101e7, 8739719.463517785],
[-1.6547489088388102e7, 8724541.766017787],
[-1.6543167852688102e7, 8724507.173317783],
[-1.65387174117881e7, 8724603.186817788],
[-1.6536459905988105e7, 8724586.378617778],
[-1.6526492172188103e7, 8724528.080817789]
]
]
}
},
{
"attributes": {
"OBJECTID_1": 9,
"OBJECTID": 1205,
"NAME": "Williams",
"STATE_NAME": "North Dakota",
"STATE_FIPS": "38",
"CNTY_FIPS": "105",
"FIPS": "38105",
"POPULATION": 40962,
"POP_SQMI": 19.1,
"POP2010": 22398,
"POP10_SQMI": 10.4,
"WHITE": 20639,
"BLACK": 63,
"AMERI_ES": 899,
"ASIAN": 79,
"HAWN_PI": 5,
"HISPANIC": 436,
"OTHER": 69,
"MULT_RACE": 644,
"MALES": 11548,
"FEMALES": 10850,
"AGE_UNDER5": 1546,
"AGE_5_9": 1329,
"AGE_10_14": 1405,
"AGE_15_19": 1435,
"AGE_20_24": 1429,
"AGE_25_34": 3136,
"AGE_35_44": 2403,
"AGE_45_54": 3499,
"AGE_55_64": 2888,
"AGE_65_74": 1582,
"AGE_75_84": 1140,
"AGE_85_UP": 606,
"MED_AGE": 38.9,
"MED_AGE_M": 37.3,
"MED_AGE_F": 40.7,
"HOUSEHOLDS": 9293,
"AVE_HH_SZ": 2.35,
"HSEHLD_1_M": 1583,
"HSEHLD_1_F": 1340,
"MARHH_CHD": 1856,
"MARHH_NO_C": 2771,
"MHH_CHILD": 257,
"FHH_CHILD": 485,
"FAMILIES": 5746,
"AVE_FAM_SZ": 2.95,
"HSE_UNITS": 10464,
"VACANT": 1171,
"OWNER_OCC": 6442,
"RENTER_OCC": 2851,
"NO_FARMS12": 758,
"AVE_SIZE12": 1403,
"CROP_ACR12": 739086,
"AVE_SALE12": 235756,
"SQMI": 2148.32,
"Shape_Leng": 3.89612706352,
"Shape_Length": 519301.9341447212,
"Shape_Area": 1.2731302201576689e10,
"Point_Count": 1,
"Minority_brewery_type": "micro",
"Majority_brewery_type": "micro",
"Minority_brewery_type_Percent": 100,
"Majority_brewery_type_Percent": 100,
"Join_ID": 9,
"AnalysisArea": 2172.660335438362
},
"geometry": {
"rings": [
[
[-1.1446477746488096e7, 6128072.764917776],
[-1.1450074516488098e7, 6129655.20311778],
[-1.14555185595881e7, 6127722.458217777],
[-1.1462194892688097e7, 6130182.3816177845],
[-1.1479433280188099e7, 6131205.090817779],
[-1.1489935019588098e7, 6127301.46451778],
[-1.1492214583488101e7, 6124707.69251778],
[-1.1492483858388098e7, 6119256.22921779],
[-1.14936966681881e7, 6118115.492517784],
[-1.15068917566881e7, 6113685.777417779],
[-1.1512762283388097e7, 6112879.901517779],
[-1.1521203729888102e7, 6109171.9865177795],
[-1.1525768808988104e7, 6113490.263417788],
[-1.1529370780688096e7, 6115118.19091779],
[-1.1528518020988096e7, 6120640.810217783],
[-1.1532328894988101e7, 6127187.915317789],
[-1.1531267221488101e7, 6129027.816117786],
[-1.1532921704588098e7, 6129496.74051778],
[-1.1536095670188101e7, 6126818.933817789],
[-1.15424953526881e7, 6126765.4534177855],
[-1.1547177705388103e7, 6121863.106017783],
[-1.1546207787388101e7, 6118712.32381779],
[-1.1547114876088103e7, 6117333.999617785],
[-1.1550729609688096e7, 6115732.24931778],
[-1.1554414853988098e7, 6115894.210517786],
[-1.15535986557881e7, 6110982.846717782],
[-1.1555186059588099e7, 6106769.775517784],
[-1.1558119630388096e7, 6105089.370517783],
[-1.1559466673888102e7, 6108694.10421779],
[-1.1561045565888098e7, 6108466.844417788],
[-1.15627051353881e7, 6103871.77131778],
[-1.15662400218881e7, 6100811.816317789],
[-1.1569019019388098e7, 6100508.634917781],
[-1.1572247331288101e7, 6104339.821717791],
[-1.1576380159988102e7, 6102961.840217784],
[-1.1579385117988102e7, 6105950.123317786],
[-1.1582617708788097e7, 6106868.360417791],
[-1.1583028068488099e7, 6172154.8208177835],
[-1.15830510087881e7, 6214977.54391779],
[-1.1453107789488101e7, 6213454.057517782],
[-1.1452890496488102e7, 6199305.63151779],
[-1.1452622207688097e7, 6170012.898617789],
[-1.1446573469588103e7, 6170092.7404177785],
[-1.1446477746488096e7, 6128072.764917776]
]
]
}
},
{ "results trimmed": "..." }
],
"geometryType": "esriGeometryPolygon",
"spatialReference": {
"wkid": 102100,
"latestWkid": 3857
}
},
"layerDefinition": {
"geometryType": "esriGeometryPolygon",
"spatialReference": {
"wkid": 102100,
"latestWkid": 3857
},
"objectIdField": "OBJECTID_1",
"type": "Feature Layer",
"fields": [
{
"name": "OBJECTID_1",
"type": "esriFieldTypeOID",
"alias": "FID"
},
{
"name": "OBJECTID",
"type": "esriFieldTypeInteger",
"alias": "OBJECTID"
},
{
"name": "NAME",
"type": "esriFieldTypeString",
"alias": "NAME",
"length": 32
},
{
"name": "STATE_NAME",
"type": "esriFieldTypeString",
"alias": "STATE_NAME",
"length": 35
},
{
"name": "STATE_FIPS",
"type": "esriFieldTypeString",
"alias": "STATE_FIPS",
"length": 2
},
{
"name": "CNTY_FIPS",
"type": "esriFieldTypeString",
"alias": "CNTY_FIPS",
"length": 3
},
{
"name": "FIPS",
"type": "esriFieldTypeString",
"alias": "FIPS",
"length": 5
},
{
"name": "POPULATION",
"type": "esriFieldTypeInteger",
"alias": "POPULATION"
},
{
"name": "POP_SQMI",
"type": "esriFieldTypeDouble",
"alias": "POP_SQMI"
},
{
"name": "POP2010",
"type": "esriFieldTypeInteger",
"alias": "POP2010"
},
{
"name": "POP10_SQMI",
"type": "esriFieldTypeDouble",
"alias": "POP10_SQMI"
},
{
"name": "WHITE",
"type": "esriFieldTypeInteger",
"alias": "WHITE"
},
{
"name": "BLACK",
"type": "esriFieldTypeInteger",
"alias": "BLACK"
},
{
"name": "AMERI_ES",
"type": "esriFieldTypeInteger",
"alias": "AMERI_ES"
},
{
"name": "ASIAN",
"type": "esriFieldTypeInteger",
"alias": "ASIAN"
},
{
"name": "HAWN_PI",
"type": "esriFieldTypeInteger",
"alias": "HAWN_PI"
},
{
"name": "HISPANIC",
"type": "esriFieldTypeInteger",
"alias": "HISPANIC"
},
{
"name": "OTHER",
"type": "esriFieldTypeInteger",
"alias": "OTHER"
},
{
"name": "MULT_RACE",
"type": "esriFieldTypeInteger",
"alias": "MULT_RACE"
},
{
"name": "MALES",
"type": "esriFieldTypeInteger",
"alias": "MALES"
},
{
"name": "FEMALES",
"type": "esriFieldTypeInteger",
"alias": "FEMALES"
},
{
"name": "AGE_UNDER5",
"type": "esriFieldTypeInteger",
"alias": "AGE_UNDER5"
},
{
"name": "AGE_5_9",
"type": "esriFieldTypeInteger",
"alias": "AGE_5_9"
},
{
"name": "AGE_10_14",
"type": "esriFieldTypeInteger",
"alias": "AGE_10_14"
},
{
"name": "AGE_15_19",
"type": "esriFieldTypeInteger",
"alias": "AGE_15_19"
},
{
"name": "AGE_20_24",
"type": "esriFieldTypeInteger",
"alias": "AGE_20_24"
},
{
"name": "AGE_25_34",
"type": "esriFieldTypeInteger",
"alias": "AGE_25_34"
},
{
"name": "AGE_35_44",
"type": "esriFieldTypeInteger",
"alias": "AGE_35_44"
},
{
"name": "AGE_45_54",
"type": "esriFieldTypeInteger",
"alias": "AGE_45_54"
},
{
"name": "AGE_55_64",
"type": "esriFieldTypeInteger",
"alias": "AGE_55_64"
},
{
"name": "AGE_65_74",
"type": "esriFieldTypeInteger",
"alias": "AGE_65_74"
},
{
"name": "AGE_75_84",
"type": "esriFieldTypeInteger",
"alias": "AGE_75_84"
},
{
"name": "AGE_85_UP",
"type": "esriFieldTypeInteger",
"alias": "AGE_85_UP"
},
{
"name": "MED_AGE",
"type": "esriFieldTypeDouble",
"alias": "MED_AGE"
},
{
"name": "MED_AGE_M",
"type": "esriFieldTypeDouble",
"alias": "MED_AGE_M"
},
{
"name": "MED_AGE_F",
"type": "esriFieldTypeDouble",
"alias": "MED_AGE_F"
},
{
"name": "HOUSEHOLDS",
"type": "esriFieldTypeInteger",
"alias": "HOUSEHOLDS"
},
{
"name": "AVE_HH_SZ",
"type": "esriFieldTypeDouble",
"alias": "AVE_HH_SZ"
},
{
"name": "HSEHLD_1_M",
"type": "esriFieldTypeInteger",
"alias": "HSEHLD_1_M"
},
{
"name": "HSEHLD_1_F",
"type": "esriFieldTypeInteger",
"alias": "HSEHLD_1_F"
},
{
"name": "MARHH_CHD",
"type": "esriFieldTypeInteger",
"alias": "MARHH_CHD"
},
{
"name": "MARHH_NO_C",
"type": "esriFieldTypeInteger",
"alias": "MARHH_NO_C"
},
{
"name": "MHH_CHILD",
"type": "esriFieldTypeInteger",
"alias": "MHH_CHILD"
},
{
"name": "FHH_CHILD",
"type": "esriFieldTypeInteger",
"alias": "FHH_CHILD"
},
{
"name": "FAMILIES",
"type": "esriFieldTypeInteger",
"alias": "FAMILIES"
},
{
"name": "AVE_FAM_SZ",
"type": "esriFieldTypeDouble",
"alias": "AVE_FAM_SZ"
},
{
"name": "HSE_UNITS",
"type": "esriFieldTypeInteger",
"alias": "HSE_UNITS"
},
{
"name": "VACANT",
"type": "esriFieldTypeInteger",
"alias": "VACANT"
},
{
"name": "OWNER_OCC",
"type": "esriFieldTypeInteger",
"alias": "OWNER_OCC"
},
{
"name": "RENTER_OCC",
"type": "esriFieldTypeInteger",
"alias": "RENTER_OCC"
},
{
"name": "NO_FARMS12",
"type": "esriFieldTypeDouble",
"alias": "NO_FARMS12"
},
{
"name": "AVE_SIZE12",
"type": "esriFieldTypeDouble",
"alias": "AVE_SIZE12"
},
{
"name": "CROP_ACR12",
"type": "esriFieldTypeDouble",
"alias": "CROP_ACR12"
},
{
"name": "AVE_SALE12",
"type": "esriFieldTypeDouble",
"alias": "AVE_SALE12"
},
{
"name": "SQMI",
"type": "esriFieldTypeDouble",
"alias": "SQMI"
},
{
"name": "Shape_Leng",
"type": "esriFieldTypeDouble",
"alias": "Shape_Leng"
},
{
"name": "Shape_Length",
"type": "esriFieldTypeDouble",
"alias": "Shape_Length"
},
{
"name": "Shape_Area",
"type": "esriFieldTypeDouble",
"alias": "Shape_Area"
},
{
"name": "Point_Count",
"type": "esriFieldTypeInteger",
"alias": "Count of Points"
},
{
"name": "Minority_brewery_type",
"type": "esriFieldTypeString",
"alias": "Minority brewery type",
"length": 10000
},
{
"name": "Majority_brewery_type",
"type": "esriFieldTypeString",
"alias": "Majority brewery type",
"length": 10000
},
{
"name": "Minority_brewery_type_Percent",
"type": "esriFieldTypeDouble",
"alias": "Minority brewery type Percent"
},
{
"name": "Majority_brewery_type_Percent",
"type": "esriFieldTypeDouble",
"alias": "Majority brewery type Percent"
},
{
"name": "Join_ID",
"type": "esriFieldTypeInteger",
"alias": "JOIN ID"
},
{
"name": "AnalysisArea",
"type": "esriFieldTypeDouble",
"alias": "Area in Square Miles"
}
],
"drawingInfo": {
"renderer": {
"type": "classBreaks",
"authoringInfo": {
"type": "classedSize",
"classificationMethod": "esriClassifyNaturalBreaks"
},
"field": "Point_Count",
"classificationMethod": "esriClassifyNaturalBreaks",
"backgroundFillSymbol": {
"type": "esriSFS",
"style": "esriSFSSolid",
"color": [166, 166, 166, 0],
"outline": {
"type": "esriSLS",
"style": "esriSLSSolid",
"color": [0, 0, 0, 255],
"width": 1.5
}
},
"minValue": 1,
"classBreakInfos": [
{
"symbol": {
"type": "esriSMS",
"style": "esriSMSCircle",
"color": [204, 113, 179, 255],
"size": 8,
"angle": 0,
"xoffset": 0,
"yoffset": 0,
"outline": {
"color": [0, 0, 0, 255],
"width": 0
}
},
"classMaxValue": 5,
"label": "1 - 5"
},
{
"symbol": {
"type": "esriSMS",
"style": "esriSMSCircle",
"color": [204, 113, 179, 255],
"size": 10.8,
"angle": 0,
"xoffset": 0,
"yoffset": 0,
"outline": {
"color": [0, 0, 0, 255],
"width": 0
}
},
"classMaxValue": 16,
"label": "6 - 16"
},
{
"symbol": {
"type": "esriSMS",
"style": "esriSMSCircle",
"color": [204, 113, 179, 255],
"size": 13.6,
"angle": 0,
"xoffset": 0,
"yoffset": 0,
"outline": {
"color": [0, 0, 0, 255],
"width": 0
}
},
"classMaxValue": 36,
"label": "17 - 36"
},
{
"symbol": {
"type": "esriSMS",
"style": "esriSMSCircle",
"color": [204, 113, 179, 255],
"size": 16.400000000000002,
"angle": 0,
"xoffset": 0,
"yoffset": 0,
"outline": {
"color": [0, 0, 0, 255],
"width": 0
}
},
"classMaxValue": 87,
"label": "37 - 87"
},
{
"symbol": {
"type": "esriSMS",
"style": "esriSMSCircle",
"color": [204, 113, 179, 255],
"size": 22,
"angle": 0,
"xoffset": 0,
"yoffset": 0,
"outline": {
"color": [0, 0, 0, 255],
"width": 0
}
},
"classMaxValue": 169,
"label": "88 - 169"
}
],
"legendOptions": {
"order": "ascendingValues"
}
},
"transparency": 25
},
"id": 0,
"relationships": [
{
"name": "groupBySummary",
"relatedTableId": 1,
"cardinality": "esriRelCardinalityOneToMany",
"role": "esriRelRoleOrigin",
"keyField": "Join_ID",
"composite": true
}
]
},
"popupInfo": {
"title": "Summary of obdb",
"showAttachments": false,
"fieldInfos": [
{
"fieldName": "Point_Count",
"label": "Count of Points",
"tooltip": "Count of Points",
"visible": true,
"stringFieldOption": "textbox",
"isEditable": true
},
{
"fieldName": "Minority_brewery_type",
"label": "Minority brewery type",
"tooltip": "Minority brewery type",
"visible": true,
"stringFieldOption": "textbox",
"isEditable": true
},
{
"fieldName": "Majority_brewery_type",
"label": "Majority brewery type",
"tooltip": "Majority brewery type",
"visible": true,
"stringFieldOption": "textbox",
"isEditable": true
},
{
"fieldName": "Minority_brewery_type_Percent",
"label": "Minority brewery type Percent",
"tooltip": "Minority brewery type Percent",
"visible": true,
"stringFieldOption": "textbox",
"isEditable": true,
"format": {
"places": 4,
"digitSeparator": true
}
},
{
"fieldName": "Majority_brewery_type_Percent",
"label": "Majority brewery type Percent",
"tooltip": "Majority brewery type Percent",
"visible": true,
"stringFieldOption": "textbox",
"isEditable": true,
"format": {
"places": 4,
"digitSeparator": true
}
},
{
"fieldName": "OBJECTID",
"label": "OBJECTID",
"tooltip": "OBJECTID",
"visible": true,
"stringFieldOption": "textbox",
"isEditable": false
},
{
"fieldName": "NAME",
"label": "NAME",
"tooltip": "NAME",
"visible": true,
"stringFieldOption": "textbox",
"isEditable": true
},
{
"fieldName": "STATE_NAME",
"label": "STATE NAME",
"tooltip": "STATE NAME",
"visible": true,
"stringFieldOption": "textbox",
"isEditable": true
},
{
"fieldName": "STATE_FIPS",
"label": "STATE FIPS",
"tooltip": "STATE FIPS",
"visible": true,
"stringFieldOption": "textbox",
"isEditable": true
},
{
"fieldName": "CNTY_FIPS",
"label": "CNTY FIPS",
"tooltip": "CNTY FIPS",
"visible": true,
"stringFieldOption": "textbox",
"isEditable": true
},
{
"fieldName": "FIPS",
"label": "FIPS",
"tooltip": "FIPS",
"visible": true,
"stringFieldOption": "textbox",
"isEditable": true
},
{
"fieldName": "POPULATION",
"label": "POPULATION",
"tooltip": "POPULATION",
"visible": true,
"stringFieldOption": "textbox",
"isEditable": true
},
{
"fieldName": "POP_SQMI",
"label": "POP SQMI",
"tooltip": "POP SQMI",
"visible": true,
"stringFieldOption": "textbox",
"isEditable": true,
"format": {
"places": 4,
"digitSeparator": true
}
},
{
"fieldName": "POP2010",
"label": "POP2010",
"tooltip": "POP2010",
"visible": true,
"stringFieldOption": "textbox",
"isEditable": true
},
{
"fieldName": "POP10_SQMI",
"label": "POP10 SQMI",
"tooltip": "POP10 SQMI",
"visible": true,
"stringFieldOption": "textbox",
"isEditable": true,
"format": {
"places": 4,
"digitSeparator": true
}
},
{
"fieldName": "WHITE",
"label": "WHITE",
"tooltip": "WHITE",
"visible": true,
"stringFieldOption": "textbox",
"isEditable": true
},
{
"fieldName": "BLACK",
"label": "BLACK",
"tooltip": "BLACK",
"visible": true,
"stringFieldOption": "textbox",
"isEditable": true
},
{
"fieldName": "AMERI_ES",
"label": "AMERI ES",
"tooltip": "AMERI ES",
"visible": true,
"stringFieldOption": "textbox",
"isEditable": true
},
{
"fieldName": "ASIAN",
"label": "ASIAN",
"tooltip": "ASIAN",
"visible": true,
"stringFieldOption": "textbox",
"isEditable": true
},
{
"fieldName": "HAWN_PI",
"label": "HAWN PI",
"tooltip": "HAWN PI",
"visible": true,
"stringFieldOption": "textbox",
"isEditable": true
},
{
"fieldName": "HISPANIC",
"label": "HISPANIC",
"tooltip": "HISPANIC",
"visible": true,
"stringFieldOption": "textbox",
"isEditable": true
},
{
"fieldName": "OTHER",
"label": "OTHER",
"tooltip": "OTHER",
"visible": true,
"stringFieldOption": "textbox",
"isEditable": true
},
{
"fieldName": "MULT_RACE",
"label": "MULT RACE",
"tooltip": "MULT RACE",
"visible": true,
"stringFieldOption": "textbox",
"isEditable": true
},
{
"fieldName": "MALES",
"label": "MALES",
"tooltip": "MALES",
"visible": true,
"stringFieldOption": "textbox",
"isEditable": true
},
{
"fieldName": "FEMALES",
"label": "FEMALES",
"tooltip": "FEMALES",
"visible": true,
"stringFieldOption": "textbox",
"isEditable": true
},
{
"fieldName": "AGE_UNDER5",
"label": "AGE UNDER5",
"tooltip": "AGE UNDER5",
"visible": true,
"stringFieldOption": "textbox",
"isEditable": true
},
{
"fieldName": "AGE_5_9",
"label": "AGE 5 9",
"tooltip": "AGE 5 9",
"visible": true,
"stringFieldOption": "textbox",
"isEditable": true
},
{
"fieldName": "AGE_10_14",
"label": "AGE 10 14",
"tooltip": "AGE 10 14",
"visible": true,
"stringFieldOption": "textbox",
"isEditable": true
},
{
"fieldName": "AGE_15_19",
"label": "AGE 15 19",
"tooltip": "AGE 15 19",
"visible": true,
"stringFieldOption": "textbox",
"isEditable": true
},
{
"fieldName": "AGE_20_24",
"label": "AGE 20 24",
"tooltip": "AGE 20 24",
"visible": true,
"stringFieldOption": "textbox",
"isEditable": true
},
{
"fieldName": "AGE_25_34",
"label": "AGE 25 34",
"tooltip": "AGE 25 34",
"visible": true,
"stringFieldOption": "textbox",
"isEditable": true
},
{
"fieldName": "AGE_35_44",
"label": "AGE 35 44",
"tooltip": "AGE 35 44",
"visible": true,
"stringFieldOption": "textbox",
"isEditable": true
},
{
"fieldName": "AGE_45_54",
"label": "AGE 45 54",
"tooltip": "AGE 45 54",
"visible": true,
"stringFieldOption": "textbox",
"isEditable": true
},
{
"fieldName": "AGE_55_64",
"label": "AGE 55 64",
"tooltip": "AGE 55 64",
"visible": true,
"stringFieldOption": "textbox",
"isEditable": true
},
{
"fieldName": "AGE_65_74",
"label": "AGE 65 74",
"tooltip": "AGE 65 74",
"visible": true,
"stringFieldOption": "textbox",
"isEditable": true
},
{
"fieldName": "AGE_75_84",
"label": "AGE 75 84",
"tooltip": "AGE 75 84",
"visible": true,
"stringFieldOption": "textbox",
"isEditable": true
},
{
"fieldName": "AGE_85_UP",
"label": "AGE 85 UP",
"tooltip": "AGE 85 UP",
"visible": true,
"stringFieldOption": "textbox",
"isEditable": true
},
{
"fieldName": "MED_AGE",
"label": "MED AGE",
"tooltip": "MED AGE",
"visible": true,
"stringFieldOption": "textbox",
"isEditable": true,
"format": {
"places": 4,
"digitSeparator": true
}
},
{
"fieldName": "MED_AGE_M",
"label": "MED AGE M",
"tooltip": "MED AGE M",
"visible": true,
"stringFieldOption": "textbox",
"isEditable": true,
"format": {
"places": 4,
"digitSeparator": true
}
},
{
"fieldName": "MED_AGE_F",
"label": "MED AGE F",
"tooltip": "MED AGE F",
"visible": true,
"stringFieldOption": "textbox",
"isEditable": true,
"format": {
"places": 4,
"digitSeparator": true
}
},
{
"fieldName": "HOUSEHOLDS",
"label": "HOUSEHOLDS",
"tooltip": "HOUSEHOLDS",
"visible": true,
"stringFieldOption": "textbox",
"isEditable": true
},
{
"fieldName": "AVE_HH_SZ",
"label": "AVE HH SZ",
"tooltip": "AVE HH SZ",
"visible": true,
"stringFieldOption": "textbox",
"isEditable": true,
"format": {
"places": 4,
"digitSeparator": true
}
},
{
"fieldName": "HSEHLD_1_M",
"label": "HSEHLD 1 M",
"tooltip": "HSEHLD 1 M",
"visible": true,
"stringFieldOption": "textbox",
"isEditable": true
},
{
"fieldName": "HSEHLD_1_F",
"label": "HSEHLD 1 F",
"tooltip": "HSEHLD 1 F",
"visible": true,
"stringFieldOption": "textbox",
"isEditable": true
},
{
"fieldName": "MARHH_CHD",
"label": "MARHH CHD",
"tooltip": "MARHH CHD",
"visible": true,
"stringFieldOption": "textbox",
"isEditable": true
},
{
"fieldName": "MARHH_NO_C",
"label": "MARHH NO C",
"tooltip": "MARHH NO C",
"visible": true,
"stringFieldOption": "textbox",
"isEditable": true
},
{
"fieldName": "MHH_CHILD",
"label": "MHH CHILD",
"tooltip": "MHH CHILD",
"visible": true,
"stringFieldOption": "textbox",
"isEditable": true
},
{
"fieldName": "FHH_CHILD",
"label": "FHH CHILD",
"tooltip": "FHH CHILD",
"visible": true,
"stringFieldOption": "textbox",
"isEditable": true
},
{
"fieldName": "FAMILIES",
"label": "FAMILIES",
"tooltip": "FAMILIES",
"visible": true,
"stringFieldOption": "textbox",
"isEditable": true
},
{
"fieldName": "AVE_FAM_SZ",
"label": "AVE FAM SZ",
"tooltip": "AVE FAM SZ",
"visible": true,
"stringFieldOption": "textbox",
"isEditable": true,
"format": {
"places": 4,
"digitSeparator": true
}
},
{
"fieldName": "HSE_UNITS",
"label": "HSE UNITS",
"tooltip": "HSE UNITS",
"visible": true,
"stringFieldOption": "textbox",
"isEditable": true
},
{
"fieldName": "VACANT",
"label": "VACANT",
"tooltip": "VACANT",
"visible": true,
"stringFieldOption": "textbox",
"isEditable": true
},
{
"fieldName": "OWNER_OCC",
"label": "OWNER OCC",
"tooltip": "OWNER OCC",
"visible": true,
"stringFieldOption": "textbox",
"isEditable": true
},
{
"fieldName": "RENTER_OCC",
"label": "RENTER OCC",
"tooltip": "RENTER OCC",
"visible": true,
"stringFieldOption": "textbox",
"isEditable": true
},
{
"fieldName": "NO_FARMS12",
"label": "NO FARMS12",
"tooltip": "NO FARMS12",
"visible": true,
"stringFieldOption": "textbox",
"isEditable": true,
"format": {
"places": 4,
"digitSeparator": true
}
},
{
"fieldName": "AVE_SIZE12",
"label": "AVE SIZE12",
"tooltip": "AVE SIZE12",
"visible": true,
"stringFieldOption": "textbox",
"isEditable": true,
"format": {
"places": 4,
"digitSeparator": true
}
},
{
"fieldName": "CROP_ACR12",
"label": "CROP ACR12",
"tooltip": "CROP ACR12",
"visible": true,
"stringFieldOption": "textbox",
"isEditable": true,
"format": {
"places": 4,
"digitSeparator": true
}
},
{
"fieldName": "AVE_SALE12",
"label": "AVE SALE12",
"tooltip": "AVE SALE12",
"visible": true,
"stringFieldOption": "textbox",
"isEditable": true,
"format": {
"places": 4,
"digitSeparator": true
}
},
{
"fieldName": "SQMI",
"label": "SQMI",
"tooltip": "SQMI",
"visible": true,
"stringFieldOption": "textbox",
"isEditable": true,
"format": {
"places": 4,
"digitSeparator": true
}
},
{
"fieldName": "Shape_Leng",
"label": "Shape Leng",
"tooltip": "Shape Leng",
"visible": true,
"stringFieldOption": "textbox",
"isEditable": true,
"format": {
"places": 4,
"digitSeparator": true
}
},
{
"fieldName": "Shape_Length",
"label": "Shape Length",
"tooltip": "Shape Length",
"visible": true,
"stringFieldOption": "textbox",
"isEditable": true,
"format": {
"places": 4,
"digitSeparator": true
}
},
{
"fieldName": "Shape_Area",
"label": "Shape Area",
"tooltip": "Shape Area",
"visible": true,
"stringFieldOption": "textbox",
"isEditable": true,
"format": {
"places": 4,
"digitSeparator": true
}
},
{
"fieldName": "Join_ID",
"label": "JOIN ID",
"tooltip": "JOIN ID",
"visible": true,
"stringFieldOption": "textbox",
"isEditable": true
},
{
"fieldName": "relationships/0/brewery_type",
"label": "brewery_type",
"tooltip": "brewery_type",
"visible": false,
"stringFieldOption": "textbox",
"isEditable": true
},
{
"fieldName": "relationships/0/PercentCount",
"label": "Percent of point count",
"tooltip": "Percent of point count",
"visible": false,
"stringFieldOption": "textbox",
"isEditable": true
},
{
"fieldName": "relationships/0/Point_Count",
"label": "Count of Points",
"tooltip": "Count of Points",
"visible": false,
"stringFieldOption": "textbox",
"isEditable": true
}
],
"mediaInfos": [
{
"title": "Percent of point count by brewery_type",
"caption": "",
"value": {
"fields": ["relationships/0/PercentCount"],
"tooltipField": "relationships/0/brewery_type",
"normalizeField": ""
},
"type": "piechart"
}
]
}
}
}Tutorials
Learn how to perform related analyses interactively with Map Viewer and programmatically with ArcGIS API for Python, ArcGIS REST JS, and ArcGIS REST API.
Services
Spatial analysis service
Process spatial datasets to discover relationships and patterns.
API support
| Aggregate points | Summarize center and dispersion | Summarize nearby | Summarize within | |
|---|---|---|---|---|
| ArcGIS Maps SDK for JavaScript | 1 | 1 | 1 | 1 |
| ArcGIS Maps SDK for .NET | ||||
| ArcGIS Maps SDK for Kotlin | ||||
| ArcGIS Maps SDK for Swift | ||||
| ArcGIS Maps SDK for Java | ||||
| ArcGIS Maps SDK for Qt | ||||
| ArcGIS API for Python | ||||
| ArcGIS REST JS | 1 | 1 | 1 | 1 |
| Esri Leaflet | 2 | 2 | 2 | 2 |
| MapBox GL JS | 2 | 2 | 2 | 2 |
| OpenLayers | 2 | 2 | 2 | 2 |
- 1. Access with geoprocessing task
- 2. Access via ArcGIS REST JS
Tools
Developer dashboard
Manage API keys, service usage, and data with the ArcGIS Developers website.
ArcGIS.com
Create, manage, and share content and data with GIS tools.
Map Viewer
Create, explore, and share web maps for 2D applications.
ArcGIS Pro
Explore, visualize, and analyze both 2D and 3D data with desktop GIS tools.