What is a cluster analysis?
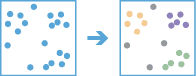
A cluster analysis is the process of finding clusters of point features within surrounding noise at a specified distance. To execute the analysis, use the spatial analysis service and the Find operation.
Real-world examples of this analysis include the following:
- Where are there clusters of traffic incidents?
- Where are there clusters of instect infestations?
- Where are there clusters of trees?
How to perform a point cluster analysis
- Review the parameters for the
Findoperation.Point Clusters - Send a request to get the spatial analysis service URL.
- Execute a job request with the following URL and parameters:
- URL:
https://< YOUR_ ANALYSIS_ SERVICE>/arcgis/rest/services/tasks/GPServer/Find Point Clusters/submit Job - Parameters:
analysis: Your dataset as a hosted feature layer or feature collection.Layer min: Define how many points constitute a cluster.Features Cluster output: A string representing the name of the hosted feature layer to reutrn with the results.Name
- URL:
- Check the status.
- Get the output layer results.
To see examples using ArcGIS API for Python, ArcGIS REST JS, and the ArcGIS REST API, go to Examples below.
URL request
http://<YOUR_ANALYSIS_SERVICE>/arcgis/rest/services/tasks/GPServer/FindPointClusters/submitJob?<parameters>Required parameters
| Name | Description | Examples |
|---|---|---|
f | The format of the data returned. | f=json f=pjson |
token | An OAuth 2.0 access token. Learn how to get an access token in Security and authentication. | token=< |
analysis | The point data. | {url: |
min | Define the minimum number of features to be considered a cluster. | 5 |
Key parameters
| Name | Description | Examples |
|---|---|---|
search | A double value to use as the maximum distance to search for neighboring features. | 200 |
search | Must be provided if search is specified. | Miles, Feet, Meters, Kilometers |
output | A string representing the name of the hosted feature layer to return with the results. NOTE: If you do not include this parameter, the results are returned as a feature collection (JSON). | {"service |
context | A bounding box or output spatial reference for the analysis. | "extent":{"xmin: |
Example
Find clusters of traffic crashes
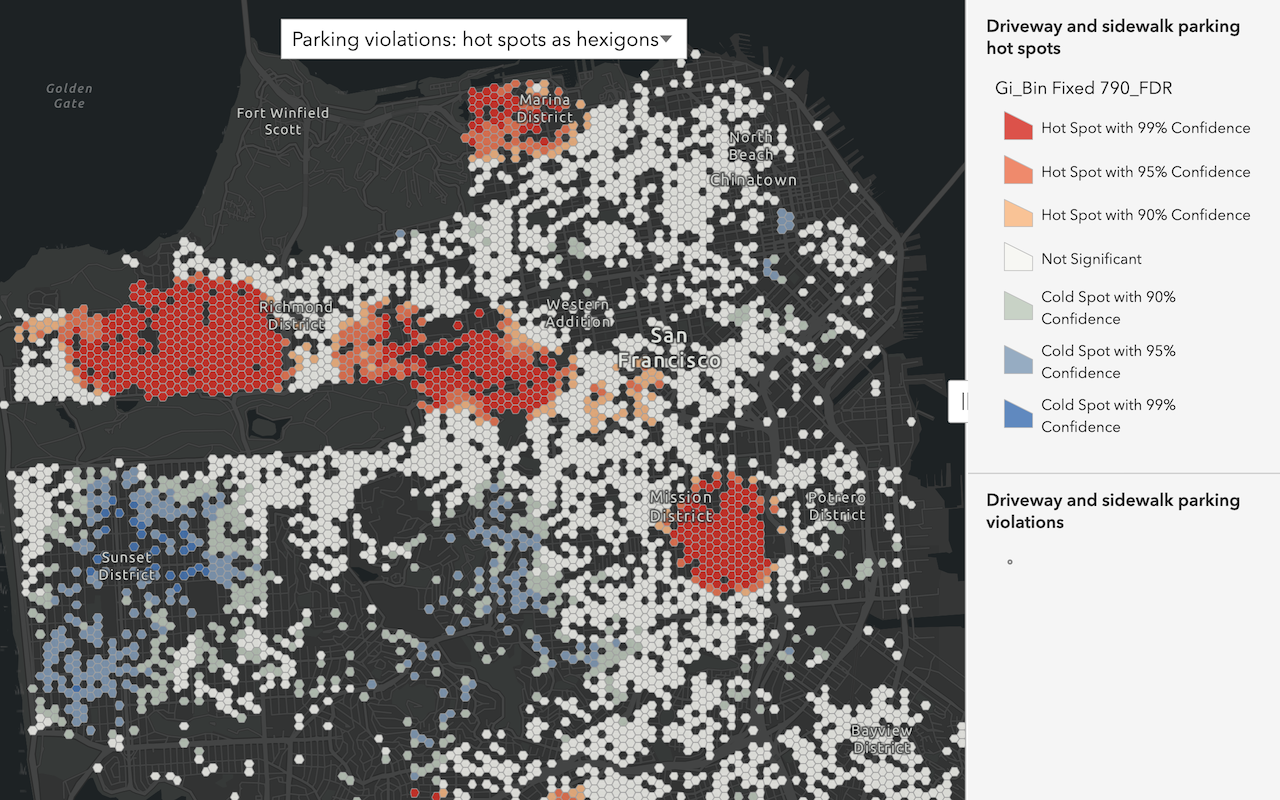
This example uses the Find operation to find where there are areas (clusters) of traffic crashes. The analysis value is the Traffic crashes hosted feature layer. The min is defined as 500. The results show four distinct colors that represent the four distinct clusters found in the analysis.
APIs
analysisLayer = "https://services3.arcgis.com/GVgbJbqm8hXASVYi/arcgis/rest/services/Traffic_Crashes/FeatureServer/0"
results = find_point_clusters(
analysis_layer=analysisLayer,
min_features_cluster=500,
#Ouputs results as a hosted feature service.
output_name="Find point clusters results",
)
result_features = results.layers[0].query()
print(
f"The find point clusters layer has {len(result_features.features)} new records"
)
Service requests
Request
POST arcgis.com/sharing/rest/portals/self HTTP/1.1
Content-Type: application/x-www-form-urlencoded
&f=json
&token=<ACCESS_TOKEN>Response (JSON)
{
"helperServices": {
// Other parameters
"analysis": {
"url": "https://<YOUR_ANALYSIS_SERVICE>/arcgis/rest/services/tasks/GPServer"
},
"geoenrichment": {
"url": "https://geoenrich.arcgis.com/arcgis/rest/services/World/GeoenrichmentServer"
}
}
}Request
POST <YOUR_ANALYSIS_SERVICE>/arcgis/rest/services/tasks/GPServer/FindPointClusters/submitJob HTTP/1.1
Content-Type: application/x-www-form-urlencoded
&f=json
&token=<ACCESS_TOKEN>
&analysisLayer={"url":"https://services3.arcgis.com/GVgbJbqm8hXASVYi/arcgis/rest/services/Traffic_Crashes/FeatureServer/0","name":"Traffic Crashes"}
&minPointClusters=500
&outputName={"serviceProperties":{"name":"Find point clusters results"}}
&context={}
Response (JSON)
{
"jobId": "<JOB_ID>",
"jobStatus": "esriJobSubmitted",
"results": {},
"inputs": {},
"messages": []
}
Request
POST <YOUR_ANALYSIS_SERVICE>/arcgis/rest/services/tasks/GPServer/FindPointClusters/jobs/<JOB_ID> HTTP/1.1
Content-Type: application/x-www-form-urlencoded
&f=json
&token=<ACCESS_TOKEN>
Response (JSON)
// Executing job
{
"jobId": "<JOB_ID>",
"jobStatus": "esriJobExecuting",
"results": {},
"inputs": {},
"messages": []
}
// Job succeeded
{
"jobId": "<JOB_ID>",
"jobStatus": "esriJobSucceeded",
"results": {
"pointClustersResultLayer": {
"paramUrl": "results/pointClustersResultLayer"
},
},
"inputs": {},
"messages": []
}
Request
POST <YOUR_ANALYSIS_SERVICE>/arcgis/rest/services/tasks/GPServer/FindPointClusters/jobs/<JOB_ID>/results/outliersResultLayer HTTP/1.1
Content-Type: application/x-www-form-urlencoded
&f=json
&returnType=data
&token=<ACCESS_TOKEN>Response (JSON)
{
"paramName": "pointClustersResultLayer",
"dataType": "GPString",
"value": {
"url": "<SERVICE_URL>",
"itemId": "<ITEM_ID>"
}
}Tutorials
Learn how to perform related analyses interactively with Map Viewer and programmatically with ArcGIS API for Python, ArcGIS REST JS, and ArcGIS REST API.
Services
Spatial analysis service
Process spatial datasets to discover relationships and patterns.
API support
| Find hot spots | Find outliers | Find point clusters | Calculate density | Interpolate points | |
|---|---|---|---|---|---|
| ArcGIS Maps SDK for JavaScript | 1 | 1 | 1 | 1 | 1 |
| ArcGIS Maps SDK for .NET | |||||
| ArcGIS Maps SDK for Kotlin | |||||
| ArcGIS Maps SDK for Swift | |||||
| ArcGIS Maps SDK for Java | |||||
| ArcGIS Maps SDK for Qt | |||||
| ArcGIS API for Python | |||||
| ArcGIS REST JS | 1 | 1 | 1 | 1 | 1 |
| Esri Leaflet | 2 | 2 | 2 | 2 | 2 |
| MapBox GL JS | 2 | 2 | 2 | 2 | 2 |
| OpenLayers | 2 | 2 | 2 | 2 | 2 |
- 1. Access with geoprocessing task
- 2. Access via ArcGIS REST JS