 Hide Table of Contents
 Tutorials
About the API
Work with the API
Graphics and feature layers
Popups and Info Windows
Mobile
ArcGIS Server Services
References
What's New archive
Tutorials
About the API
Work with the API
Graphics and feature layers
Popups and Info Windows
Mobile
ArcGIS Server Services
References
What's New archive
Relationship Renderer
We added the createRelationshipRenderer() method to the smartMapping module. This method allows you to generate
a renderer for exploring the potential relationship between two numeric attributes. This is commonly known as a
bivariate choropleth visualization. Our implementation
goes beyond a standard bivariate choropleth because the
createRelationshipRenderer() method supports layers of point, polyline, and polygon geometry types.
As described in this blog post, bivariate choropleth visualizations can be complicated to implement on your own. The
createRelationshipRenderer() Smart Mapping method simplifies the process significantly, even providing you with
several color schemes that work well for this style.
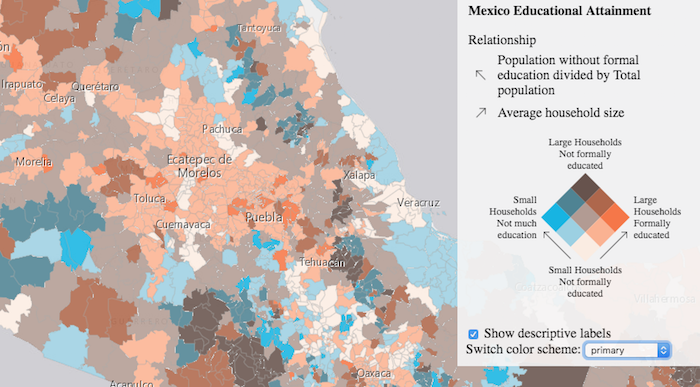
You can also add a size visual variable to add a third attribute to the visualization.
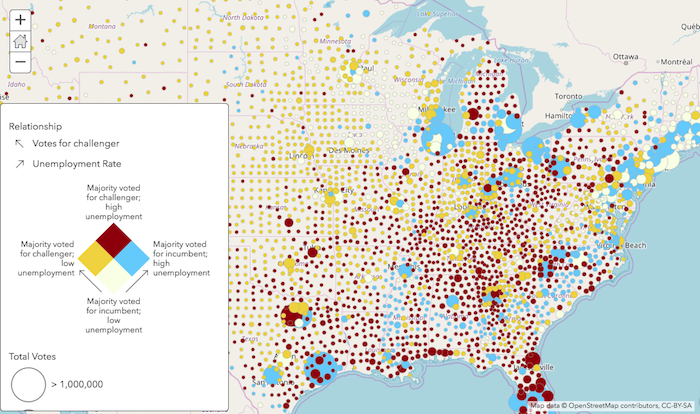
See the Relationship Renderer sample for an example of how this method works. Keep in mind that even if you observe a positive relationship between the two variables of interest, it doesn't mean they are statistically correlated. It also doesn't imply the presence of one variable influences the other. Therefore, this renderer should be used judiciously with some prior knowledge that two variables may likely be related.
New locales
Version 3.25 adds support for Catalan (ca) and Hungarian (hu) locales. See Localization topic for more information about using different locales.
Browser support
Microsoft dropped support for Internet Explorer 9 and 10 in 2016. We've updated the documentation for our Supported Browsers to show Internet Explorer 11 as the minimum required Internet Explorer version.
Promote secure services
Beginning with version 3.25, we highly encourage the use of secure services with https. What does this mean for you? If your site is running under https, and you are accessing resources to unsecured (http) resources, we automatically switch the requests to use https. Chrome is already issuing warnings starting in July, 2018.
One note worth mentioning is that if you develop using http://localhost,
it is automatically flagged as being in a secured network. For example,
while running an application from http://localhost which
accesses unsecured (http) resources, the API will automatically update
these requests to use https.
With browser security getting stricter with each update, it is in your best interest to move towards using https for all web requests. To aid in this, we recommend generating your own certificates for local development environment.
VectorTileLayer Printing
With ArcGIS Server version 10.6.0, the PrintTask now uses the URL for public VectorTileLayers, instead of a client-side image in the printout. With ArcGIS Server version 10.6.1, the PrintTask now uses the URL for all VectorTileLayers, instead of a client-side image in the printout.
API updates and enhancements
- New object
PlayerViewModes - New object
PlayerZoomBehaviors - New object
esri/styles/relationship - New properties
allowKeyboardNavigation,defaultZoomBehavior,enableDataDrilling,scaleSlidesToFitWindow,showAreaTitle,showToolbarInPopup,viewModeon classReportPlayer - New property
currentStyleInfoon classVectorTileLayer - New properties
maxItemCount,returnPixelValueson classImageServiceIdentifyParameters - New methods
resize(),setMaxHeight(),setMaxWidth()on classReportPlayer - New method
createRelationshipRenderer()on objectesri/renderers/smartMapping -
Starting with version 3.24, converting geometry objects to JSON using JSON.stringify
will now correctly conform to the REST specification.
Prior to this version, the resulting JSON incorrectly contained a
typeproperty. This has subsequently been removed. - Added a new
zoomAnimationThrottledproperty to theesri.config.defaults.mapobject.
Bug fixes and enhancements
- BUG-000110677: Fixed an issue where working on a throttled network would sometimes cause previously-drawn data to not clear and update correctly when zooming.
- BUG-000108715: It is now possible to connect StreamLayer observations across the international date line.
- ENH-000100429: Fonts used by the Calcite stylesheet are now included in the API.
Additional packages
Version 3.25 of the ArcGIS API for JavaScript include:
- ArcGIS Arcade 1.4
- dgrid versions
- dgrid version 1.2.1 (since version 3.22)
-
dgrid version 0.3.17 (since version 3.13)
NOTE: If working with version 1.1.0, please reference the
dgrid1directory, whereas version 0.3.17 should reference thedgriddirectory. Please refer to the dgrid 0.4 Migration Guide for additional information on migrating to the newer version.
- Dojo version 1.13.0 (since version 3.23)
- dstore version 1.1.2 (since version 3.22)
- put-selector version 0.3.6 (since version 3.13)
- xstyle version 0.3.2 (since version 3.17)
Additional Resources on GitHub
Use the repository on GitHub for the JS API TypeScript definitions.