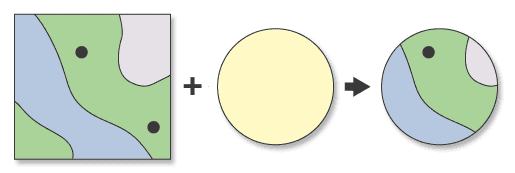
Clip creates subsets of your input DataFrame geometries by clipping them to areas of interest.
Usage notes
-
Use this tool to cut out a piece of a DataFrame using one or more of the polygons from another DataFrame as a cookie cutter. This is particularly useful for creating a DataFrame that contains a geographic subset of the records from another, larger DataFrame.
-
The analysis will clip records or portions of records that overlay the areas of interest.
-
The output geometry type will be the same type as the input geometry being clipped. For example, if you clip linestring geometries within a polygon, the output result will be linestring geometries.
-
All fields in the
input_parameter will be included in the output result. Fields from the DataFrame specified indataframe clip_parameter will not be included in the output.dataframe
Limitations
- You can only clip to polygon geometries.
Results
The tool outputs a subset of the input records that include the following fields:
| Field | Description |
|---|---|
| datetime | If your input had a timestamp column, there will be new fields named start_ for instants, and start_ and end_ for intervals. |
clip_ | The clipped geometries. |
Performance notes
Improve the performance of Clip by doing one or more of the following:
-
Only analyze the records in your area of interest. You can pick the records of interest by using one of the following SQL functions:
- ST_Intersection—Clip to an area of interest represented by a polygon. This will modify your input records.
- ST_BboxIntersects—Select records that intersect an envelope.
- ST_EnvIntersects—Select records having an evelope that intersects the envelope of another geometry.
- ST_Intersects—Select records that intersect another dataset or area of intersect represented by a polygon.
- Use ST_Generalize to lower the number or vertices in your input polygons.
Similar capabilities
Use the Overlay tool if you want to intersect, erase or union two datasets.
Use the Spatiotemporal join tool if you want to join two DataFrames based on their spatial relationship.
The following functions complete spatial overlay operations:
- ST_Aggr_Intersection
- ST_Aggr_union
- ST_Contains
- ST_Crosses
- ST_Difference
- ST_Dwithin
- ST_Equals
- ST_Intersection
- ST_Intersects
- ST_Overlaps
- ST_SymDifference
- ST_Touches
- ST_Union
- ST_Within
Syntax
For more details, go to the GeoAnalytics Engine API reference for clip.
| Setter | Description | Required |
|---|---|---|
run(input_ | Runs the Clip tool using the provided DataFrames. | Yes |
Examples
Run Clip
# Log in
import geoanalytics
geoanalytics.auth(username="myusername", password="mypassword")
# Imports
from geoanalytics.tools import Clip
from geoanalytics.sql import functions as ST
# Paths to the USA rivers and streams data and USA states data
usa_rivers_data_path = "https://services.arcgis.com/P3ePLMYs2RVChkJx/ArcGIS/rest/" \
"services/USA_Rivers_and_Streams/FeatureServer/0"
usa_states_path = "https://services.arcgis.com/P3ePLMYs2RVChkJx/ArcGIS/rest/" \
"services/USA_State_Boundaries/FeatureServer/0"
# Create a USA rivers and streams DataFrame
usa_rivers_and_streams_df = spark.read.format("feature-service") \
.load(usa_rivers_data_path)
# Create an Oregon state boundary DataFrame
oregon_df = spark.read.format("feature-service").load(usa_states_path) \
.where("STATE_NAME == 'Oregon'") \
.withColumn("shape", ST.transform("shape", 4326))
# Clip the USA rivers and streams to the Oregon state boundary
result = Clip().run(input_dataframe=usa_rivers_and_streams_df,
clip_dataframe=oregon_df)
# Show the top 5 longest river/streams in Oregon state from the clip result
result.select("Name", "Feature", "State", "Region", "Miles").sort("Miles", ascending=False).show(5)
+----------------+---------------+-----+------+------+
| Name| Feature|State|Region| Miles|
+----------------+---------------+-----+------+------+
| Columbia River|Artificial Path|OR-WA| 17|251.07|
|Willamette River| Stream| OR| 17| 160.8|
| John Day River| Stream| OR| 17|122.73|
| Nehalem River| Stream| OR| 17|107.92|
| John Day River| Stream| OR| 17|105.58|
+----------------+---------------+-----+------+------+
only showing top 5 rowsPlot results
# Transform the Clip result geometry to NAD 1983 StatePlane Oregon spatial reference
result = result.withColumn("clip_geometry", ST.transform("clip_geometry", 6558))
# Transform the Oregon boundary geometry to NAD 1983 StatePlane Oregon spatial reference
oregon_df = oregon_df.withColumn("shape", ST.transform("shape", 6558))
# Plot the clipped rivers and the Oregon state boundary
oregon_plot = oregon_df.st.plot(facecolor="none",
linewidth = 2,
edgecolors="black",
figsize=(14,8),
basemap="light")
result_plot = result.st.plot(geometry="clip_geometry", ax=oregon_plot)
result_plot.set_title("Rivers and streams clipped to the Oregon state boundary")
result_plot.set_xlabel("X (Meters)")
result_plot.set_ylabel("Y (Meters)");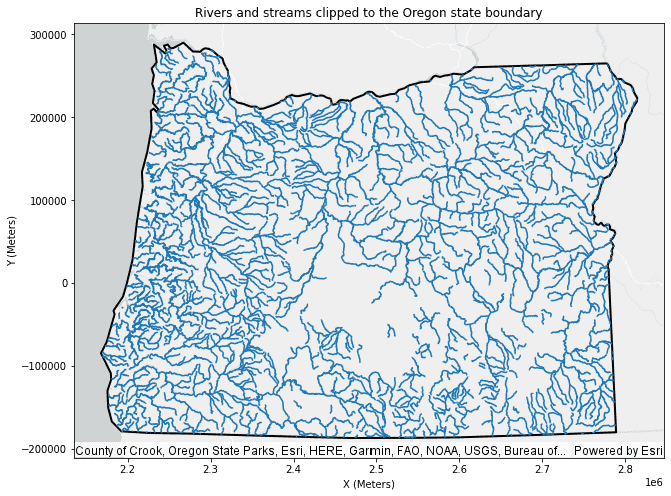
Version table
| Release | Notes |
|---|---|
1.0.0 | Tool introduced |