The ArcGIS API for Python contains a mapping module that can extend the visualization capabilities of ArcGIS GeoAnalytics Engine via an interactive web map widget. This widget can be used to view the geometries in a Spark DataFrame column while leveraging features like online basemaps, panning, zooming, and clicking on geometries to identify them.
To visualize a Spark DataFrame geometry column in the map widget, the DataFrame must first be converted to a pandas Spatially Enabled DataFrame (sedf) using st.to_pandas_sdf().
This tutorial will show you how to convert a Spark DataFrame to a Spatially Enabled DataFrame and use
arcgis.mapping to visualize the geometries.
Prerequisites
The following are required for this tutorial:
- A running Spark session configured with ArcGIS GeoAnalytics Engine.
- A Jupyter or JupyterLab notebook connected to your Spark session.
- The
arcgismodule. - An internet connection (for accessing sample data).
Steps
Import and authorize
-
In your notebook, import
geoanalyticsand authorize the module using a username and password, or a license file.PythonUse dark colors for code blocks Copy import geoanalytics geoanalytics.auth(username="user1", password="p@ssword")
Plot geometry columns in the map widget
- Load a polygon feature service of US state boundaries into a DataFrame.
url = "https://services.arcgis.com/P3ePLMYs2RVChkJx/ArcGIS/rest/services/USA_States_Generalized/FeatureServer/0"
us_states = spark.read.format("feature-service").load(url)
- Convert the Spark DataFrame to a Spatially Enabled DataFrame. This requires that you have the
arcgismodule installed.arcgiswill be imported automatically when callingst.to_.pandas_ sdf
states_sdf = us_states.st.to_pandas_sdf()
-
Show the geometries in the map widget using the
plotmethod on the Spatially Enabled DataFrame. In this example the state polygons are symbolized using the population of each state. The following arguments are used:renderer_—Set totype cfor class breaks renderer.method—The class breaks algorithm used to define classes.class_—The number of classes to symbolize with.count col—The column to symbolize on.cmap—The colormap to use.alpha—Determines the transparency of the geometries.
PythonUse dark colors for code blocks Copy states_sdf = states_sdf[["shape", "POPULATION"]].astype({"POPULATION":"int64"}) states_sdf.spatial.plot(renderer_type='c', method='esriClassifyNaturalBreaks', class_count=20, col='POPULATION', cmap='summer', alpha=0.7)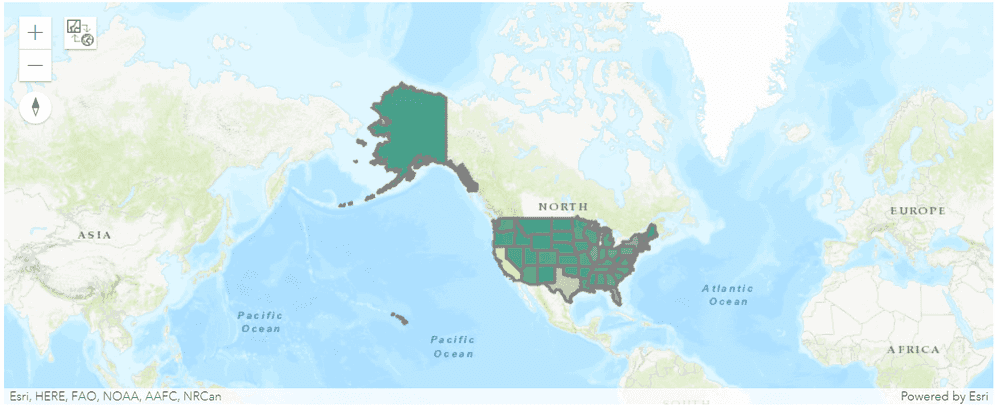
What's next?
The examples shown here are just a basic introduction to what's possible with
arcgis.mapping and Spatially Enabled DataFrames.
For more information, see the map widget documentation
and the following ArcGIS API for Python guide topics: