Calculate a geodesic path between two points and measure its distance.
Use case
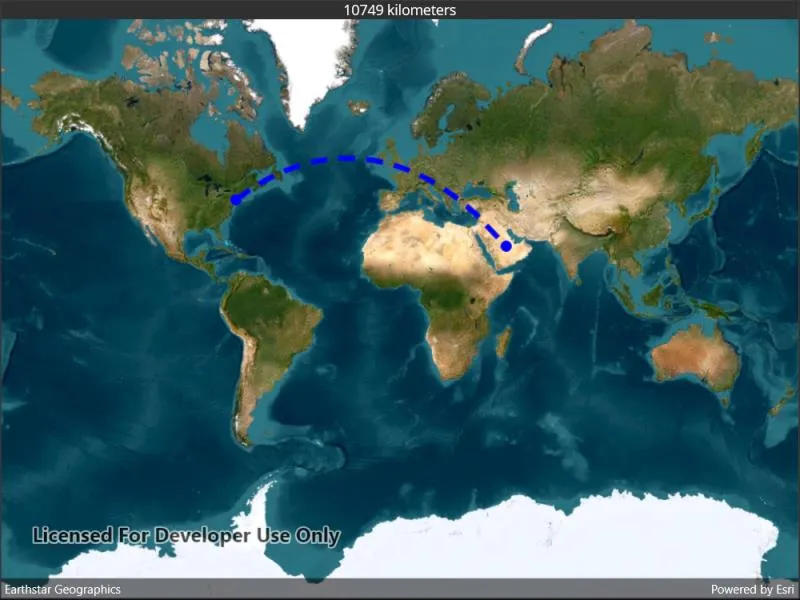
A geodesic distance provides an accurate, real-world distance between two points. Visualizing flight paths between cities is a common example of a geodesic operation since the flight path between two airports takes into account the curvature of the earth, rather than following the planar path between those points, which appears as a straight line on a projected map.
How to use the sample
Tap anywhere on the map. A line graphic will display the geodesic line between the two points. In addition, text that indicates the geodesic distance between the two points will be updated. Tap elsewhere and a new line will be created.
How it works
- A
Pointis created in New York City and displayed as aGraphic. - When a tap occurs on the
MapView, a newPointis obtained from the mouse click. ThisPointis added as aGraphic. - A
Polylineis created with the twoPointobjects. GeometryEngine.DensifyGeodeticis called from thePolylineobject, and the returnedGeometryis stored aspathGeometry.GeometryEngine.DistanceGeodeticis called from the startPointobject, and the returnedGeodeticDistanceResultobject’s distance number is displayed on the screen.
Relevant API
- GeometryEngine.DensifyGeodetic
- GeometryEngine.DistanceGeodetic
About the data
The Imagery basemap provides the global context for the displayed geodesic line.
Tags
densify, distance, geodesic, geodetic
Sample code
// Copyright 2022 Esri.//// Licensed under the Apache License, Version 2.0 (the "License"); you may not use this file except in compliance with the License.// You may obtain a copy of the License at: http://www.apache.org/licenses/LICENSE-2.0//// Unless required by applicable law or agreed to in writing, software distributed under the License is distributed on an// "AS IS" BASIS, WITHOUT WARRANTIES OR CONDITIONS OF ANY KIND, either express or implied. See the License for the specific// language governing permissions and limitations under the License.
using Esri.ArcGISRuntime.Geometry;using Esri.ArcGISRuntime.Mapping;using Esri.ArcGISRuntime.Symbology;using Esri.ArcGISRuntime.UI;
using Colors = System.Drawing.Color;using PointCollection = Esri.ArcGISRuntime.Geometry.PointCollection;
namespace ArcGIS.Samples.GeodesicOperations{    [ArcGIS.Samples.Shared.Attributes.Sample(        name: "Geodesic operations",        category: "Geometry",        description: "Calculate a geodesic path between two points and measure its distance.",        instructions: "Tap anywhere on the map. A line graphic will display the geodesic line between the two points. In addition, text that indicates the geodesic distance between the two points will be updated. Tap elsewhere and a new line will be created.",        tags: new[] { "densify", "distance", "geodesic", "geodetic" })]    public partial class GeodesicOperations : ContentPage    {        // Hold references to the graphics and start point.        private Graphic _startLocationGraphic;        private Graphic _endLocationGraphic;        private Graphic _pathGraphic;        private MapPoint _startPoint;
        public GeodesicOperations()        {            InitializeComponent();
            // Setup the control references and execute initialization.            Initialize();        }
        private void Initialize()        {            MyMapView.Map = new Map(BasemapStyle.ArcGISImageryStandard);
            // Create the graphics overlay and add it to the map view.            GraphicsOverlay graphicsOverlay = new GraphicsOverlay();            MyMapView.GraphicsOverlays.Add(graphicsOverlay);
            // Add a graphic at JFK to serve as the origin.            _startPoint = new MapPoint(-73.7781, 40.6413, SpatialReferences.Wgs84);            SimpleMarkerSymbol startMarker = new SimpleMarkerSymbol(SimpleMarkerSymbolStyle.Circle, Colors.Blue, 10);            _startLocationGraphic = new Graphic(_startPoint, startMarker);
            // Create the graphic for the destination.            _endLocationGraphic = new Graphic            {                Symbol = startMarker            };
            // Create the graphic for the path.            _pathGraphic = new Graphic            {                Symbol = new SimpleLineSymbol(SimpleLineSymbolStyle.Dash, Colors.Blue, 5)            };
            // Add the graphics to the overlay.            graphicsOverlay.Graphics.Add(_startLocationGraphic);            graphicsOverlay.Graphics.Add(_endLocationGraphic);            graphicsOverlay.Graphics.Add(_pathGraphic);
            // Update end location when the user taps.            MyMapView.GeoViewTapped += MyMapViewOnGeoViewTapped;        }
        private void MyMapViewOnGeoViewTapped(object sender, Esri.ArcGISRuntime.Maui.GeoViewInputEventArgs geoViewInputEventArgs)        {            // Get the tapped point, projected to WGS84.            MapPoint destination = (MapPoint)geoViewInputEventArgs.Location.Project(SpatialReferences.Wgs84);
            // Update the destination graphic.            _endLocationGraphic.Geometry = destination;
            // Get the points that define the route polyline.            PointCollection polylinePoints = new PointCollection(SpatialReferences.Wgs84)            {                (MapPoint) _startLocationGraphic.Geometry,                destination            };
            // Create the polyline for the two points.            Polyline routeLine = new Polyline(polylinePoints);
            // Densify the polyline to show the geodesic curve.            Geometry pathGeometry = routeLine.DensifyGeodetic(1, LinearUnits.Kilometers, GeodeticCurveType.Geodesic);
            // Apply the curved line to the path graphic.            _pathGraphic.Geometry = pathGeometry;
// Calculate and show the distance. GeodeticDistanceResult geodeticDistance = _startPoint.DistanceGeodetic(destination, LinearUnits.Kilometers, AngularUnits.Grads, GeodeticCurveType.Geodesic); ResultsLabel.Text = $"{(int)geodeticDistance.Distance} kilometers"; } }}<?xml version="1.0" encoding="utf-8" ?><ContentPage x:Class="ArcGIS.Samples.GeodesicOperations.GeodesicOperations" xmlns="http://schemas.microsoft.com/dotnet/2021/maui" xmlns:x="http://schemas.microsoft.com/winfx/2009/xaml" xmlns:esriUI="clr-namespace:Esri.ArcGISRuntime.Maui;assembly=Esri.ArcGISRuntime.Maui"> <Grid> <Grid.RowDefinitions> <RowDefinition Height="Auto" /> <RowDefinition Height="*" /> </Grid.RowDefinitions> <Label x:Name="ResultsLabel" Grid.Row="0" FontSize="25" HorizontalTextAlignment="Center"> Tap to set an end point. </Label> <esriUI:MapView x:Name="MyMapView" Grid.Row="1" /> </Grid></ContentPage>