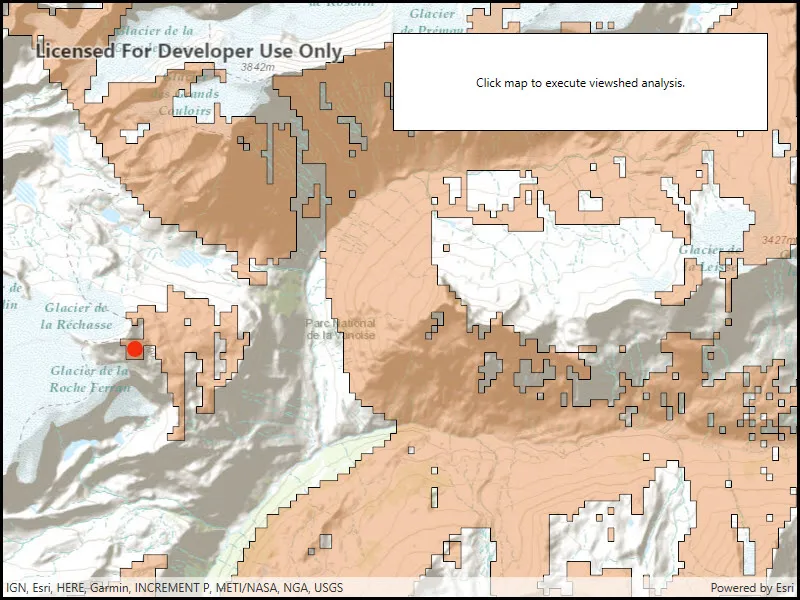
Calculate a viewshed using a geoprocessing service, in this case showing what parts of a landscape are visible from points on mountainous terrain.
Use case
A viewshed is used to highlight what is visible from a given point. A viewshed could be created to show what a hiker might be able to see from a given point at the top of a mountain. Equally, a viewshed could also be created from a point representing the maximum height of a proposed wind turbine to see from what areas the turbine would be visible.
Note: This analysis requires a geoprocessing service endpoint in a connected environment and processing times may vary depending on connection speeds. If fast, offline analysis is required, consider using a ViewshedFunction to perform a viewshed instead.
How to use the sample
Click the map to see all areas visible from that point within a 15km radius. Clicking on an elevated area will highlight a larger part of the surrounding landscape. It may take a few seconds for the task to run and send back the results.
How it works
- Create a
GeoprocessingTaskobject with the URL set to a geoprocessing service endpoint. - Create a
FeatureCollectionTableobject and add a newFeatureobject whose geometry is the viewshed’s observerPoint. - Make a
GeoprocessingParametersobject passing in the observer point. - Use the geoprocessing task to create a
GeoprocessingJobobject with the parameters. - Start the job and wait for it to complete and return a
GeoprocessingResultobject. - Get the resulting
GeoprocessingFeaturesobject. - Iterate through the viewshed features to use their geometry or display the geometry in a new
Graphicobject.
Relevant API
- FeatureCollectionTable
- GeoprocessingFeatures
- GeoprocessingJob
- GeoprocessingParameters
- GeoprocessingResult
- GeoprocessingTask
Tags
geoprocessing, heat map, heatmap, viewshed
Sample code
// Copyright 2016 Esri.//// Licensed under the Apache License, Version 2.0 (the "License"); you may not use this file except in compliance with the License.// You may obtain a copy of the License at: http://www.apache.org/licenses/LICENSE-2.0//// Unless required by applicable law or agreed to in writing, software distributed under the License is distributed on an// "AS IS" BASIS, WITHOUT WARRANTIES OR CONDITIONS OF ANY KIND, either express or implied. See the License for the specific// language governing permissions and limitations under the License.
using Esri.ArcGISRuntime.Data;using Esri.ArcGISRuntime.Geometry;using Esri.ArcGISRuntime.Mapping;using Esri.ArcGISRuntime.Symbology;using Esri.ArcGISRuntime.Tasks;using Esri.ArcGISRuntime.Tasks.Geoprocessing;using Esri.ArcGISRuntime.UI;using Esri.ArcGISRuntime.UI.Controls;using System;using System.Collections.Generic;using System.Drawing;using System.Threading.Tasks;using System.Windows;
namespace ArcGIS.WPF.Samples.ShowViewshedCalculatedFromGeoprocessingTask{    [ArcGIS.Samples.Shared.Attributes.Sample(        name: "Show viewshed calculated from geoprocessing task",        category: "Geoprocessing",        description: "Calculate a viewshed using a geoprocessing service, in this case showing what parts of a landscape are visible from points on mountainous terrain.",        instructions: "Click the map to see all areas visible from that point within a 15km radius. Clicking on an elevated area will highlight a larger part of the surrounding landscape. It may take a few seconds for the task to run and send back the results.",        tags: new[] { "geoprocessing", "heat map", "heatmap", "viewshed" })]    public partial class ShowViewshedCalculatedFromGeoprocessingTask    {        // Url for the geoprocessing service.        private const string _viewshedUrl =            "https://sampleserver6.arcgisonline.com/arcgis/rest/services/Elevation/ESRI_Elevation_World/GPServer/Viewshed";
        // Used to store state of the geoprocessing task.        private bool _isExecutingGeoprocessing;
        // The graphics overlay to show where the user clicked in the map.        private GraphicsOverlay _inputOverlay;
        // The graphics overlay to display the result of the viewshed analysis.        private GraphicsOverlay _resultOverlay;
        public ShowViewshedCalculatedFromGeoprocessingTask()        {            InitializeComponent();
            // Create the UI, setup the control references and execute initialization.            Initialize();        }
        private void Initialize()        {            // Create a map with topographic basemap and an initial location.            Map myMap = new Map(BasemapStyle.ArcGISTopographic);            myMap.InitialViewpoint = new Viewpoint(45.3790902612337, 6.84905317262762, 70000);
            // Hook into the tapped event.            MyMapView.GeoViewTapped += OnMapViewTapped;
            // Create empty overlays for the user clicked location and the results of the viewshed analysis.            CreateOverlays();
            // Assign the map to the MapView.            MyMapView.Map = myMap;        }
        private async void OnMapViewTapped(object sender, GeoViewInputEventArgs e)        {            // The geoprocessing task is still executing, don't do anything else (i.e. respond to            // more user taps) until the processing is complete.            if (_isExecutingGeoprocessing)            {                return;            }
            // Indicate that the geoprocessing is running.            SetBusy();
            // Clear previous user click location and the viewshed geoprocessing task results.            _inputOverlay.Graphics.Clear();            _resultOverlay.Graphics.Clear();
            // Get the tapped point.            MapPoint geometry = e.Location;
            // Create a marker graphic where the user clicked on the map and add it to the existing graphics overlay.            Graphic myInputGraphic = new Graphic(geometry);            _inputOverlay.Graphics.Add(myInputGraphic);
            // Normalize the geometry if wrap-around is enabled.            //    This is necessary because of how wrapped-around map coordinates are handled by Runtime.            //    Without this step, the task may fail because wrapped-around coordinates are out of bounds.            if (MyMapView.IsWrapAroundEnabled) { geometry = (MapPoint)geometry.NormalizeCentralMeridian(); }
            try            {                // Execute the geoprocessing task using the user click location.                await CalculateViewshed(geometry);            }            catch (Exception ex)            {                MessageBox.Show(ex.ToString(), "Error");            }        }
        private async Task CalculateViewshed(MapPoint location)        {            // This function will define a new geoprocessing task that performs a custom viewshed analysis based upon a            // user click on the map and then display the results back as a polygon fill graphics overlay. If there            // is a problem with the execution of the geoprocessing task an error message will be displayed.
            // Create new geoprocessing task using the url defined in the member variables section.            GeoprocessingTask myViewshedTask = await GeoprocessingTask.CreateAsync(new Uri(_viewshedUrl));
            // Create a new feature collection table based upon point geometries using the current map view spatial reference.            FeatureCollectionTable myInputFeatures = new FeatureCollectionTable(new List<Field>(), GeometryType.Point, MyMapView.SpatialReference);
            // Create a new feature from the feature collection table. It will not have a coordinate location (x,y) yet.            Feature myInputFeature = myInputFeatures.CreateFeature();
            // Assign a physical location to the new point feature based upon where the user clicked in the map view.            myInputFeature.Geometry = location;
            // Add the new feature with (x,y) location to the feature collection table.            await myInputFeatures.AddFeatureAsync(myInputFeature);
            // Create the parameters that are passed to the used geoprocessing task.            // Since the service used is only configured for the execute endpoint, construct the parameters using GeoprocessingExecutionType.SynchronousExecute.            GeoprocessingParameters myViewshedParameters =                new GeoprocessingParameters(GeoprocessingExecutionType.SynchronousExecute)                {                    // Request the output features to use the same SpatialReference as the map view.                    OutputSpatialReference = MyMapView.SpatialReference                };
            // Add an input location to the geoprocessing parameters.            myViewshedParameters.Inputs.Add("Input_Observation_Point", new GeoprocessingFeatures(myInputFeatures));
            // Create the job that handles the communication between the application and the geoprocessing task.            GeoprocessingJob myViewshedJob = myViewshedTask.CreateJob(myViewshedParameters);
            try            {                // Execute analysis and wait for the results.                GeoprocessingResult myAnalysisResult = await myViewshedJob.GetResultAsync();
                // Get the results from the outputs.                GeoprocessingFeatures myViewshedResultFeatures = (GeoprocessingFeatures)myAnalysisResult.Outputs["Viewshed_Result"];
                // Add all the results as a graphics to the map.                IFeatureSet myViewshedAreas = myViewshedResultFeatures.Features;                foreach (Feature myFeature in myViewshedAreas)                {                    _resultOverlay.Graphics.Add(new Graphic(myFeature.Geometry));                }            }            catch (Exception ex)            {                // Display an error message if there is a problem.                if (myViewshedJob.Status == JobStatus.Failed && myViewshedJob.Error != null)                    MessageBox.Show("Executing geoprocessing failed. " + myViewshedJob.Error.Message, "Geoprocessing error");                else                    MessageBox.Show("An error occurred. " + ex.ToString(), "Sample error");            }            finally            {                // Indicate that the geoprocessing is not running.                SetBusy(false);            }        }
        private void CreateOverlays()        {            // This function will create the overlays that show the user clicked location and the results of the            // viewshed analysis. Note: the overlays will not be populated with any graphics at this point.
            // Create renderer for input graphic. Set the size and color properties for the simple renderer.            SimpleRenderer myInputRenderer = new SimpleRenderer()            {                Symbol = new SimpleMarkerSymbol()                {                    Size = 15,                    Color = Color.Red                }            };
            // Create overlay to where input graphic is shown.            _inputOverlay = new GraphicsOverlay()            {                Renderer = myInputRenderer            };
            // Create fill renderer for output of the viewshed analysis. Set the color property of the simple renderer.            SimpleRenderer myResultRenderer = new SimpleRenderer()            {                Symbol = new SimpleFillSymbol()                {                    Color = Color.FromArgb(100, 226, 119, 40)                }            };
            // Create overlay to where viewshed analysis graphic is shown.            _resultOverlay = new GraphicsOverlay()            {                Renderer = myResultRenderer            };
            // Add the created overlays to the MapView.            MyMapView.GraphicsOverlays.Add(_inputOverlay);            MyMapView.GraphicsOverlays.Add(_resultOverlay);        }
        private void SetBusy(bool isBusy = true)        {            // This function toggles the visibility of the 'BusyOverlay' Grid control defined in xaml,            // sets the 'progress' control feedback status and updates the _isExecutingGeoprocessing            // boolean to denote if the viewshed analysis is executing as a result of the user click            // on the map.
if (isBusy) { // Change UI to indicate that the geoprocessing is running. _isExecutingGeoprocessing = true; BusyOverlay.Visibility = Visibility.Visible; Progress.IsIndeterminate = true; } else { // Change UI to indicate that the geoprocessing is not running. _isExecutingGeoprocessing = false; BusyOverlay.Visibility = Visibility.Collapsed; Progress.IsIndeterminate = false; } } }}<UserControl x:Class="ArcGIS.WPF.Samples.ShowViewshedCalculatedFromGeoprocessingTask.ShowViewshedCalculatedFromGeoprocessingTask" xmlns="http://schemas.microsoft.com/winfx/2006/xaml/presentation" xmlns:x="http://schemas.microsoft.com/winfx/2006/xaml" xmlns:esri="http://schemas.esri.com/arcgis/runtime/2013"> <Grid> <esri:MapView x:Name="MyMapView" /> <Border Style="{StaticResource BorderStyle}"> <Grid Margin="20"> <TextBlock HorizontalAlignment="Center" VerticalAlignment="Center" Text="Click map to execute viewshed analysis." />
<Grid x:Name="BusyOverlay" Grid.RowSpan="4" Margin="-20" Background="#8C000000" Visibility="Collapsed"> <Border Padding="10" HorizontalAlignment="Center" VerticalAlignment="Center" Background="#FFC6C4C4"> <Grid> <ProgressBar x:Name="Progress" Height="20" IsIndeterminate="True" /> <TextBlock Height="20" Margin="5" HorizontalAlignment="Center" Text="Executing analysis..." /> </Grid> </Border> </Grid> </Grid> </Border> </Grid></UserControl>