This guide covers more advanced uses for the map widget: see using the map widget for more information!
Property Updating
The map widget handles zoom, tilt, heading/rotation, basemap, center, extent, etc. features in an interesting and powerful way. Try running the below cells to gain insight into how these properties are updated:
def print_map_info(map):
    print("Widget Type =\t\t{}".format(type(map)))
    if not hasattr(map, "camera"):
        print("Zoom =\t\t{}\n".format(map.zoom))
    elif map.camera:
        print("Zoom =\t\t{}\n".format(map.zoom) + \
              "Tilt =\t\t{}\n".format(map.tilt) + \
              "Heading =\t{}".format(map.heading))
    else:
        raise Exception("Not supported argument")
The mode property from the previous MapView class has been removed as a property from the Map class, but it can be used when initializing a widget to differentiate a Scene or Map widget:
from arcgis.gis import GIStype(GIS().map("USA", mode="2D"))arcgis.map.map_widget.Map
type(GIS().map("USA", mode="3D"))arcgis.map.scene_widget.Scene
from arcgis.gis import GIS

usa_map = GIS().map("USA", mode="3D")
usa_map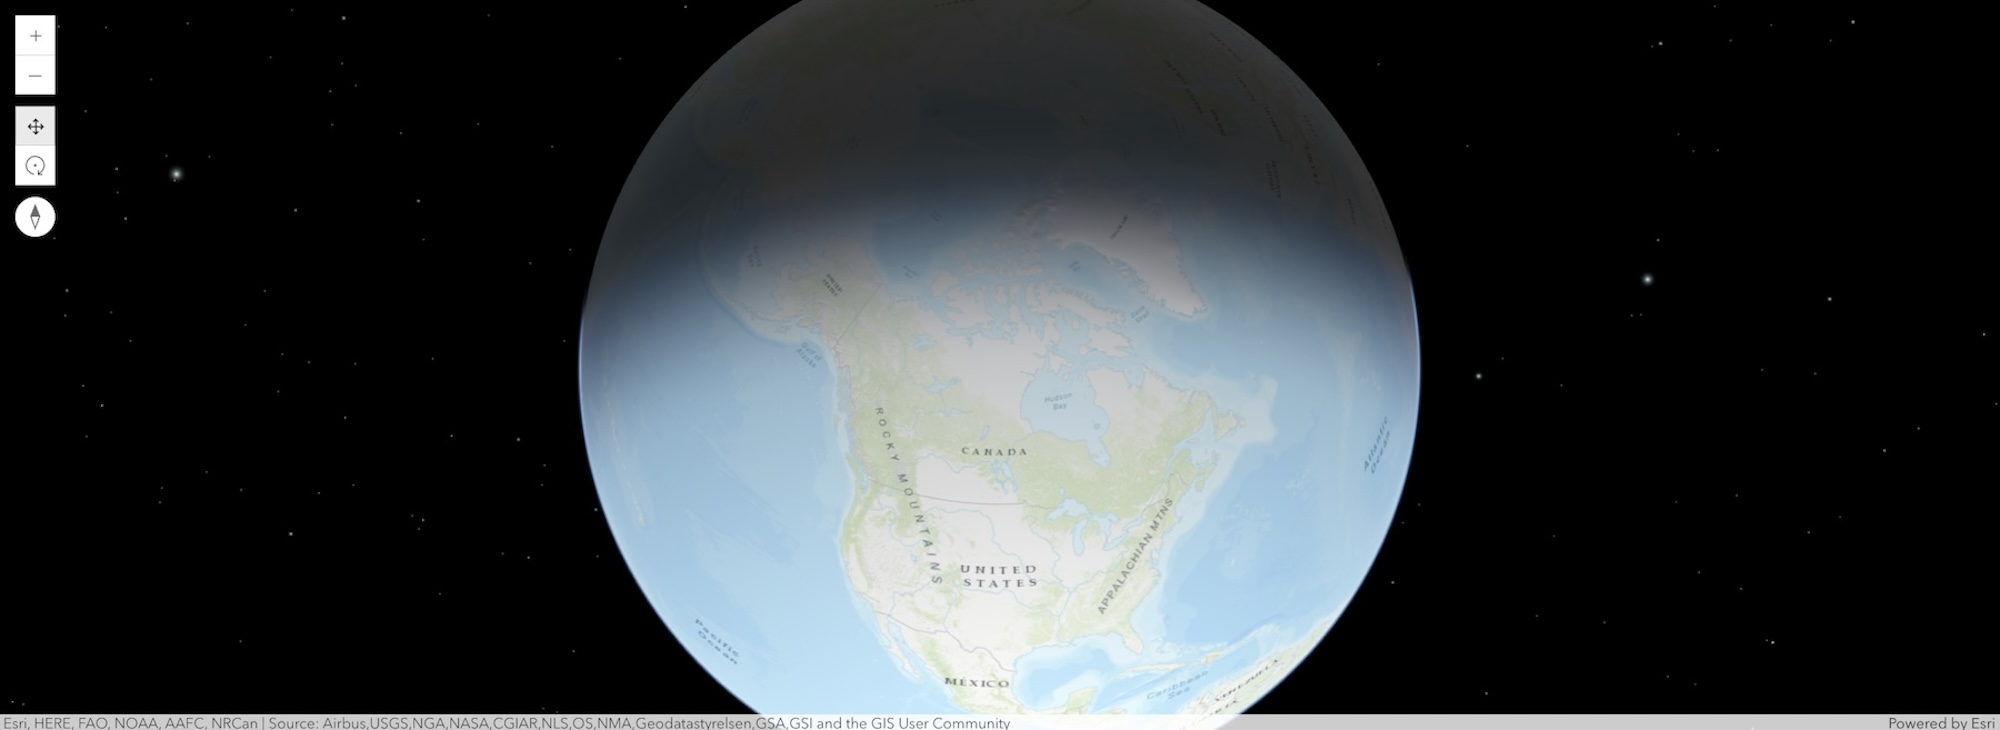
Now, using your mouse, move the map to a new location, zoom in, modify the tilt and heading, etc. After you've moved the camera, run the below cells to change the zoom and print the current state of those properties:
usa_map.zoom = 2print_map_info(usa_map)Widget Type = <class 'arcgis.map.scene_widget.Scene'> Zoom = 2.0 Tilt = 0.09999878139707691 Heading = 0
The values of the widget properties will change with use of the various buttons in the map widget view! Experiment with printing out the values of center, extent, and any of the above properties. See the API reference for more information.
3D Feature Layers
Let's create a new map of Zion National Park in Utah. 3D mode will show the elevation of the many canyons, rides, and elevation changes. It will even cast shadows. Run the below cell and explore!
gis = GIS(profile="your_online_profile")from arcgis.gis import GIS
zion_map = gis.map("Angel's Landing UT", mode="3D")
zion_map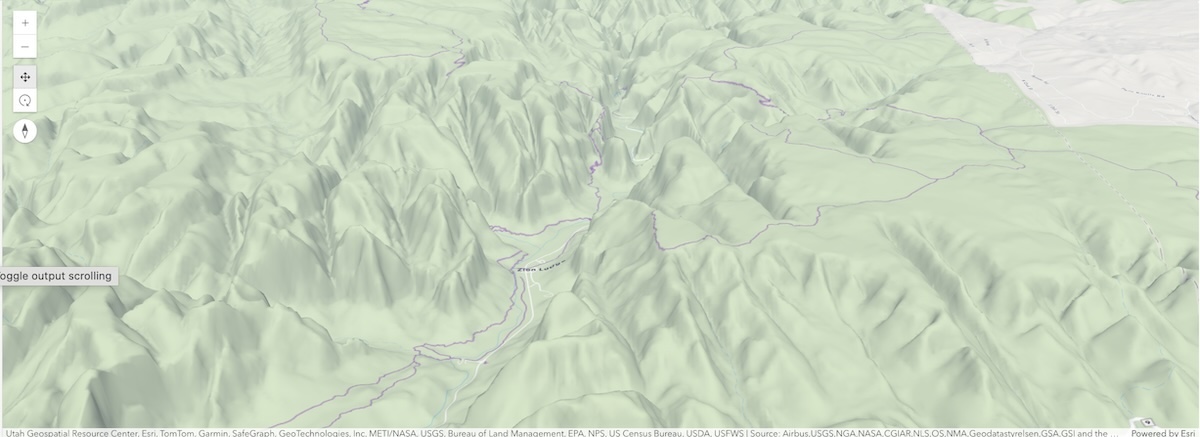
Run each of these cells below individually to watch how the view changes.
zion_map.zoom = 14zion_map.center = [37.2502, -112.9564]zion_map.camera = {
"position": {
"x": -12573578.761488685,
"y": 4461966.125736885,
"z": 6300,
},
"tilt": 65,
"heading": 360,
}You can also add Portal items and layers to the 3D map just like before. Run the below cell to add a layer of trails: notice how the trails follow the elevation changes of the land!
trails_layer = gis.content.get("881694a7049b419ebb8d271c0e6d7ddd").layers[0]
zion_map.content.add(trails_layer)
zion_map.camera = {
"position": {
"x": -12573578.761488685,
"y": 4461966.125736885,
"z": 6300,
},
"tilt": 65,
"heading": 360,
}You can save your current work as a WebScene by calling map.save(). Run the following code to save your WebScene!
my_zion_webscene_item = zion_map.save(
    {"title" : "My Zion Park Web Scene",
     "snippet" : "What I made with the ArcGIS API for Python Scene widget!",
     "tags" : "zion, NPS, python"}
)

my_zion_webscene_item
Export to HTML
You als have the ability to export the current widget as a standalone HTML file. This added functionality provides a workflow for creating standalone HTML maps that can be shared with anyone: all they need is a web browser!
The below cell will write the current widget to the file specified by a string path. Run the cell, find the file on your disk, and open it in your favorite web browser.
Note: By default, only publically accesible layers will show on the exported HTML maps. You must specify credentials_prompt=True to allow users to authenticate to portal to view private layers. See the API reference for more information.
import os

file_dir = r"/Users/<username>/path/data_formats/html_pages"
if not os.path.isdir(file_dir):
    os.mkdir(file_dir)

file_path = os.path.join(file_dir, 'myHurricaneMap.html')

hurricane_map.export_to_html(
    path_to_file=file_path
)
print("html saved as " + file_path) # On Windows, path can be 'C:\Users\Username\Documents\home\myHurricaneMap.html'
html saved as /Users/<username>/path/data_formats/html_pages/myHurricaneMap.html