Learn how to use the ArcGIS API for Python and the basemap styles service to display a map.
A map contains layers of geographic data. A map contains a basemap layer and, optionally, one or more data layers. You can display a specific area of a map using a map view and setting the location and zoom level.
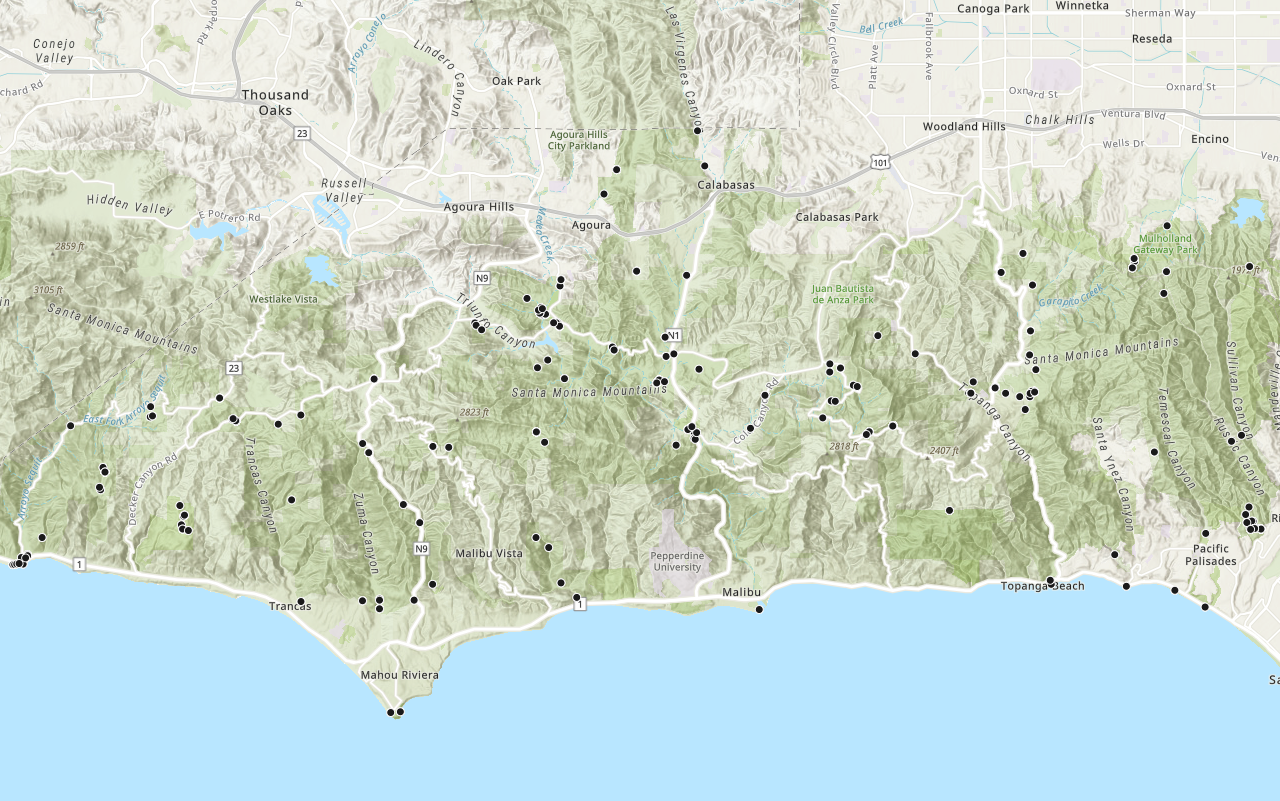
This tutorial shows you how to create and display a map of the Santa Monica Mountains in California using the topographic basemap layer.
Prerequisites
The ArcGIS API for Python tutorials use Jupyter Notebooks to execute Python code. If you are new to this environment, please see the guide to install the API and use notebooks locally.
Steps
Get an access token
You need an access token to use the location services used in this tutorial.
- Go to the Create an API key tutorial to obtain an access token.
- Ensure that the following privilege is enabled: Location services > Basemaps > Basemap styles service
- Copy the key as it will be used in a following step.
To learn more about other ways to get an access token, go to Types of authentication.
Import modules and log in
-
Import the
arcgis.gismodule. This module is the entry point into the GIS and provides the functionality to manage GIS content, users, and groups.Use dark colors for code blocks from arcgis.gis import GIS -
Use the
GISclass to log in. ReplaceYOURwith the API key you previously copied from the developer dashboard as a value to the_API _KEY apiparameter._key Use dark colors for code blocks from arcgis.gis import GIS gis = GIS(api_key="YOUR_API_KEY")
Display the map
-
Create an instance of the map widget and set the basemap.
Use dark colors for code blocks gis = GIS(api_key="YOUR_API_KEY") map = gis.map() map.basemap.basemap = "arcgis-streets" -
Set the map center and zoom level.
Use dark colors for code blocks map = gis.map() map.basemap.basemap = "arcgis-streets" map.center = [34.027, -118.805] map.zoom = 12 map # display the map -
Optional: Use the
exportmethod to export the current state of the map widget to a static HTML file which can be viewed in any web browser._to _html Use dark colors for code blocks from os import path, getcwd export_dir = path.join(getcwd(), "home") if not path.isdir(export_dir): os.mkdir(export_dir) export_path = path.join(export_dir, "display-a-map.html") map.export_to_html(export_path, title="Display a map")
You should see a map with the topographic basemap layer centered on the Santa Monica Mountains in California.
What's next?
Learn how to use additional functionality in these tutorials:

Display a web map
Search ArcGIS Online for an existing web map and display it.

Add a point, line, and polygon
Learn how to display point, line, and polygon graphics in a map.
Add a layer from a portal item
Learn how to use a portal item to access and display point features from a feature service.

Save a web map
Guide: Learn how to save a map as a web map in ArcGIS.