Learn how to execute a spatial query to access features from a feature layer.
A feature layer can contain a large number of features. To access a subset of these features, you can execute an SQL or spatial query, either together or individually. The results can contain the attributes, geometry, or both for each record. SQL and spatial queries are useful when a feature layer is very large and you want to access only a subset of its data.
In this tutorial, you access a hosted feature layer and query the service with a geometry and spatial operator to only return intersecting records.
Prerequisites
The ArcGIS API for Python tutorials use Jupyter Notebooks to execute Python code. If you are new to this environment, please see the guide to install the API and use notebooks locally.
Steps
Import modules and log in
-
Import the
arcgis.gismodule.Use dark colors for code blocks from arcgis.gis import GIS -
Log in anonymously to ArcGIS Online to access publicly shared data. Since this dataset is public you do not need credentials to access it. If it were a private dataset, you would be required to log in
Use dark colors for code blocks from arcgis.gis import GIS portal = GIS()
Access the feature layer
-
Use the
Contentclass to access the dataset by Item ID.Manager Use dark colors for code blocks portal = GIS() parcel_layer_item = portal.content.get("a6fdf2ee0e454393a53ba32b9838b303") parcel_layer = parcel_layer_item.layers[0]
Run the query
- Create an
Extentobject as a geometry filter. Thecontainsmethod will return only the features that are wholly contained within this extent. Theasparameter is set to_df Falseso that the results will be returned asFeature. Set theSet outas an array of field names to be included in the results._fields Use dark colors for code blocks parcel_layer_item = portal.content.get("a6fdf2ee0e454393a53ba32b9838b303") parcel_layer = parcel_layer_item.layers[0] from arcgis.geometry.filters import contains query_extent = { "xmin": -13198303.18, "ymin": 4059062.83, "xmax": -13197797.98, "ymax": 4059421.13, "spatialReference": {"wkid": 102100}, } query_filter = contains(query_extent, sr=102100) results = parcel_layer.query( geometry_filter=query_filter, out_fields="APN, UseType", as_df=False ) results
Display the results
-
Use the
mapmethod to create a map widget. Import thearcgis.map.popupsmodule and use thePopupclass to define and enable the popups. The curly braces in the popup content are templates that will use the field's value at run time. Use theInfo addmethod to add theFeatureresults and popup info to the map content and theSet zoommethod to set the maps extent so the query results are visible._to _layer() Use dark colors for code blocks from arcgis.geometry.filters import contains query_extent = { "xmin": -13198303.18, "ymin": 4059062.83, "xmax": -13197797.98, "ymax": 4059421.13, "spatialReference": {"wkid": 102100}, } query_filter = contains(query_extent, sr=102100) results = parcel_layer.query( geometry_filter=query_filter, out_fields="APN, UseType", as_df=False ) results map = portal.map() map from arcgis.map.popups import PopupInfo map.content.add(results, popup_info=PopupInfo(title= "{UseType} Parcel", description = "Parcel number: {APN}")) map.zoom_to_layer(results) -
Optional: Use the
exportmethod to export the current state of the map widget to a static HTML file which can be viewed in any web browser._to _html Use dark colors for code blocks map = portal.map() map from arcgis.map.popups import PopupInfo map.content.add(results, popup_info=PopupInfo(title= "{UseType} Parcel", description = "Parcel number: {APN}")) map.zoom_to_layer(results) import os file_path = os.path.join(os.getcwd(), "home", "query-a-feature-layer-sql.html") map.export_to_html(file_path, title="Query a feature layer (SQL)")
When the map displays, the features returned from the query are displayed in the center of the map. Click on a parcel to show a pop-up with the features attributes.
What's next?
Learn how to use additional functionality in these tutorials:
Query a feature layer (SQL)
Learn how to execute a SQL query to access polygon features from feature services.
Get global data
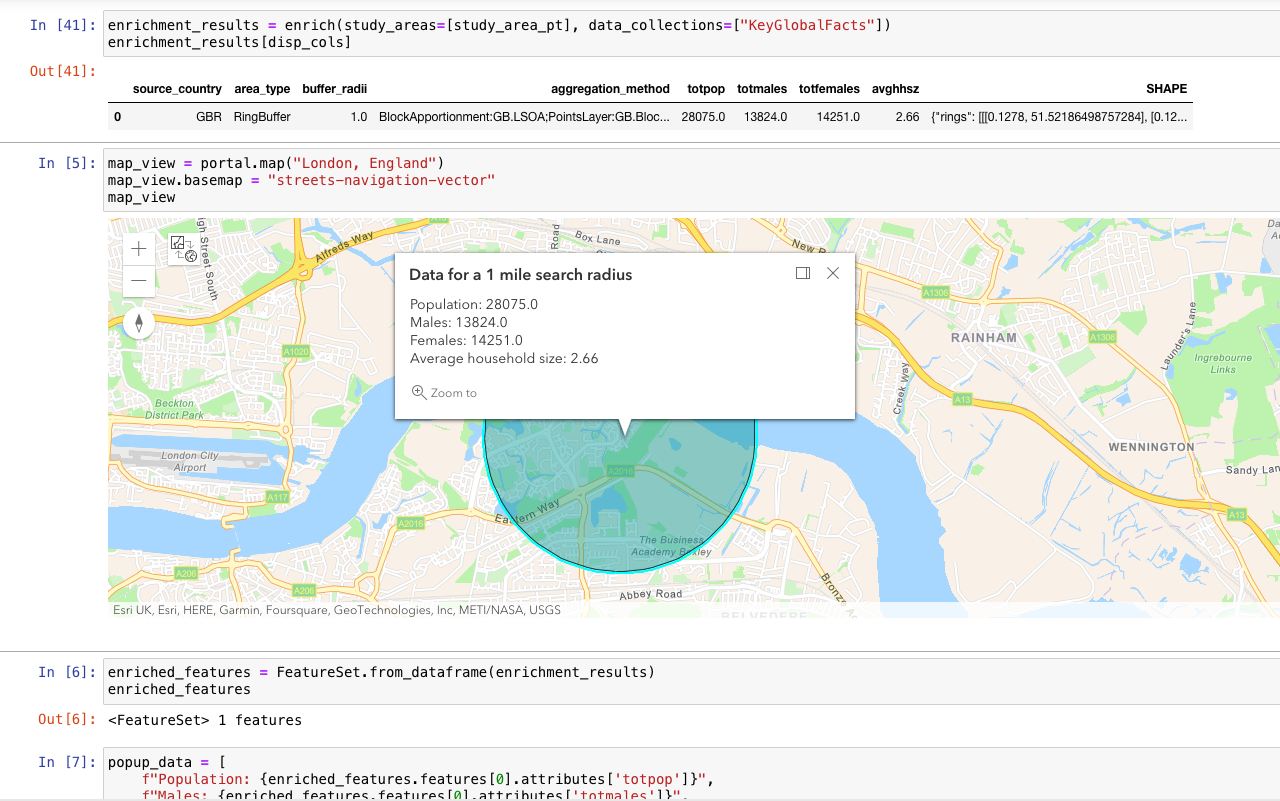
Query demographic information for locations around the world with the GeoEnrichment service.
Get local data
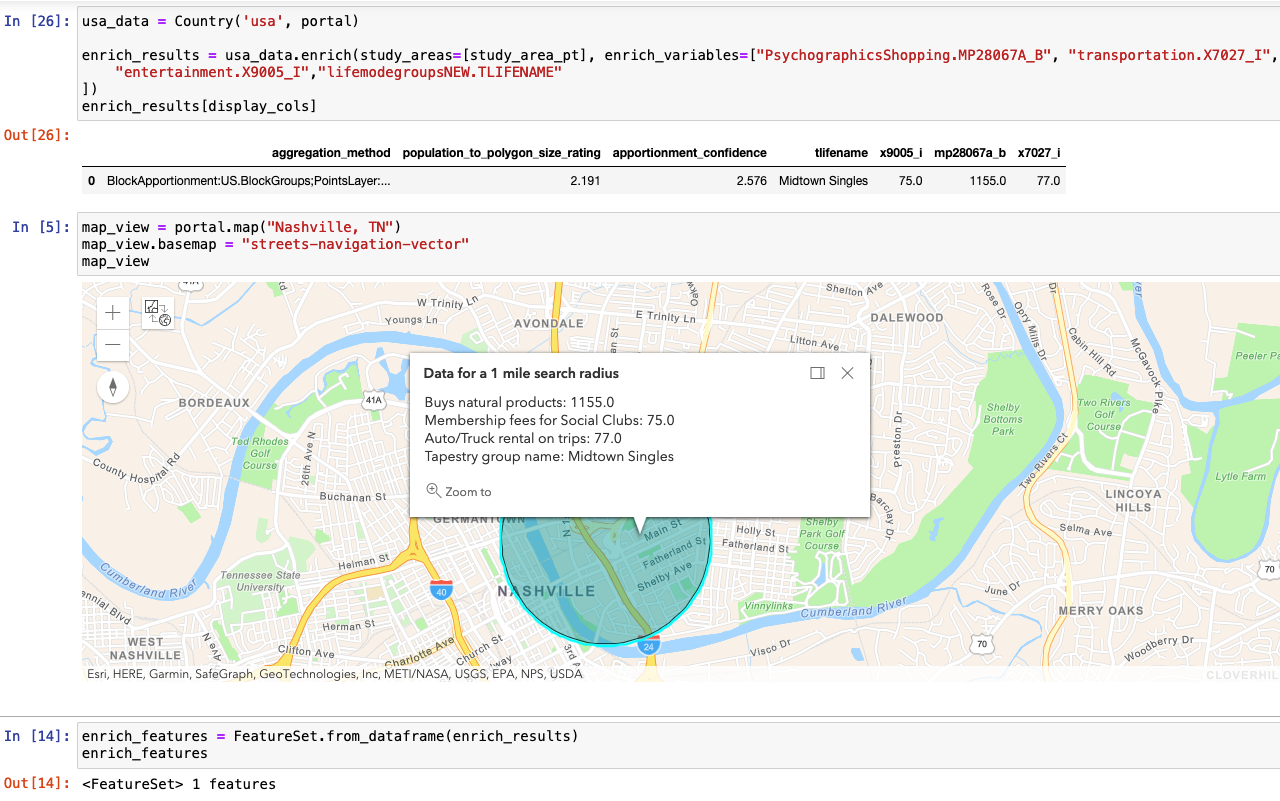
Query local analysis variables in select countries around the world with the GeoEnrichment service.
Add a layer from a portal item
Learn how to use a portal item to access and display point features from a feature service.