This API includes ExploratoryViewshed and ExploratoryLineOfSight classes to provide fast and dynamic (but strictly visual) analysis of data in a scene (including the terrain surface, scene layers, and 3D objects). The exploratory analysis API only considers data that is currently visible in the scene. You apply the analyses to the scene using the AnalysisOverlay class, and the results are updated dynamically as layers are added or removed, features are updated, camera position changes, and so on.
Exploratory analyses results are rendered quickly by the GPU but cannot be persisted. This is ideal for use cases that require responsive, interactive, and strictly visual evaluation of results that change frequently. However, since no features or output geometry are produced, use cases such as persisting result shapes or performing hit tests with other features are not supported.
Analysis results are influenced by the level of detail of the current display (distance of the camera to the surface), and the analysis results are therefore likely to change as you interact with the scene view.
Exploratory viewshed
Viewsheds show the visible and obstructed areas within an observer’s field of view. The 3D shape inside which visibility is evaluated is called the frustum. The frustum is defined by the observer’s location, horizontal and vertical angles of vision, minimum and maximum distance, heading, and pitch. The frustum represents the full volume being evaluated within the observer’s field of vision and can be displayed as part of the viewshed analysis result.
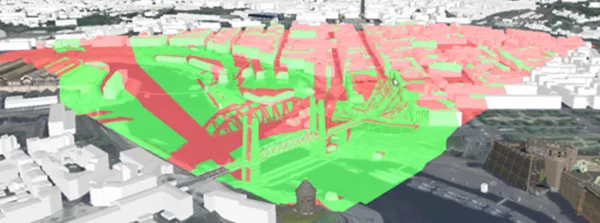
The symbols you provide to display visible and obstructed areas in the viewshed result are applied to all viewshed analyses in your scene view. While you can add several viewsheds to your scene, result symbology cannot be set individually. If adding several viewshed analyses to your scene view, transparency in your visibility colors helps visualize overlapping areas by making them appear darker.
Exploratory line of sight
Line of sight analysis shows visibility along a line connecting a pair of observer and target locations. The result indicates if the target is visible from the observer and displays visible and obstructed segments to show where visibility is blocked.
In addition to visible and obstructed line segments, portions of the line may have an unknown visibility state. These lines (displayed in gray by default) indicate that visibility cannot be reliably evaluated with the currently available data. For example, visibility may become unknown if the camera position is changed so that either the target or the observer for the line of sight is no longer displayed. In that situation, data outside the visible display may have been unloaded from the scene. The unloaded data may have contained obstructions to the line of sight that are no longer present.

A line of sight analysis represents a single line from observer to target. To make sight lines from multiple vantage points, you must create multiple analysis instances. A group of related line of site analyses (for the same observer, for example) can be managed in a single analysis overlay.
Examples
Exploratory viewshed from a moving GeoElement

You may want to see a viewshed for an observer whose location, heading, or pitch update frequently. For example, you may want to display a viewshed for the pilot of a search plane as it flies over the terrain. As an element representing the aircraft changes its position in the scene view, you’d like the viewshed result to update accordingly. This can be accomplished using ExploratoryGeoElementViewshed scene analysis, which takes a GeoElement (of point geometry type) to define the observer’s position. Since the viewshed is based on the geoelement, any change in its position (location, heading, pitch, and so on) will update the viewshed result. You can also specify offset values for the observer relative to the element. This is useful for more accurately representing an observer position inside a moving craft, for example.
To add a ExploratoryGeoElementViewshed analysis to your scene view:
-
Create a point geoelement to represent the observer in the viewshed. Add the element to the scene view.
-
Create a new
ExploratoryGeoElementViewshed. In the constructor, define the observer by passing in the geoelement, horizontal and vertical field of view, minimum and maximum distance, and heading and pitch offsets.// Define several constants used by the geoelement viewshed.constexpr double horizontalAngle = 40.0; // 0 to 360 valid.constexpr double verticalAngle = 60.0; // 0 to 360 valid.constexpr double minDistance = 0.0; // In meters.constexpr double maxDistance = 5000.0; // In meters.constexpr double heading = 0.0; // Azimuth in degrees, 0 to 360 valid.constexpr double pitch = 0.0; // Angle, 0 to 180 valid.// Create a new exploratory geoelement viewshed using the inputs of: the plane geoelement, horizontal// angle, vertical angle, min distance, max distance, heading, and pitch.ExploratoryGeoElementViewshed* exploratoryGeoElementViewshedFromPlane = new ExploratoryGeoElementViewshed(m_geoElementPlane,horizontalAngle, verticalAngle, minDistance, maxDistance, heading, pitch, this); -
Optional: Define offset values to define the X, Y, and Z location of the observer relative to the element. These offsets are defined in meters using a coordinate system relative to the center of the object, where X is to the right or left, Y is forward or back, and Z is up and down. To place an observer in the driver’s seat of a car, for example, you might place her 60 centimeters from the left of the car center, 70 centimeters forward from center, and 40 centimeters above the center. These offset values would be (-0.6, 0.7, 0.4).
// Set the planes exploratory geoelement viewshed properties of: offset X, offset Y, and offset Z.exploratoryGeoElementViewshedFromPlane->setOffsetX(2.5);exploratoryGeoElementViewshedFromPlane->setOffsetY(0.0);exploratoryGeoElementViewshedFromPlane->setOffsetZ(1.0); -
Optional: Provide custom colors for analysis results: visible areas, obstructed areas, and frustum. To show the frustum in the results, set the frustum outline visibility to true.
    // Define several colors to be used by the geoelement viewshed.    const QColor qColorVisible(255, 222, 0, 255);    const QColor qColorObstructed(150, 255, 99, 71);    const QColor qColorFrustum(255, 70, 130, 180);
    // Set the static exploratory viewshed properties for: visible, obstructed, and frustum    // outline colors.    ExploratoryViewshed::setVisibleColor(qColorVisible);    ExploratoryViewshed::setObstructedColor(qColorObstructed);    ExploratoryViewshed::setFrustumOutlineColor(qColorFrustum);
// Set the exploratory geoelement viewshed frustum outline to be visible. exploratoryGeoElementViewshedFromPlane->setFrustumOutlineVisible(true);-
Add the analysis to an analysis overlay to display the results.
    // Get the analysis list model from the analysis overlay.    AnalysisListModel* analysisListModel = m_analysisOverlay->analyses();
    // Append the exploratory location viewshed to the analysis list model.    analysisListModel->append(exploratoryGeoElementViewshedFromPlane);
As the position of the geoelement changes, the viewshed results will update accordingly.
Exploratory line of sight from a moving GeoElement
To evaluate line of sight from a moving GeoElement, use a ExploratoryGeoElementLineOfSight analysis. This analyzes visibility between point geoelements that represent the observer and target. As the position of these elements is updated (from a GPS feed, for example), the line of sight result will also be updated. As with the ExploratoryLocationLineOfSight analysis, you can handle target visibility changes to receive a notification each time the target becomes visible or obstructed. In the following image, for example, the target geoelement is selected when it becomes visible and unselected when it is obstructed.

To add a ExploratoryGeoElementLineOfSight analysis to your scene view:
-
Create a new
ExploratoryGeoElementLineOfSight. In the constructor, define the observer and target by passing in geoelements (with point geometry) that define their location.// Create a new exploratory geoelement line of sight using the observer and target geoelements.ExploratoryGeoElementLineOfSight* exploratoryGeoElementLineOfSight = new ExploratoryGeoElementLineOfSight(geoElement1, geoElement2, this); -
Optional: Define offset values to apply to the observer and/or target locations (x, y, z). These offsets are defined in meters using a coordinate system relative to the center of the object, where X is to the right or left, Y is forward or back, and Z is up and down. To place an observer in the driver’s seat of a car, for example, you might place her 60 centimeters from the left of the car center, 70 centimeters forward from center, and 40 centimeters above the center. These offset values would be (-0.6, 0.7, 0.4).
// Set the exploratory geoelement line of sight properties of: observer offset X, observer offset Y,// target offset x and target offset z. Note: the values are in meters.exploratoryGeoElementLineOfSight->setObserverOffsetX(1.0);exploratoryGeoElementLineOfSight->setObserverOffsetY(2.0);exploratoryGeoElementLineOfSight->setTargetOffsetX(1.0);exploratoryGeoElementLineOfSight->setTargetOffsetZ(4.5); -
Optional: Assign custom colors for visible and obstructed line segments in the analysis results. These are green and red by default.
// Define the visible and obstructed colors to be used by the geoelement line of sight.const QColor qColorVisible(150, 0, 255, 127);const QColor qColorObstructed(150, 255, 99, 71);// Set the static exploratory line of sight properties for: visible and obstructed colors; and// the line width.ExploratoryLineOfSight::setVisibleColor(qColorVisible);ExploratoryLineOfSight::setObstructedColor(qColorObstructed);ExploratoryLineOfSight::setLineWidth(3.0); -
Add the analysis to an analysis overlay to display the results.
// Get the analysis list model from the analysis overlay.AnalysisListModel* analysisListModel = m_analysisOverlay->analyses();// Append the exploratory geoelement line of sight to the analysis list model.analysisListModel->append(exploratoryGeoElementLineOfSight); -
Optional: Handle an event to know when target visibility changes.
// Connect to the exploratory geoelement line of sight's target visibility changed signal.connect(exploratoryGeoElementLineOfSight, &ExploratoryLocationLineOfSight::targetVisibilityChanged, this,[](ExploratoryLineOfSightTargetVisibility targetVisibility){// Continue if the target visiblity is visible.if (targetVisibility == ExploratoryLineOfSightTargetVisibility::Visible){// TODO: Write code to handle when the target is visible.}});