Perform an interactive viewshed analysis to determine visible and non-visible areas from a given observer position.
Use case
A viewshed analysis calculates the visible and non-visible areas from an observer’s location, based on factors such as elevation and topographic features. For example, an interactive viewshed analysis can be used to identify which areas can be seen from a helicopter moving along a given flight path for monitoring wildfires while taking parameters such as height, field of view, and heading into account to give immediate visual feedback. A user could further extend their viewshed analysis calculations by using map algebra to, e.g., only return viewshed results in geographical areas not covered in forest if they have an additional land cover raster dataset.
Note: This analysis is a form of “data-driven analysis”, which means the analysis is calculated at the resolution of the data rather than the resolution of the display.
How to use the sample
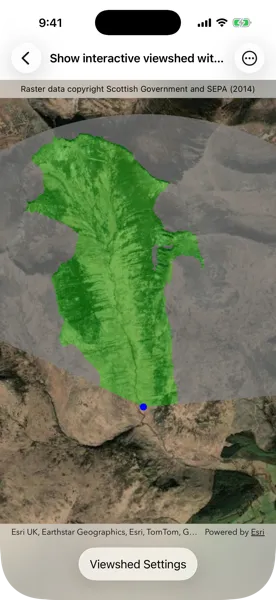
The sample loads with a viewshed analysis initialized from an elevation raster covering the Isle of Arran, Scotland. Transparent green shows the area visible from the observer position, and grey shows the non-visible areas. Move the observer position by tapping and dragging over the island to interactively evaluate the viewshed result and display it in the analysis overlay. Alternatively, tap on the map to see the viewshed from the tap location. Tap “Viewshed Settings” and use the controls to explore how the viewshed analysis results change when adjusting the observer elevation, target height, maximum radius, field of view, heading, and elevation sampling interval. As you move the observer and update the viewshed parameters, the analysis overlay refreshes to show the evaluated viewshed result.
How it works
- Create a
Mapand pass it to aMapView. - Create a
GraphicsOverlayto draw the observer point and anAnalysisOverlayand pass them to the map view. - Create a
ContinuousFieldfrom a raster file containing elevation data. - Create and configure
ViewshedParameters, passing in aPointas the observer position for the viewshed. - Create a
ContinuousFieldFunctionfrom the continuous field. - Create a
ViewshedFunctionusing the continuous field function and viewshed parameters, then convert it to aDiscreteFieldFunction. - Create a
ColormapRendererfrom aColormapwith colors that represent visible and non-visible results. - Create a
FieldAnalysisfrom the discrete field function and colormap renderer, then add it to theAnalysisOverlay’s collection of analysis objects to display the results. As parameter values change, the result is recalculated and redrawn automatically.
Relevant API
- AnalysisOverlay
- Colormap
- ColormapRenderer
- ContinuousField
- ContinuousFieldFunction
- FieldAnalysis
- ViewshedFunction
- ViewshedParameters
About the data
The sample uses a 10m resolution digital terrain elevation raster of the Isle of Arran, Scotland (Data Copyright Scottish Government and SEPA (2014)).
Tags
analysis overlay, elevation, field analysis, interactive, raster, spatial analysis, terrain, viewshed, visibility
Sample code
// Copyright 2026 Esri//// Licensed under the Apache License, Version 2.0 (the "License");// you may not use this file except in compliance with the License.// You may obtain a copy of the License at////   https://www.apache.org/licenses/LICENSE-2.0//// Unless required by applicable law or agreed to in writing, software// distributed under the License is distributed on an "AS IS" BASIS,// WITHOUT WARRANTIES OR CONDITIONS OF ANY KIND, either express or implied.// See the License for the specific language governing permissions and// limitations under the License.
import ArcGISimport SwiftUI
struct ShowInteractiveViewshedWithAnalysisOverlayView: View {    /// The view model for the sample.    @State private var model = Model()    /// A Boolean value indicating whether the viewshed settings are showing.    @State private var isShowingSettings = false    /// The screen point of the viewshed's observer used to determine if it is being dragged.    @State private var observerScreenPoint: CGPoint?    /// The error shown in the error alert.    @State private var error: (any Error)?
    var body: some View {        MapViewReader { mapViewProxy in            MapView(                map: model.map,                graphicsOverlays: [model.graphicsOverlay],                analysisOverlays: [model.analysisOverlay]            )            .magnifierDisabled(true)            .onDragGesture { screenPoint, _ in                guard let observerScreenPoint else { return false }                return observerScreenPoint.distance(from: screenPoint) < 40            } onChanged: { screenPoint, mapPoint in                guard let mapPoint else { return }                moveObserver(to: mapPoint, screenPoint: screenPoint)            }            .onSingleTapGesture { screenPoint, mapPoint in                moveObserver(to: mapPoint, screenPoint: screenPoint)            }            .onDrawStatusChanged { drawStatus in                // Sets the initial observerScreenPoint value, so the observer can be dragged.                guard observerScreenPoint == nil,                      let observerPoint = model.viewshedParameters.observerPosition,                      drawStatus == .completed else {                    return                }                observerScreenPoint = mapViewProxy.screenPoint(fromLocation: observerPoint)            }        }        .overlay(alignment: .top) {            Text("Raster data copyright Scottish Government and SEPA (2014)")                .font(.caption)                .frame(maxWidth: .infinity)                .padding(.vertical, 6)                .background(.thinMaterial, ignoresSafeAreaEdges: .horizontal)        }        .toolbar {            ToolbarItem(placement: .bottomBar) {                Button("Viewshed Settings") {                    isShowingSettings.toggle()                }                .popover(isPresented: $isShowingSettings) {                    ViewshedSettings(parameters: model.viewshedParameters)                        .presentationCompactAdaptation(.popover)                        .frame(idealWidth: 320, idealHeight: 380)                }            }        }        .task {            do {                try await model.setUp()            } catch {                self.error = error            }        }        .errorAlert(presentingError: $error)    }
    /// Moves the observer using given points.    /// - Parameters:    ///   - mapPoint: The map point to move the observer to.    ///   - screenPoint: The screen point corresponding to the map point.    private func moveObserver(to mapPoint: Point, screenPoint: CGPoint) {        let elevatedMapPoint = mapPoint.withBuilder { point in            point.z = model.viewshedParameters.observerPosition?.z ?? 0        }        model.viewshedParameters.observerPosition = elevatedMapPoint        model.observerGraphic.geometry = elevatedMapPoint
        observerScreenPoint = screenPoint    }}
// MARK: Model
/// The view model for this sample.@MainActor@Observableprivate final class Model {    /// A analysis overlay for displaying the viewshed analysis.    let analysisOverlay = AnalysisOverlay()
    /// A graphics overlay for displaying the observer graphic.    let graphicsOverlay = GraphicsOverlay()
    /// A map with a imagery basemap initially centered on the Isle of Arran, Scotland.    let map: Map = {        let map = Map(basemapStyle: .arcGISImagery)        let initialExtent = Envelope(xRange: -583160 ... -575630, yRange: 7476430...7488550)        map.initialViewpoint = Viewpoint(boundingGeometry: initialExtent)        return map    }()
    /// A blue circle graphic used to represent the analysis' observer position.    let observerGraphic = Graphic(symbol: SimpleMarkerSymbol(color: .blue, size: 10))
    /// The parameters for creating and controlling the viewshed analysis.    let viewshedParameters: ViewshedParameters = {        let parameters = ViewshedParameters()        parameters.fieldOfView = 150        parameters.heading = 10        parameters.maxRadius = 8000        parameters.observerPosition = Point(            x: -579246,            y: 7479619,            z: 20,            spatialReference: .webMercator        )        parameters.targetHeight = 20        return parameters    }()
    /// Creates and adds a viewshed analysis to the analysis overlay.    func setUp() async throws {        // Creates a discrete field viewshed function using a TIF file and viewshed parameters.        let elevationField = try await ContinuousField.field(fromFilesAt: [.arranTIF], bandIndex: 0)        let elevationFunction = ContinuousFieldFunction.function(withResult: elevationField)        let viewshedFunction = ViewshedFunction(            elevation: elevationFunction,            parameters: viewshedParameters        )        let discreteViewshed = viewshedFunction.toDiscreteFieldFunction()
        // Creates a colormap renderer to visualize the visible and non-visible results.        let notVisibleColor: UIColor = .gray.withAlphaComponent(0.7)        let visibleColor: UIColor = .green.withAlphaComponent(0.3)        let colormapRenderer = ColormapRenderer(colors: [notVisibleColor, visibleColor])
        // Creates an analysis and adds it to the analysis overlay to display it.        let viewshedAnalysis = FieldAnalysis(function: discreteViewshed, renderer: colormapRenderer)        analysisOverlay.addAnalysis(viewshedAnalysis)
        // Sets up a graphic to represent the viewshed analysis' observer.        observerGraphic.geometry = viewshedParameters.observerPosition        graphicsOverlay.addGraphic(observerGraphic)    }}
// MARK: Helper Views
/// Controls for adjusting a viewshed analysis.private struct ViewshedSettings: View {    /// The parameters for controlling the viewshed analysis.    let parameters: ViewshedParameters
    /// The interval at which the elevation source is sampled.    @State private var elevationSamplingInterval = 0.0    /// The field of view of the observer.    @State private var fieldOfView = Measurement(value: 0, unit: UnitAngle.degrees)    /// The direction that the observer is facing.    @State private var heading = Measurement(value: 0, unit: UnitAngle.degrees)    /// The maximum radius for the viewshed calculation.    @State private var maxRadius = Measurement(value: 0, unit: UnitLength.meters)    /// The elevation of the observer position in 3D space.    @State private var observerElevation = Measurement(value: 0, unit: UnitLength.meters)    /// The height of the target.    @State private var targetHeight = Measurement(value: 0, unit: UnitLength.meters)
    var body: some View {        Form {            Group {                VStack {                    LabeledContent("Observer Elevation", value: observerElevation, format: .length)                    Slider(value: $observerElevation.value, in: 2...200, step: 1)                        .onChange(of: observerElevation) {                            parameters.observerPosition = parameters.observerPosition?.withBuilder {                                $0.z = observerElevation.value                            }                        }                }                VStack {                    LabeledContent("Target Height", value: targetHeight, format: .length)                    Slider(value: $targetHeight.value, in: 20...1000, step: 10)                        .onChange(of: targetHeight) {                            parameters.targetHeight = targetHeight.value                        }                }                VStack {                    LabeledContent("Max Radius", value: maxRadius, format: .length)                    Slider(value: $maxRadius.value, in: 2500...20000, step: 100)                        .onChange(of: maxRadius) {                            parameters.maxRadius = maxRadius.value                        }                }                VStack {                    LabeledContent("Field of View", value: fieldOfView, format: .angle)                    Slider(value: $fieldOfView.value, in: 5...360, step: 1)                        .onChange(of: fieldOfView) {                            parameters.fieldOfView = fieldOfView.value                        }                }                VStack {                    LabeledContent("Heading", value: heading, format: .angle)                    Slider(value: $heading.value, in: 0...360, step: 1)                        .onChange(of: heading) {                            parameters.heading = heading.value                        }                }                VStack {                    Text("Elevation Sampling Interval (m)")                    Picker("Elevation Sampling Interval", selection: $elevationSamplingInterval) {                        Text("0").tag(0.0)                        Text("10").tag(10.0)                        Text("20").tag(20.0)                    }                    .pickerStyle(.segmented)                    .onChange(of: elevationSamplingInterval) {                        parameters.elevationSamplingInterval = elevationSamplingInterval                    }                }            }#if targetEnvironment(macCatalyst)            .padding(.vertical)#endif        }        .onAppear {            // Sets the state property initial values using the parameters.            elevationSamplingInterval = parameters.elevationSamplingInterval            fieldOfView.value = parameters.fieldOfView            heading.value = parameters.heading            maxRadius.value = parameters.maxRadius ?? 0            observerElevation.value = parameters.observerPosition?.z ?? 0            targetHeight.value = parameters.targetHeight        }    }}
// MARK: Extensions
private extension CGPoint {    /// Returns the Euclidean distance from this point to another point.    /// - Parameter other: The point to measure the distance from.    func distance(from other: CGPoint) -> CGFloat {        let dx = other.x - x        let dy = other.y - y        return sqrt(dx * dx + dy * dy)    }}
private extension FormatStyle where Self == Measurement<UnitAngle>.FormatStyle {    /// A style for formatting a unit angle measurement.    static var angle: Self { .measurement(width: .narrow, usage: .asProvided) }}
private extension FormatStyle where Self == Measurement<UnitLength>.FormatStyle {    /// A style for formatting a unit length measurement.    static var length: Self { .measurement(width: .abbreviated, usage: .asProvided) }}
private extension URL {    /// A URL to a local GeoTIFF file containing elevation data of the Isle of Arran, Scotland.    static var arranTIF: URL {        Bundle.main.url(forResource: "arran", withExtension: "tif", subdirectory: "arran")!    }}