< meta name = "viewport" content = "width=device-width, initial-scale=1, shrink-to-fit=no" />
< title >Visualize historical track data | Sample | ArcGIS Maps SDK for JavaScript</ title >
<!-- Load the ArcGIS Maps SDK for JavaScript from CDN -->
< script type = "module" src = "https://js.arcgis.com/5.1/" ></ script >
< body class = "calcite-mode-dark" >
< div slot = "header" id = "header" >
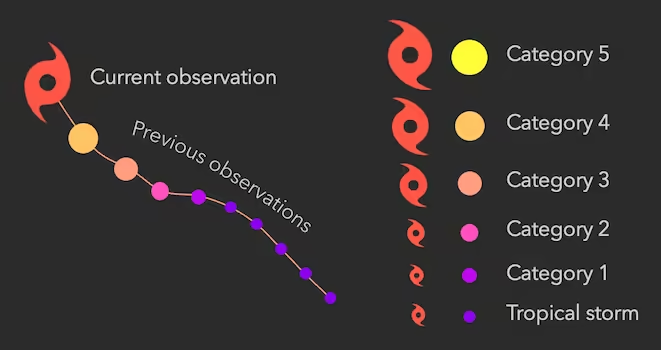
< div id = "heading" >Animated Hurricane Tracks (1970-2010)</ div >
Explore hurricanes from < calcite-select id = "year-select" ></ calcite-select > using the time slider below.
< arcgis-zoom slot = "top-left" ></ arcgis-zoom >
< arcgis-expand slot = "top-left" expand-icon = "legend" label = "Legend" >
< div id = "legend-content" >
< img src = "%prefix%/assets/sample-code/layers-geojson-trackinfo/legend.avif" id = "legend-img" alt = "Hurricane Image" />
< calcite-shell-panel id = "slider-panel" slot = "panel-bottom" >
mode = "cumulative-from-start"
reference-element = "arcgis-map"
const [ WebMap , Color , GeoJSONLayer , CIMSymbol ] = await $arcgis . import ([
"@arcgis/core/WebMap.js" ,
"@arcgis/core/layers/GeoJSONLayer.js" ,
"@arcgis/core/symbols/CIMSymbol.js" ,
const yearSlider = document . querySelector ( "arcgis-time-slider" );
const viewElement = document . querySelector ( "arcgis-map" );
const yearSelect = document . getElementById ( "year-select" );
await yearSelect . componentOnReady ();
for ( let year = 1970 ; year <= 2010 ; year ++ ) {
const option = document . createElement ( "calcite-option" );
option . label = ` ${ year } - ${ year + 1 } ` ;
option . selected = year === 2005 ;
yearSelect . appendChild ( option );
const endYear = startYear + 1 ;
// Esri color ramps - Plasma
const plasma = [ "#8d01efff" , "#bf09eeff" , "#ff51bdff" , "#ff9d82ff" , "#ffc666ff" , "#ffff35ff" ];
const colors = plasma . map (( c , i ) => {
const newColor = new Color ( c );
const hurricaneSymbol_north = new CIMSymbol ({
type : "CIMSymbolReference" ,
anchorPointUnits : "Relative" ,
billboardMode3D : "FaceNearPlane" ,
type : "CIMSymbolAnimationRotation" ,
// primitiveName: "scaleOverride",
animatedSymbolProperties : {
type : "CIMAnimatedSymbolProperties" ,
// primitiveName: "animationOverride",
randomizeStartTime : false ,
type : "CIMMarkerGraphic" ,
type : "CIMPolygonSymbol" ,
color : [ 255 , 87 , 71 , 255 ],
scaleSymbolsProportionally : true ,
clippingType : "Intersect" ,
type : "CIM3DSymbolProperties" ,
angleAlignment : "Display" ,
const hurricaneSymbol_south = new CIMSymbol ({
type : "CIMSymbolReference" ,
anchorPointUnits : "Relative" ,
billboardMode3D : "FaceNearPlane" ,
type : "CIMSymbolAnimationRotation" ,
// primitiveName: "scaleOverride",
animatedSymbolProperties : {
type : "CIMAnimatedSymbolProperties" ,
// primitiveName: "animationOverride",
randomizeStartTime : false ,
type : "CIMMarkerGraphic" ,
type : "CIMPolygonSymbol" ,
color : [ 255 , 87 , 71 , 255 ],
scaleSymbolsProportionally : true ,
clippingType : "Intersect" ,
type : "CIM3DSymbolProperties" ,
angleAlignment : "Display" ,
// Label expression for the latest observation
const latestObservationsNameLabelExpression = `
var label = iif($feature.Category > 0, $feature.Name + ' (' + $feature.Category + ')', $feature.Name);
if(!HasValue($view, [ "timeProperties", "currentEnd" ])) {
var e = $view.timeProperties.currentEnd;
var t = $feature.ISO_time;
var d = DateDiff(e, t, 'days');
// only show label if the storm is active
return iif(d <= 3, label, null);
const dateDiffExpression = `
if(!HasValue($view, [ "timeProperties", "currentEnd" ])) {
var e = $view.timeProperties.currentEnd;
var t = $feature.ISO_time;
var d = DateDiff(e, t, 'days');
const latestObservationsLowerLabelExpression = `
Text($feature.ISO_time, "MMM D, Y h:mm A"),
iif($feature.Category > 0, "Category " + $feature.Category, "Tropical Storm"),
$feature.wmo_wind + " mph"
var label = Concatenate(labelParts, TextFormatting.NewLine);
if(!HasValue($view, [ "timeProperties", "currentEnd" ])) {
var e = $view.timeProperties.currentEnd;
var t = $feature.ISO_time;
var d = DateDiff(e, t, 'days');
iif(d <= 10, label, null);
const previousObservationsRenderer = {
label : "Previous hurricane location" ,
const c = colors [ 5 ]. clone ();
// vary size and color of previous observations based on category
{ value : 0 , color : colors [ 0 ] },
{ value : 1 , color : colors [ 1 ] },
{ value : 2 , color : colors [ 2 ] },
{ value : 3 , color : colors [ 3 ] },
{ value : 4 , color : colors [ 4 ] },
{ value : 5 , color : colors [ 5 ] },
// fade previous observations based on position of time slider handle
valueExpression : dateDiffExpression ,
{ value : 7 , opacity : 1 },
{ value : 14 , opacity : 0.18 },
const latestObservationsRenderer = {
symbol : hurricaneSymbol_south ,
symbol : hurricaneSymbol_north ,
// vary size of latest observation based on category
// vary opacity of latest observation based on whether the storm is active
// an active storm is one that has an observation at the position of the time slider
// or was active within 3 days of the current time (this is for a fade out effect)
valueExpression : dateDiffExpression ,
{ value : 0 , opacity : 1 },
{ value : 3 , opacity : 0 },
const trackLinesRenderer = {
const c = colors [ 3 ]. clone ();
valueExpression : dateDiffExpression ,
{ value : 7 , opacity : 1 },
{ value : 14 , opacity : 0.18 },
const layer = new GeoJSONLayer ({
effect : "bloom(2, 1px, 10%)" ,
title : `Hurricanes ( ${ startYear } - ${ endYear } )` ,
id : "13e2698365a14b0c9e403e38dc92f779" ,
renderer : latestObservationsRenderer ,
definitionExpression : `Year >= ${ startYear } AND Year <= ${ endYear } ` ,
text : "Category {Category} storm with that occurred at {ISO_time}." ,
label : "Wind Speed (mph)" ,
dateFormat : "short-date-short-time" ,
startField : "ISO_time" , // the time the observation occurred
trackIdField : "Serial_Num" , // unique identifier for each track
// display all observations in the track for duration of user session
// display all observations for each track
maxDisplayObservationsPerTrack : 0 ,
title : "Hurricane {Name}" ,
content : "Average wind speed: {AVG_WIND} mph" ,
label : "Average Wind Speed" ,
// show previous observations as marker symbols
renderer : previousObservationsRenderer ,
// label recent observations with a fully opaque label
// label older observations with a semi-transparent label
deconflictionStrategy : "none" ,
labelPlacement : "center-right" ,
Text($feature.ISO_time, "MMM D, Y h:mm A"),
iif($feature.Category > 0, "Category " + $feature.Category, "Tropical Storm"),
$feature.wmo_wind + " mph"
var label = Concatenate(labelParts, TextFormatting.NewLine);
if(!HasValue($view, [ "timeProperties", "currentEnd" ])) {
var e = $view.timeProperties.currentEnd;
var t = $feature.ISO_time;
var d = DateDiff(e, t, 'days');
iif(d <= 10, label, null);
const c = colors [ 5 ]. clone ();
haloColor : "rgba(0,0,0,0.5)" ,
labelPlacement : "center-right" ,
Text($feature.ISO_time, "MMM D, Y h:mm A"),
iif($feature.Category > 0, "Category " + $feature.Category, "Tropical Storm"),
$feature.wmo_wind + " mph"
var label = Concatenate(labelParts, TextFormatting.NewLine);
if(!HasValue($view, [ "timeProperties", "currentEnd" ])) {
var e = $view.timeProperties.currentEnd;
var t = $feature.ISO_time;
var d = DateDiff(e, t, 'days');
iif(d > 10, label, null);
// show latest observation as an animated picture marker
// vary label size and color based on category
deconflictionStrategy : "none" ,
labelPlacement : "above-right" ,
expression : latestObservationsNameLabelExpression ,
deconflictionStrategy : "none" ,
labelPlacement : "above-right" ,
expression : latestObservationsNameLabelExpression ,
deconflictionStrategy : "none" ,
labelPlacement : "above-right" ,
expression : latestObservationsNameLabelExpression ,
deconflictionStrategy : "none" ,
labelPlacement : "above-right" ,
expression : latestObservationsNameLabelExpression ,
deconflictionStrategy : "none" ,
labelPlacement : "above-right" ,
expression : latestObservationsNameLabelExpression ,
deconflictionStrategy : "none" ,
labelPlacement : "above-right" ,
expression : latestObservationsNameLabelExpression ,
// when the user zooms in, show more detailed information
// about the storm, including the time of the observation
deconflictionStrategy : "none" ,
labelPlacement : "center-right" ,
expression : latestObservationsLowerLabelExpression ,
deconflictionStrategy : "none" ,
where : "Category >= 3 AND Category < 5" ,
labelPlacement : "center-right" ,
expression : latestObservationsLowerLabelExpression ,
deconflictionStrategy : "none" ,
labelPlacement : "center-right" ,
expression : latestObservationsLowerLabelExpression ,
renderer : latestObservationsRenderer ,
renderer : trackLinesRenderer ,
onStatisticField : "wmo_wind" ,
viewElement . map = new WebMap ({
id : "5d36c6e206674a4f960f12e4e83f767b" ,
const start = new Date ( startYear , 0 , 1 );
const end = new Date ( endYear , 11 , 31 );
yearSlider . fullTimeExtent = {
yearSlider . timeExtent = {
// start the app at this date
start : new Date ( startYear , 8 , 22 ),
end : new Date ( startYear , 8 , 22 ),
viewElement . timeExtent = yearSlider . timeExtent ;
yearSelect . addEventListener ( "calciteSelectChange" , ( event ) => {
const selectedYear = parseInt ( yearSelect . value );
const newStart = new Date ( selectedYear , 0 , 1 );
const newEnd = new Date ( selectedYear + 1 , 11 , 31 );
yearSlider . fullTimeExtent = {
yearSlider . timeExtent = {
viewElement . timeExtent = yearSlider . timeExtent ;
layer . definitionExpression = `Year >= ${ selectedYear } AND Year <= ${ selectedYear + 1 } ` ;