Population Density by Race in the United States
This app visualizes population density by race in the U.S. based on current population estimates as determined by the American Community Survey (ACS).
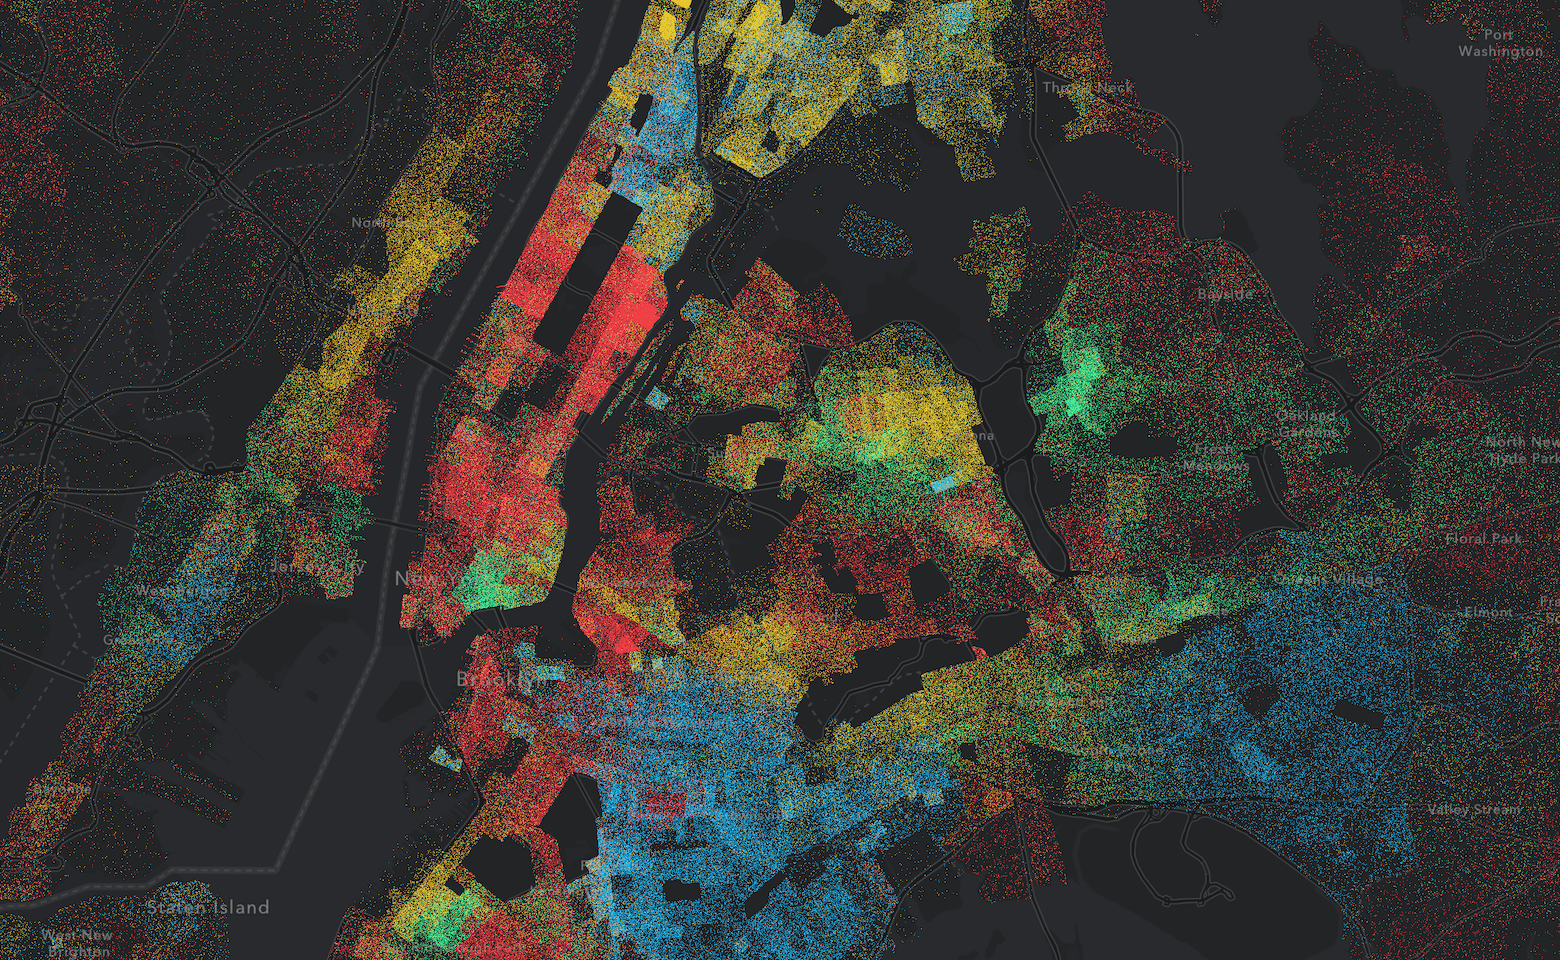
What it does
Visualize U.S. population density by race based on current population estimates as determined by the American Community Survey (ACS). Each dot represents 800 people at the initial scale, and the value of each dot changes as you zoom in and out. Hover over the legend to emphasize individual categories of the data and to explore new patterns.
This app was presented in the 2019 Esri Developer Summit Plenary Session. Click here to view the presentation on YouTube.
Under the hood
Visualize population density differences by assigning a population value to each dot.
Get an enhanced user experience thru rapid visualization updates.
Explore individual categories of data by interacting with Legend elements.
The data is rendered using dynamic feature tiles, and can be queried, highlighted and analyzed. User can interact with the data via popups.