Hurricane Explorer
Visualize and query hurricanes using powerful client-side processing
What it does
NOAA hurricane data is reprojected on the fly from latitude/longitude coordinates to a projection centered on the south pole to showcase paths taken by hurricanes. Hurricane tracks can be interrogated interactively to visualize hurricanes with the highest wind speed closest to the mouse pointer and the path it took.
Under the hood
A CSV file is parsed and loaded as a point layer by dragging and dropping it on the app.
Points are projected the fly from one spatial reference to another using the client-side projection engine.
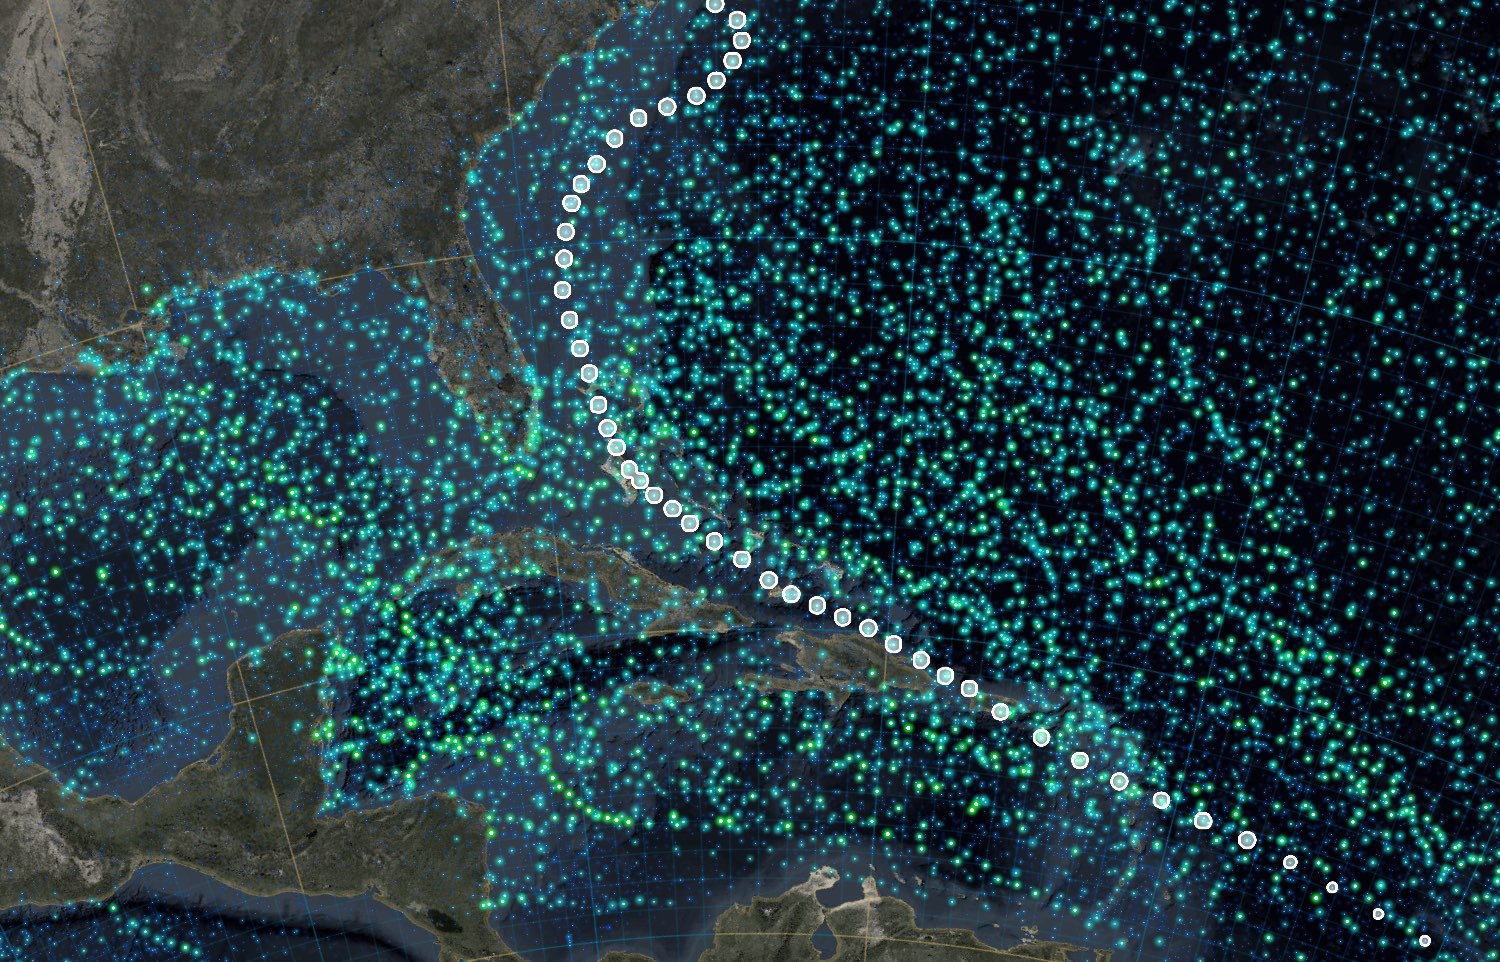
The hurricane wind speed recorded in each location is used to drive each reading’s color. This map uses FireFly cartography which allows the thematic hurricane layer to “glow” on top of a desaturated basemap.
A client-side spatial query is performed to find the highest windspeed close to the mouse pointer, the hurricane track associated with the high wind speed is highlighted, and then statistics about the hurricane are calculated and displayed.