U.S. Vessel Traffic
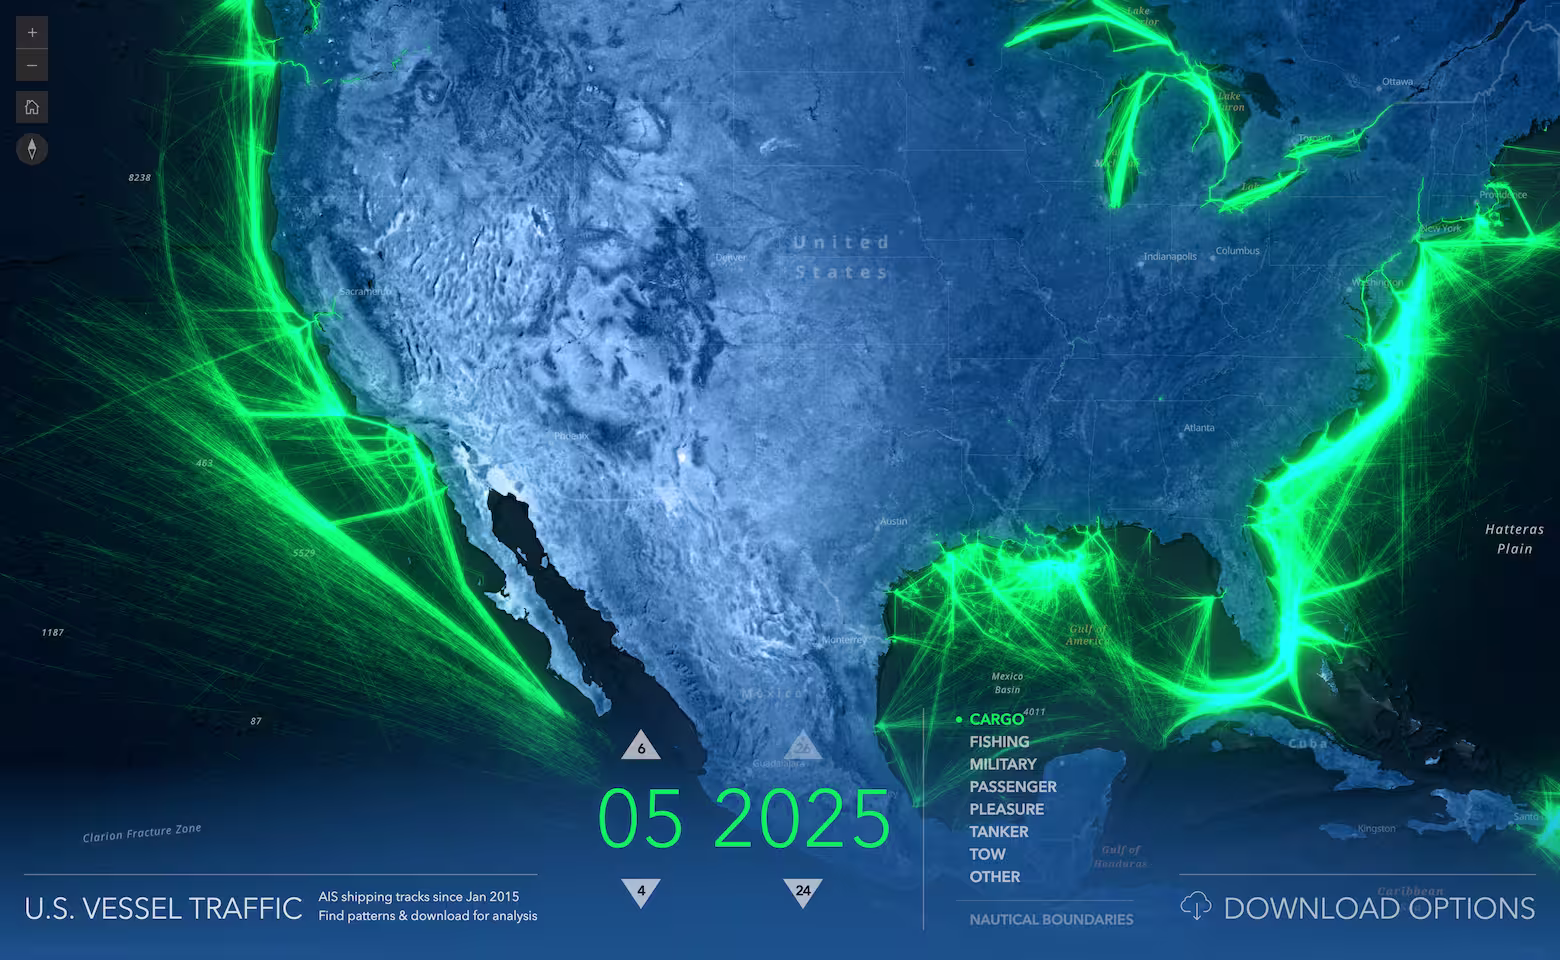
Explore U.S. maritime activity, analyze spatial patterns, and download shipping tracks since Jan 2015.
What it does
Visualize U.S. vessel traffic by month and category and download the tracks for further analysis. Vessel traffic data is from USCG, NOAA and BOEM through Marine Cadastre, helping marine spatial planners better understand users of ocean space and identify potential space-use conflicts.
Under the hood
Create themed cartography with a custom basemap and background color in map. The app uses three different layers, each with specific blend modes and effects applied for the best visual experience.
Layer effects, like bloom used in this app, can emphasize features and elevate cartography in a similar way as CSS filter-like functions. They may be applied to layers or filtered features, and set to change with scale.
Vector Tile Layer delivers styled maps as cached raster map tiles with vector map data. Feature Layer powers vector features with maximum interactivity and visualization flexibility. Choose the best layer type(s) to achieve optimized performance and user experience.
Use out-of-box map components such as Home and Compass to easily add common mapping workflows into your application.