Display common symbols for all graphics in a graphics overlay with a renderer.
Use case
Graphics are often used to display data that changes location regularly because they are held in memory instead of being persisted to the map. When a number of graphics are required to share the same style, a simple renderer can be applied to the graphics overlay containing the graphics. For example, the location of mobile taxis from a same company could be plotted on a map with each taxi marked by a relevant symbol.
How to use the sample
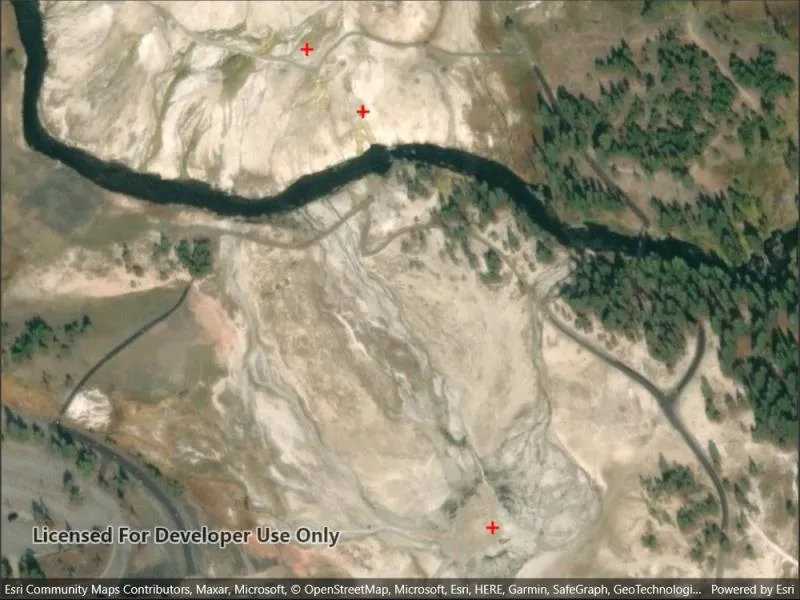
The sample loads with a predefined simple renderer, which displays a red cross simple marker symbol for the graphics in the graphics overlay.
How it works
- Create a
GraphicsOverlay. - Create a number of
Pointobjects with x, y and spatial reference parameters. - Create a
SimpleMarkerSymbolpassing in aSimpleMarkerSymbol.Style, color and size as parameters. - Create a simple renderer with
SimpleRenderer(simpleMarkerSymbol). - Set the simple renderer to the graphics overlay using
graphicsOverlay.setRenderer(simpleRenderer). - Create a number of
Graphicobjects with the points initiated in step 2. - Add the graphics to the graphics overlay with
graphicsOverlay.Graphics.Add(graphic).
Relevant API
- Graphic
- GraphicsOverlay
- Point
- SimpleMarkerSymbol
- SimpleRenderer
Additional information
Renderers are used to display graphics that don’t already have a symbol set. A renderer will not override a graphic’s symbol if one has been set.
Tags
graphics, marker, renderer, symbol, symbolize, symbology
Sample code
// Copyright 2022 Esri.//// Licensed under the Apache License, Version 2.0 (the "License"); you may not use this file except in compliance with the License.// You may obtain a copy of the License at: http://www.apache.org/licenses/LICENSE-2.0//// Unless required by applicable law or agreed to in writing, software distributed under the License is distributed on an// "AS IS" BASIS, WITHOUT WARRANTIES OR CONDITIONS OF ANY KIND, either express or implied. See the License for the specific// language governing permissions and limitations under the License.
using Esri.ArcGISRuntime.Geometry;using Esri.ArcGISRuntime.Mapping;using Esri.ArcGISRuntime.Symbology;using Esri.ArcGISRuntime.UI;
using Colors = System.Drawing.Color;
namespace ArcGIS.Samples.SimpleRenderers{    [ArcGIS.Samples.Shared.Attributes.Sample(        name: "Simple renderer",        category: "Symbology",        description: "Display common symbols for all graphics in a graphics overlay with a renderer.",        instructions: "The sample loads with a predefined simple renderer, which displays a red cross simple marker symbol for the graphics in the graphics overlay.",        tags: new[] { "graphics", "marker", "renderer", "symbol", "symbolize", "symbology" })]    public partial class SimpleRenderers : ContentPage    {        public SimpleRenderers()        {            InitializeComponent();
            // Create the UI, setup the control references and execute initialization.            Initialize();        }
        private void Initialize()        {            // Create new map with basemap layer.            Map myMap = new Map(BasemapStyle.ArcGISImagery);
            // Create several map points using the WGS84 coordinates (latitude and longitude).            MapPoint oldFaithfulPoint = new MapPoint(-110.828140, 44.460458, SpatialReferences.Wgs84);            MapPoint cascadeGeyserPoint = new MapPoint(-110.829004, 44.462438, SpatialReferences.Wgs84);            MapPoint plumeGeyserPoint = new MapPoint(-110.829381, 44.462735, SpatialReferences.Wgs84);
            // Use the two points farthest apart to create an envelope.            Envelope initialEnvelope = new Envelope(oldFaithfulPoint, plumeGeyserPoint);
            // Use the envelope to define the map views visible area (include some padding around the extent).            myMap.InitialViewpoint = new Viewpoint(initialEnvelope);
            // Add the map to the map view.            MyMapView.Map = myMap;
            // Set the viewpoint to the envelope with padding.            MyMapView.SetViewpointGeometryAsync(initialEnvelope, 50);
            // Create a graphics overlay .            GraphicsOverlay myGraphicOverlay = new GraphicsOverlay();
            // Create graphics based upon the map points.            Graphic oldFaithfulGraphic = new Graphic(oldFaithfulPoint);            Graphic cascadeGeyserGraphic = new Graphic(cascadeGeyserPoint);            Graphic plumeGeyserGraphic = new Graphic(plumeGeyserPoint);
            // Add the graphics to the graphics overlay.            myGraphicOverlay.Graphics.Add(oldFaithfulGraphic);            myGraphicOverlay.Graphics.Add(cascadeGeyserGraphic);            myGraphicOverlay.Graphics.Add(plumeGeyserGraphic);
            // Create a simple marker symbol - red, cross, size 12.            SimpleMarkerSymbol mySymbol = new SimpleMarkerSymbol(SimpleMarkerSymbolStyle.Cross, Colors.Red, 12);
            // Create a simple renderer based on the simple marker symbol.            SimpleRenderer myRenderer = new SimpleRenderer(mySymbol);
            // Apply the renderer to the graphics overlay (all graphics use the same symbol).            myGraphicOverlay.Renderer = myRenderer;
// Add the graphics overlay to the map view. MyMapView.GraphicsOverlays.Add(myGraphicOverlay); } }}<?xml version="1.0" encoding="utf-8" ?><ContentPage x:Class="ArcGIS.Samples.SimpleRenderers.SimpleRenderers" xmlns="http://schemas.microsoft.com/dotnet/2021/maui" xmlns:x="http://schemas.microsoft.com/winfx/2009/xaml" xmlns:esriUI="clr-namespace:Esri.ArcGISRuntime.Maui;assembly=Esri.ArcGISRuntime.Maui"> <Grid> <esriUI:MapView x:Name="MyMapView" /> </Grid></ContentPage>