Perform a line of sight analysis in a map view between fixed observer and target positions.
Use case
Line of sight analysis determines whether a target can be seen from one or more observer locations based on elevation data. This can support planning workflows such as siting communication equipment, assessing observation coverage, or evaluating potential obstructions between known locations. In this sample, several predefined observer points are evaluated against a single fixed target to compare visibility outcomes side by side.
Note: This analysis is a form of “data-driven analysis”, which means the analysis is calculated at the resolution of the data rather than the resolution of the display.
How to use the sample
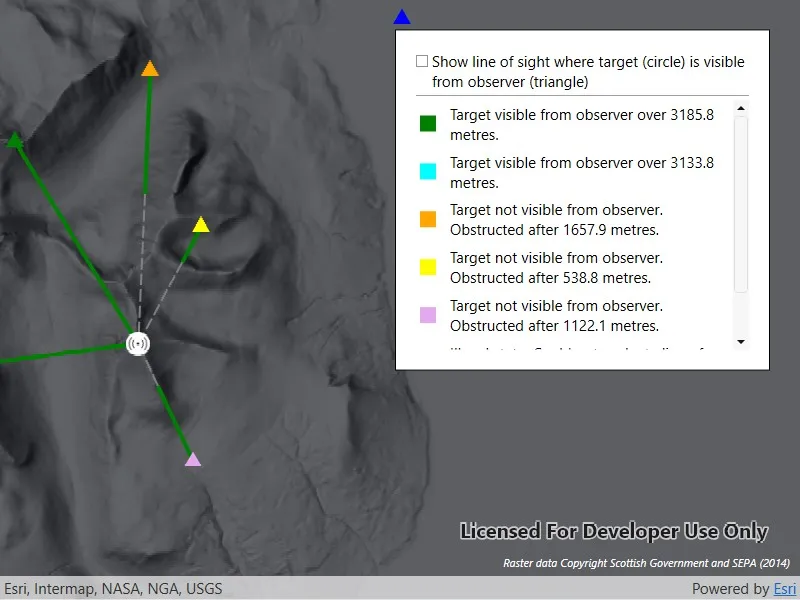
The sample loads with a map centered on the Isle of Arran, Scotland, and runs a line of sight analysis from multiple observer points (triangles) to a fixed target point (beacon icon) located at the highest point of the island. Solid green line segments represent visible portions of each line of sight result, and dashed gray segments represent not visible portions. For each observer, the information panel reports whether the target is visible and over what distance the line remains unobstructed. Use the checkbox in the panel to show only results where the target is visible from the observer.
How it works
- Create a
Mapand set it on aMapView. - Create a
GraphicsOverlayand add target and observer points to it, along with an appropriate symbol. Create anotherGraphicsOverlaythat will display the line of sight result graphics. - Create a
ContinuousFieldfrom a raster file containing elevation data. - Create a list of
LineOfSightPositionfrom target and observerMapPoints and aHeightOrigin.Relative. - Configure
LineOfSightParameterswith a newObserverTargetPairs, passing the list of observer and target line of sight positions. - Create a
LineOfSightFunctionfrom the continuous field and line of sight parameters. - Evaluate the function to get
LineOfSightresults. - Create a
Graphicfrom each result, using the geometry of the result’sVisibleLineorNotVisibleLineresult, and an appropriate symbol. - Use
LineOfSight.TargetVisibilityto determine if the observer position has a direct line of sight to the target position. - Check for
LineOfSight.Errors and get the length of the visible line result withGeometryEngine.LengthGeodeticto report results.
Relevant API
- ContinuousField
- GeometryEngine
- GraphicsOverlay
- LineOfSight
- LineOfSightFunction
- LineOfSightParameters
- LineOfSightPosition
- ObserverTargetPairs
About the data
The sample uses a 10m resolution digital terrain elevation raster of the Isle of Arran, Scotland (Raster data Copyright Scottish Government and SEPA (2014)).
Tags
analysis, elevation, line of sight, map view, spatial analysis, terrain, visibility
Sample code
// Copyright 2026 Esri.//// Licensed under the Apache License, Version 2.0 (the "License"); you may not use this file except in compliance with the License.// You may obtain a copy of the License at: http://www.apache.org/licenses/LICENSE-2.0//// Unless required by applicable law or agreed to in writing, software distributed under the License is distributed on an// "AS IS" BASIS, WITHOUT WARRANTIES OR CONDITIONS OF ANY KIND, either express or implied. See the License for the specific// language governing permissions and limitations under the License.
using ArcGIS.Samples.Managers;using Esri.ArcGISRuntime.Analysis;using Esri.ArcGISRuntime.Analysis.Visibility;using Esri.ArcGISRuntime.Geometry;using Esri.ArcGISRuntime.Mapping;using Esri.ArcGISRuntime.Symbology;using Esri.ArcGISRuntime.UI;using System;using System.Collections.Generic;using System.IO;using System.Linq;using System.Threading.Tasks;using System.Windows;using System.Windows.Media;using Color = System.Drawing.Color;
namespace ArcGIS.WPF.Samples.ShowLineOfSightAnalysisOnMap{    [ArcGIS.Samples.Shared.Attributes.Sample(        name: "Show line of sight analysis in map",        category: "Analysis",        description: "Perform a line of sight analysis in a map view between fixed observer and target positions.",        instructions: "The sample loads with a map centered on the Isle of Arran, Scotland, and runs a line of sight analysis from multiple observer points (triangles) to a fixed target point (beacon icon) located at the highest point of the island. Solid green line segments represent visible portions of each line of sight result, and dashed gray segments represent not visible portions. For each observer, the information panel reports whether the target is visible and over what distance the line remains unobstructed. Use the checkbox in the panel to show only results where the target is visible from the observer.",        tags: new[] { "analysis", "elevation", "line of sight", "map view", "spatial analysis", "terrain", "visibility" })]    [ArcGIS.Samples.Shared.Attributes.OfflineData("aa97788593e34a32bcaae33947fdc271")]    [ArcGIS.Samples.Shared.Attributes.EmbeddedResource(@"PictureMarkerSymbols\beacon.png")]    public partial class ShowLineOfSightAnalysisOnMap    {        private const double RelativeHeightMeters = 5.0;
        // Target position (radio mast/receiver location).        private readonly MapPoint _targetPosition = new MapPoint(            -577955.365, 7484288.220, RelativeHeightMeters,            SpatialReferences.WebMercator);
        // Observer positions with associated colors.        private static readonly (Color Color, double X, double Y)[] ObserverSeeds =        {            (Color.Green, -580893.546, 7489102.890),            (Color.Cyan, -583446.004, 7483567.462),            (Color.Orange, -577665.236, 7490792.908),            (Color.Yellow, -576452.981, 7487071.388),            (Color.FromArgb(255, 228, 168, 239), -576650.067, 7481479.772), // light purple            (Color.Blue, -571683.896, 7492017.864),        };
        // Graphics overlay for the analysis results.        private GraphicsOverlay _resultsGraphicsOverlay;
        // Symbols for visible and not-visible line segments.        private readonly SimpleLineSymbol _visibleLineSymbol = new SimpleLineSymbol(            SimpleLineSymbolStyle.Solid, Color.Green, 4);
        private readonly SimpleLineSymbol _notVisibleLineSymbol = new SimpleLineSymbol(            SimpleLineSymbolStyle.LongDash, Color.Gray, 2);
        public ShowLineOfSightAnalysisOnMap()        {            InitializeComponent();            _ = Initialize();        }
        // Set up the map, graphics overlays, and perform the line of sight analysis.        private async Task Initialize()        {            // Create a map with a dark hillshade basemap and set the initial viewpoint to the Isle of Arran, Scotland.            MyMapView.Map = new Map(BasemapStyle.ArcGISHillshadeDark)            {                InitialViewpoint = new Viewpoint(55.632572, -5.135883, 90000)            };
            // Create graphics overlays for results and position markers.            _resultsGraphicsOverlay = new GraphicsOverlay();            var positionsGraphicsOverlay = new GraphicsOverlay();            MyMapView.GraphicsOverlays.Add(_resultsGraphicsOverlay);            MyMapView.GraphicsOverlays.Add(positionsGraphicsOverlay);
            try            {                // Create a beacon symbol from an embedded resource image for the target point graphic.                string resourceStreamName = GetType().Assembly.GetManifestResourceNames().Single(str => str.EndsWith("beacon.png"));                PictureMarkerSymbol beaconSymbol;                using (Stream resourceStream = GetType().Assembly.GetManifestResourceStream(resourceStreamName))                {                    beaconSymbol = await PictureMarkerSymbol.CreateAsync(resourceStream);                    beaconSymbol.Width = 24;                    beaconSymbol.Height = 24;                }                positionsGraphicsOverlay.Graphics.Add(new Graphic(_targetPosition, beaconSymbol));
                // Add observer position graphics using triangle marker symbols.                foreach (var seed in ObserverSeeds)                {                    var observerPoint = new MapPoint(seed.X, seed.Y, RelativeHeightMeters, SpatialReferences.WebMercator);                    var observerSymbol = new SimpleMarkerSymbol(SimpleMarkerSymbolStyle.Triangle, seed.Color, 15);                    positionsGraphicsOverlay.Graphics.Add(new Graphic(observerPoint, observerSymbol));                }
                // Get the path to the locally stored elevation raster file.                string rasterPath = DataManager.GetDataFolder("aa97788593e34a32bcaae33947fdc271", "arran.tif");
                // Create a continuous field from the elevation raster file.                var continuousField = await ContinuousField.CreateAsync(new[] { rasterPath }, 0);
                // Create a line of sight position for the target.                var targetPosition = new LineOfSightPosition(_targetPosition, HeightOrigin.Relative);
                // Create line of sight positions for each observer.                var observerPositions = ObserverSeeds.Select(seed =>                    new LineOfSightPosition(                        new MapPoint(seed.X, seed.Y, RelativeHeightMeters, SpatialReferences.WebMercator),                        HeightOrigin.Relative)).ToList();
                // Create line of sight parameters with many-to-many observer-target pairs.                var parameters = new LineOfSightParameters                {                    ObserverTargetPairs = new ObserverTargetPairs(                        observerPositions, new[] { targetPosition })                };
                // Create line of sight function with the continuous field and parameters.                var lineOfSightFunction = new LineOfSightFunction(continuousField, parameters);
                // Evaluate the line of sight function.                var results = await lineOfSightFunction.EvaluateAsync();
                // Add result line graphics to the results graphics overlay.                foreach (var result in results)                {                    var targetVisibility = result.TargetVisibility;
                    if (result.VisibleLine != null)                    {                        var graphic = new Graphic(result.VisibleLine, _visibleLineSymbol);                        graphic.Attributes["TargetVisibility"] = targetVisibility;                        _resultsGraphicsOverlay.Graphics.Add(graphic);                    }
                    if (result.NotVisibleLine != null)                    {                        var graphic = new Graphic(result.NotVisibleLine, _notVisibleLineSymbol);                        graphic.Attributes["TargetVisibility"] = targetVisibility;                        _resultsGraphicsOverlay.Graphics.Add(graphic);                    }                }
                // Build observer summaries for the info panel.                ResultsItemsControl.ItemsSource = BuildObserverSummaries(results);            }            catch (Exception ex)            {                MessageBox.Show(ex.Message, "Error");            }        }
        // Build a list of observer result summaries from the line of sight results for display in the info panel.        private List<ObserverResultSummary> BuildObserverSummaries(IReadOnlyList<LineOfSight> results)        {            var summaries = new List<ObserverResultSummary>();            for (int i = 0; i < results.Count; i++)            {                var result = results[i];
                // Get the length of the visible line if it exists.                var visibleLength = result.VisibleLine == null ? 0 :                    GeometryEngine.LengthGeodetic(result.VisibleLine, LinearUnits.Meters, GeodeticCurveType.Geodesic);
                // Set the info text based on the results of the analysis.                string infoText;                if (result.Error != null)                    infoText = result.Error.Message;                else if (result.NotVisibleLine == null)                    infoText = $"Target visible from observer over {visibleLength:F1} metres.";                else                    infoText = $"Target not visible from observer. Obstructed after {visibleLength:F1} metres.";
                var color = ObserverSeeds[i].Color;                var brush = new SolidColorBrush(                    System.Windows.Media.Color.FromArgb(color.A, color.R, color.G, color.B));
                summaries.Add(new ObserverResultSummary { ObserverBrush = brush, InfoText = infoText });            }            return summaries;        }
        // Filter the result line graphics based on the checkbox state to show only visible lines.        private void VisibleOnlyCheckBox_Changed(object sender, RoutedEventArgs e)        {            if (_resultsGraphicsOverlay == null) return;
            bool showVisibleOnly = VisibleOnlyCheckBox.IsChecked == true;
            foreach (var graphic in _resultsGraphicsOverlay.Graphics)            {                // TargetVisibility value of 1.0 indicates the target is visible from the observer.                bool isVisible = Convert.ToDouble(graphic.Attributes["TargetVisibility"]) == 1.0;                graphic.IsVisible = !showVisibleOnly || isVisible;            }        }    }
// Holds summary information for an observer position to show in the info panel. public class ObserverResultSummary { public SolidColorBrush ObserverBrush { get; set; } public string InfoText { get; set; } }}<UserControl x:Class="ArcGIS.WPF.Samples.ShowLineOfSightAnalysisOnMap.ShowLineOfSightAnalysisOnMap" xmlns="http://schemas.microsoft.com/winfx/2006/xaml/presentation" xmlns:x="http://schemas.microsoft.com/winfx/2006/xaml" xmlns:esri="http://schemas.esri.com/arcgis/runtime/2013"> <Grid> <esri:MapView x:Name="MyMapView" /> <Border Style="{StaticResource BorderStyle}" MaxWidth="620"> <Grid> <Grid.RowDefinitions> <RowDefinition Height="Auto" /> <RowDefinition Height="Auto" /> <RowDefinition Height="250" /> </Grid.RowDefinitions> <CheckBox x:Name="VisibleOnlyCheckBox" Grid.Row="0" Content="Show line of sight where target (circle) is visible from observer (triangle)" Checked="VisibleOnlyCheckBox_Changed" Unchecked="VisibleOnlyCheckBox_Changed" /> <Separator Grid.Row="1" Margin="0,4" /> <ScrollViewer Grid.Row="2" VerticalScrollBarVisibility="Visible"> <ItemsControl x:Name="ResultsItemsControl"> <ItemsControl.ItemTemplate> <DataTemplate> <Grid Margin="0,2"> <Grid.ColumnDefinitions> <ColumnDefinition Width="30" /> <ColumnDefinition Width="*" /> </Grid.ColumnDefinitions> <Rectangle Grid.Column="0" Width="16" Height="16" Fill="{Binding ObserverBrush}" HorizontalAlignment="Left" Margin="4,0,0,0" /> <TextBlock Grid.Column="1" Text="{Binding InfoText}" TextWrapping="Wrap" Margin="4,2" /> </Grid> </DataTemplate> </ItemsControl.ItemTemplate> </ItemsControl> </ScrollViewer> </Grid> </Border> <TextBlock Margin="0,0,10,30" HorizontalAlignment="Right" VerticalAlignment="Bottom" FontSize="11" FontStyle="Italic" Foreground="White" Text="Raster data Copyright Scottish Government and SEPA (2014)" TextWrapping="Wrap" /> </Grid></UserControl>