Query a feature table for statistics, grouping and sorting by different fields.
Use case
You can use statistical queries, grouping and sorting to process large amounts of data saved in feature tables. This is helpful for identifying trends and relationships within the data, which can be used to support further interpretations and decisions. For example, a health agency can use information on medical conditions occurring throughout a country to identify at-risk areas or demographics, and decide on further action and preventive measures.
How to use the sample
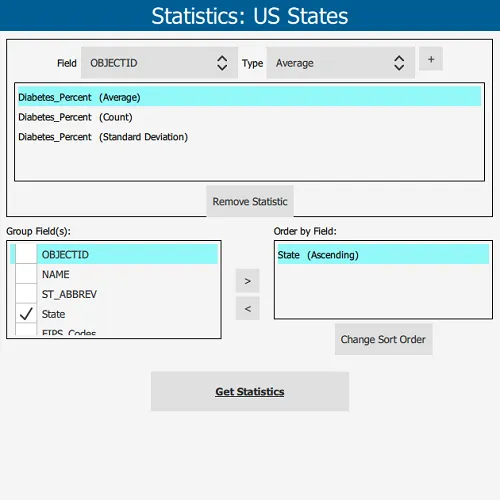
The sample will start with some default options selected. You can immediately click the “Get Statistics” button to see the results for these options. There are several ways to customize your queries:
- You can add statistic definitions to the top-left table using the combo boxes and “Add” button. Select a table row and click “Remove” to remove a definition.
- To change the Group-by fields, check the box by the field you want to group by in the bottom-left list view.
- To change the Order-by fields, select a Group-by field (it must be checked) and click the ”>>” button to add it to the Order-by table. To remove a field from the Order-by table, select it and click the ”<<” button. To change the sort order of the Order-by field, the cells of the “Sort Order” column are combo-boxes that may be either ASCENDING or DESCENDING.
How it works
- Create a
ServiceFeatureTableusing the URL of a feature service and load the table. - Get the feature tables field names list with
featureTable::getFields(). - Create
StatisticDefinitions specifying the field to compute statistics on and theStatisticTypeto compute. - Create
StatisticsQueryParameterspassing in the list of statistic definitions. - To have the results grouped by fields, add the field names to the query parameters’
groupByFieldNamescollection. - To have the results ordered by fields, create
OrderBys, specifying the field name andSortOrder. Pass theseOrderBys to the parameters’orderByFieldscollection. - To execute the query, call
featureTable::queryStatisticsAsync(queryParameters). - Get the
StatisticQueryResult. From this, you can get an iterator ofStatisticRecords to loop through and display.
Relevant API
- Field
- OrderBy
- QueryParameters
- ServiceFeatureTable
- StatisticDefinition
- StatisticRecord
- StatisticsQueryParameters
- StatisticsQueryResult
- StatisticType
About the data
This sample uses a Diabetes, Obesity, and Inactivity by US County feature layer hosted on ArcGIS Online.
Tags
correlation, data, fields, filter, group, sort, statistics, table
Sample code
// [WriteFile Name=StatisticalQueryGroupSort, Category=Analysis]// [Legal]// Copyright 2017 Esri.//// Licensed under the Apache License, Version 2.0 (the "License");// you may not use this file except in compliance with the License.// You may obtain a copy of the License at// http://www.apache.org/licenses/LICENSE-2.0//// Unless required by applicable law or agreed to in writing, software// distributed under the License is distributed on an "AS IS" BASIS,// WITHOUT WARRANTIES OR CONDITIONS OF ANY KIND, either express or implied.// See the License for the specific language governing permissions and// limitations under the License.// [Legal]
#ifdef PCH_BUILD#include "pch.hpp"#endif // PCH_BUILD
// sample headers#include "StatisticResultListModel.h"#include "StatisticalQueryGroupSort.h"
// ArcGIS Maps SDK headers#include "CoreTypes.h"#include "Error.h"#include "Field.h"#include "OrderBy.h"#include "ServiceFeatureTable.h"#include "StatisticDefinition.h"#include "StatisticRecord.h"#include "StatisticRecordIterator.h"#include "StatisticsQueryParameters.h"#include "StatisticsQueryResult.h"
// Qt headers#include <QFuture>#include <QList>#include <QStringList>#include <QUuid>#include <QVariantList>
// STL headers#include <memory>
using namespace Esri::ArcGISRuntime;
StatisticalQueryGroupSort::StatisticalQueryGroupSort(QQuickItem* parent /* = nullptr */):  QQuickItem(parent),  m_resultsModel(new StatisticResultListModel(this)){}
void StatisticalQueryGroupSort::init(){  qmlRegisterType<StatisticalQueryGroupSort>("Esri.Samples", 1, 0, "StatisticalQueryGroupSortSample");}
void StatisticalQueryGroupSort::componentComplete(){  QQuickItem::componentComplete();
  // Create the Service Feature Table  m_featureTable = new ServiceFeatureTable(QUrl("https://services.arcgis.com/jIL9msH9OI208GCb/arcgis/rest/services/Counties_Obesity_Inactivity_Diabetes_2013/FeatureServer/0"), this);  connectSignals();  m_featureTable->load();
  // Setup default values for the Options page  addStatisticDefinition("Diabetes_Percent", "Average");  addStatisticDefinition("Diabetes_Percent", "Count");  addStatisticDefinition("Diabetes_Percent", "Standard Deviation");  addOrderBy("State", "Ascending");  m_statisticTypes << "Average" << "Count" << "Maximum" << "Minimum"                   << "Standard Deviation" << "Sum" << "Variance";  emit statisticTypesChanged();}
void StatisticalQueryGroupSort::connectSignals(){  connect(m_featureTable, &ServiceFeatureTable::doneLoading, this, [this](const Error& error)  {    if (!error.isEmpty())      return;
    const auto fields = m_featureTable->fields();    for (const Field& field : fields)    {      m_fields << field.name();    }    emit fieldsChanged();  });
  connect(m_featureTable, &ServiceFeatureTable::errorOccurred, this, [this](const Error& error)  {    if (error.isEmpty())      return;
    m_resultsModel->clear();    addResultToModel("", QString("Error. %1").arg(error.message()));  });}
void StatisticalQueryGroupSort::onQueryStatisticsCompleted_(StatisticsQueryResult* rawResult){  // Delete rawResult when we leave local scope.  auto result = std::unique_ptr<StatisticsQueryResult>(rawResult);
  if (!result)    return;
  // clear previous results  m_resultsModel->clear();
  // iterate the results and add to a model  StatisticRecordIterator iter = result->iterator();  while (iter.hasNext())  {    // get the statistic record    StatisticRecord* record = iter.next();
    // get the group string    QStringList sectionStrings;    const QVariantMap& groupsMap = record->group();    for (auto it = groupsMap.cbegin(); it != groupsMap.cend(); ++it)    {      sectionStrings << QString("\"%1\":\"%2\"").arg(it.key(), it.value().toString());    }    const QString sectionString = sectionStrings.join(',');
    // obtain the statistics    const QVariantMap& statsMap = record->statistics();    for (auto it = statsMap.cbegin(); it != statsMap.cend(); ++it)    {      const QString statString = QString("%1: %2").arg(it.key(), it.value().toString());      addResultToModel(sectionString, statString);    }  }}
void StatisticalQueryGroupSort::queryStatistics(){  // create the parameter object  StatisticsQueryParameters params;
  // add the statistic definitions  QList<StatisticDefinition> statisticDefinitionList;  for (const QVariant& def : std::as_const(m_statisticDefinitions))  {    QVariantMap definitionMap = def.toMap();    StatisticDefinition statisticDefinition;    statisticDefinition.setOnFieldName(definitionMap["field"].toString());    statisticDefinition.setStatisticType(statisticStringToEnum(definitionMap["statistic"].toString()));    statisticDefinitionList.append(statisticDefinition);  }  params.setStatisticDefinitions(statisticDefinitionList);
  // set the grouping fields  params.setGroupByFieldNames(m_groupingFields);
  // add the order by objects  QList<OrderBy> orderByList;  for (const QVariant& ob : std::as_const(m_orderBys))  {    QVariantMap orderByMap = ob.toMap();    OrderBy orderBy;    orderBy.setFieldName(orderByMap["field"].toString());    orderBy.setSortOrder(orderStringToEnum(orderByMap["order"].toString()));    orderByList.append(orderBy);  }  params.setOrderByFields(orderByList);
  // ignore counties with missing data  params.setWhereClause("\"State\" IS NOT NULL");
  // execute the query  m_featureTable->queryStatisticsAsync(params).then(this, [this](StatisticsQueryResult* rawResult)  {    onQueryStatisticsCompleted_(rawResult);  });}
void StatisticalQueryGroupSort::addStatisticDefinition(const QString& field, const QString& statistic){  // only add if the definition does not already exist  for (const QVariant& def : std::as_const(m_statisticDefinitions))  {    QVariantMap definitionMap = def.toMap();    if (field == definitionMap["field"].toString())    {      if (statistic == definitionMap["statistic"].toString())        return;    }  }
  // add the definition to the list  QVariantMap statisticDefinition;  statisticDefinition["field"] = field;  statisticDefinition["statistic"] = statistic;  m_statisticDefinitions.append(statisticDefinition);  emit statisticDefinitionsChanged();}
void StatisticalQueryGroupSort::removeStatisticDefinition(int index){  if (!m_statisticDefinitions.empty())  {    m_statisticDefinitions.removeAt(index);    emit statisticDefinitionsChanged();  }}
void StatisticalQueryGroupSort::addOrderBy(const QString& field, const QString& order){  // only add if the orderby is not in the list  for (const QVariant& orderBy : std::as_const(m_orderBys))  {    QVariantMap orderByMap = orderBy.toMap();    if (field == orderByMap["field"].toString())    {      if (order == orderByMap["order"].toString())      {        emit orderBysChanged();        return;      }    }  }
  // add the order by to the list  QVariantMap orderBy;  orderBy["field"] = field;  orderBy["order"] = order;  m_orderBys.append(orderBy);  emit orderBysChanged();}
void StatisticalQueryGroupSort::removeOrderBy(const QString& field){  // remove the order by if it exists in the list  for (int i = 0; i < m_orderBys.size(); i++)  {    QVariantMap orderByMap = m_orderBys.at(i).toMap();    if (field == orderByMap["field"].toString())    {      m_orderBys.removeAt(i);      emit orderBysChanged();      return;    }  }}
void StatisticalQueryGroupSort::removeOrderBy(int index){  // remove the order by at a given index  if (!m_orderBys.empty())  {    m_orderBys.removeAt(index);    emit orderBysChanged();  }}
void StatisticalQueryGroupSort::updateOrder(int index){  if (m_orderBys.empty())    return;
  // get the existing values  QVariantMap orderByMap;  orderByMap["field"] = m_orderBys.at(index).toMap()["field"].toString();  const QString currentOrder = m_orderBys.at(index).toMap()["order"].toString();
  // update the order text  if (currentOrder == "Ascending")    orderByMap["order"] = "Descending";  else    orderByMap["order"] = "Ascending";
  // update the variant list with the new value  m_orderBys.removeAt(index);  m_orderBys.insert(index, orderByMap);
  emit orderBysChanged();}
void StatisticalQueryGroupSort::addGroupingField(const QString& field){  // add a new grouping field  if (!m_groupingFields.contains(field))  {    m_groupingFields.append(field);    emit groupingFieldsChanged();  }}
void StatisticalQueryGroupSort::removeGroupingField(const QString& field){  // remove a grouping field  if (m_groupingFields.contains(field))  {    int i = m_groupingFields.indexOf(field);    m_groupingFields.removeAt(i);    emit groupingFieldsChanged();
    // also update the orderby list    removeOrderBy(field);  }}
// helper to convert from statistic type string to enumStatisticType StatisticalQueryGroupSort::statisticStringToEnum(const QString& statistic) const{  if (statistic == "Average")    return StatisticType::Average;  else if (statistic == "Count")    return StatisticType::Count;  else if (statistic == "Maximum")    return StatisticType::Maximum;  else if (statistic == "Minimum")    return StatisticType::Minimum;  else if (statistic == "Standard Deviation")    return StatisticType::StandardDeviation;  else if (statistic == "Sum")    return StatisticType::Sum;  else    return StatisticType::Variance;}
// helper to convert from sort order string to enumSortOrder StatisticalQueryGroupSort::orderStringToEnum(const QString& order) const{  if (order == "Ascending")    return SortOrder::Ascending;  else    return SortOrder::Descending;}
void StatisticalQueryGroupSort::addResultToModel(const QString& section, const QString& resultString){  m_resultsModel->addStatisticResult(section, resultString);  emit resultsModelChanged();}
QAbstractListModel* StatisticalQueryGroupSort::resultsModel() const{  return m_resultsModel;}
// [WriteFile Name=StatisticalQueryGroupSort, Category=Analysis]// [Legal]// Copyright 2017 Esri.//// Licensed under the Apache License, Version 2.0 (the "License");// you may not use this file except in compliance with the License.// You may obtain a copy of the License at// http://www.apache.org/licenses/LICENSE-2.0//// Unless required by applicable law or agreed to in writing, software// distributed under the License is distributed on an "AS IS" BASIS,// WITHOUT WARRANTIES OR CONDITIONS OF ANY KIND, either express or implied.// See the License for the specific language governing permissions and// limitations under the License.// [Legal]
#ifndef STATISTICALQUERYGROUPSORT_H#define STATISTICALQUERYGROUPSORT_H
// Qt headers#include <QAbstractListModel>#include <QObject>#include <QQuickItem>#include <QStringList>#include <QVariantList>
namespace Esri::ArcGISRuntime{ class ServiceFeatureTable; class StatisticsQueryResult;
enum class SortOrder; enum class StatisticType;}
class StatisticResultListModel;
class StatisticalQueryGroupSort : public QQuickItem{ Q_OBJECT
Q_PROPERTY(QStringList fields MEMBER m_fields NOTIFY fieldsChanged) Q_PROPERTY(QVariantList statisticDefinitions MEMBER m_statisticDefinitions NOTIFY statisticDefinitionsChanged) Q_PROPERTY(QVariantList orderBys MEMBER m_orderBys NOTIFY orderBysChanged) Q_PROPERTY(QStringList statisticTypes MEMBER m_statisticTypes NOTIFY statisticTypesChanged) Q_PROPERTY(QStringList groupingFields MEMBER m_groupingFields NOTIFY groupingFieldsChanged) Q_PROPERTY(QAbstractListModel* resultsModel READ resultsModel NOTIFY resultsModelChanged)
public: explicit StatisticalQueryGroupSort(QQuickItem* parent = nullptr); ~StatisticalQueryGroupSort() override = default;
void componentComplete() override; static void init(); Q_INVOKABLE void queryStatistics(); Q_INVOKABLE void addStatisticDefinition(const QString& field, const QString& statistic); Q_INVOKABLE void removeStatisticDefinition(int index); Q_INVOKABLE void addOrderBy(const QString& field, const QString& order); Q_INVOKABLE void removeOrderBy(const QString& field); Q_INVOKABLE void removeOrderBy(int index); Q_INVOKABLE void updateOrder(int index); Q_INVOKABLE void addGroupingField(const QString& field); Q_INVOKABLE void removeGroupingField(const QString& field);
signals: void fieldsChanged(); void statisticDefinitionsChanged(); void orderBysChanged(); void statisticTypesChanged(); void groupingFieldsChanged(); void resultsModelChanged();
private: QAbstractListModel* resultsModel() const; void connectSignals(); Esri::ArcGISRuntime::StatisticType statisticStringToEnum(const QString& statistic) const; Esri::ArcGISRuntime::SortOrder orderStringToEnum(const QString& order) const; void addResultToModel(const QString& section, const QString& resultString); void onQueryStatisticsCompleted_(Esri::ArcGISRuntime::StatisticsQueryResult* rawResult);
Esri::ArcGISRuntime::ServiceFeatureTable* m_featureTable = nullptr; QStringList m_fields; QVariantList m_statisticDefinitions; QVariantList m_orderBys; QStringList m_statisticTypes; QStringList m_groupingFields; StatisticResultListModel* m_resultsModel = nullptr;};
#endif // STATISTICALQUERYGROUPSORT_H//// Licensed under the Apache License, Version 2.0 (the "License");// you may not use this file except in compliance with the License.// You may obtain a copy of the License at// http://www.apache.org/licenses/LICENSE-2.0//// Unless required by applicable law or agreed to in writing, software// distributed under the License is distributed on an "AS IS" BASIS,// WITHOUT WARRANTIES OR CONDITIONS OF ANY KIND, either express or implied.// See the License for the specific language governing permissions and// limitations under the License.// [Legal]
import QtQuickimport QtQuick.Controls
Rectangle { id: rootOptionsPage color: "#F4F4F4"
property real pageWidth: rootOptionsPage.width - flickable.anchors.margins * 2 signal statisticButtonClicked() property var fields: rootRectangle.fields property var groupingFields: rootRectangle.groupingFields property var statisticTypes: rootRectangle.statisticTypes property var statisticsModel: rootRectangle.statisticDefinitions property var orderByModel: rootRectangle.orderBys property real labelTextSize: 12
// Create a Title Bar for the Options Page Rectangle { id: titleBar anchors { left: parent.left top: parent.top right: parent.right } color: "#005e95" height: 40 clip: true
Text { anchors.centerIn: parent text: "Statistics: US States" color: "white" font.pixelSize: 28 } }
// Create a Flickable Column to hold the various options for configuring statistics Flickable { id: flickable anchors { top: titleBar.bottom left: parent.left right: parent.right bottom: parent.bottom margins: 10 } contentWidth: column.width contentHeight: column.height flickableDirection: Flickable.VerticalFlick clip: true
Column { id: column width: pageWidth spacing: 10
Rectangle { width: pageWidth height: upperRectColumn.childrenRect.height + 10 color: "transparent" clip: true border { width: 1 color: "black" }
Column { id: upperRectColumn anchors { fill: parent margins: 10 } spacing: 5
Row { anchors.horizontalCenter: parent.horizontalCenter spacing: 5
Text { anchors.verticalCenter: parent.verticalCenter text: "Field" font.pixelSize: labelTextSize }
ComboBox { id: fieldComboBox anchors.verticalCenter: parent.verticalCenter property int modelWidth: 0 width: modelWidth + leftPadding + rightPadding model: fields onModelChanged: { for (let i = 0; i < model.length; ++i) { metricsFieldComboBox.text = model[i]; modelWidth = Math.max(modelWidth, metricsFieldComboBox.width); } } TextMetrics { id: metricsFieldComboBox font: fieldComboBox.font } }
Text { anchors.verticalCenter: parent.verticalCenter text: "Type" font.pixelSize: labelTextSize }
ComboBox { id: statisticComboBox anchors.verticalCenter: parent.verticalCenter model: statisticTypes property int modelWidth: 0 width: modelWidth + leftPadding + rightPadding Component.onCompleted : { for (let i = 0; i < model.length; ++i) { metricsStatisticComboBox.text = model[i]; modelWidth = Math.max(modelWidth, metricsStatisticComboBox.width); } } TextMetrics { id: metricsStatisticComboBox font: statisticComboBox.font } }
Button { text: "+" onClicked: rootRectangle.addStatisticDefinition(fieldComboBox.currentText, statisticComboBox.currentText); } }
Rectangle { width: parent.width height: 125 color: "transparent" clip: true border { color: "black" width: 1 }
ListView { id: statisticView anchors { fill: parent margins: 5 } highlightFollowsCurrentItem: true model: statisticsModel clip: true highlight: highlightRectangle highlightResizeVelocity: 1000000 highlightMoveVelocity: 1000000
delegate: Item { width: parent.width height: 25
Row { anchors.verticalCenter: parent.verticalCenter spacing: 10 Text { text: modelData.field font.pixelSize: labelTextSize } Text { text: "(%1)".arg(modelData.statistic) font.pixelSize: labelTextSize } }
MouseArea { anchors.fill: parent onClicked: statisticView.currentIndex = index; } } } }
Button { anchors.horizontalCenter: parent.horizontalCenter text: "Remove Statistic" onClicked: rootRectangle.removeStatisticDefinition(statisticView.currentIndex); } } }
Row { anchors.horizontalCenter: parent.horizontalCenter width: parent.width height: 175 spacing: 5
Column { width: parent.width * 0.45 - parent.spacing height: parent.height spacing: 5
Text { text: "Group Field(s):" font.pixelSize: labelTextSize }
Rectangle { width: parent.width height: 125 color: "transparent" border { width: 1 color: "black" } clip: true
ListView { id: fieldView anchors { fill: parent margins: 5 } highlight: highlightRectangle highlightResizeVelocity: 1000000 highlightMoveVelocity: 1000000 clip: true model: fields delegate: Item { height: 25
CheckBox { anchors.verticalCenter: parent.verticalCenter text: modelData checked: text === "State"
onCheckedChanged: { if (checked) rootRectangle.addGroupingField(text); else rootRectangle.removeGroupingField(text); }
onClicked: fieldView.currentIndex = index; } } } } }
Column { anchors.verticalCenter: parent.verticalCenter width: parent.width * 0.1 - parent.spacing spacing: 5
Button { anchors.horizontalCenter: parent.horizontalCenter text: ">" onClicked: { // return if the field is not selected if (groupingFields.indexOf(fields[fieldView.currentIndex]) === -1) return;
// add the data to the model rootRectangle.addOrderBy(fields[fieldView.currentIndex], "Ascending") } }
Button { anchors.horizontalCenter: parent.horizontalCenter text: "<" onClicked: rootRectangle.removeOrderBy(groupingView.currentIndex); } }
Column { width: parent.width * 0.45 height: parent.height spacing: 5
Text { text: "Order by Field:" font.pixelSize: labelTextSize }
Rectangle { width: parent.width height: 100 color: "transparent" border { width: 1 color: "black" } clip: true
ListView { id: groupingView anchors { fill: parent margins: 5 } highlight: highlightRectangle highlightResizeVelocity: 1000000 highlightMoveVelocity: 1000000
clip: true model: orderByModel delegate: Item { width: parent.width height: 25
Row { anchors.verticalCenter: parent.verticalCenter spacing: 10 Text { text: modelData.field font.pixelSize: labelTextSize } Text { text: "(%1)".arg(modelData.order) font.pixelSize: labelTextSize } }
MouseArea { anchors.fill: parent onClicked: groupingView.currentIndex = index; } } } }
Button { anchors.horizontalCenter: parent.horizontalCenter text: "Change Sort Order" onClicked: rootRectangle.updateOrder(groupingView.currentIndex); } } }
Button { anchors.horizontalCenter: parent.horizontalCenter width: 250 height: 50 text: "<u><b>Get Statistics</b></u>" onClicked: statisticButtonClicked() } } }
Component { id: highlightRectangle Rectangle { color: "cyan" opacity: 0.4 } }}//// Licensed under the Apache License, Version 2.0 (the "License");// you may not use this file except in compliance with the License.// You may obtain a copy of the License at// http://www.apache.org/licenses/LICENSE-2.0//// Unless required by applicable law or agreed to in writing, software// distributed under the License is distributed on an "AS IS" BASIS,// WITHOUT WARRANTIES OR CONDITIONS OF ANY KIND, either express or implied.// See the License for the specific language governing permissions and// limitations under the License.// [Legal]
import QtQuickimport QtQuick.Controls
Rectangle { color: "#F4F4F4" signal backClicked()
property var statisticResult
Column { anchors.fill: parent clip: true
Rectangle { id: titleBar width: parent.width height: 40 color: "#005e95" clip: true
Item { anchors { left: parent.left margins: 10 verticalCenter: parent.verticalCenter } height: 30 width: 100
MouseArea { anchors.fill: parent onClicked: backClicked() }
Text { anchors { left: parent.left verticalCenter: parent.verticalCenter }
text: "< Options" color: "white" font { pixelSize: 18 bold: true } } }
Text { anchors { centerIn: parent margins: 10 } text: "Results" color: "white" font.pixelSize: 28 } }
Item { width: parent.width height: parent.height - titleBar.height
ListView { id: resultView anchors { fill: parent margins: 10 } model: statisticResult clip: true
section { property: "section" criteria: ViewSection.FullString delegate: Rectangle { width: resultView.width height: 25 color: "lightsteelblue"
Text { anchors.verticalCenter: parent.verticalCenter text: section font.bold: true font.pixelSize: 12 } } }
delegate: Item { height: 25
Text { anchors.verticalCenter: parent.verticalCenter text: statistic font.pixelSize: 12 } } } } }}// [Legal]// Copyright 2016 Esri.//// Licensed under the Apache License, Version 2.0 (the "License");// you may not use this file except in compliance with the License.// You may obtain a copy of the License at// http://www.apache.org/licenses/LICENSE-2.0//// Unless required by applicable law or agreed to in writing, software// distributed under the License is distributed on an "AS IS" BASIS,// WITHOUT WARRANTIES OR CONDITIONS OF ANY KIND, either express or implied.// See the License for the specific language governing permissions and// limitations under the License.// [Legal]
// sample headers#include "StatisticResultListModel.h"
// Qt headers#include <QAbstractListModel>#include <QByteArray>#include <QDir>#include <QFileInfo>#include <QHash>#include <QList>#include <QModelIndex>#include <QObject>#include <QVariant>
StatisticResultListModel::StatisticResultListModel(QObject* parent) : QAbstractListModel(parent){ setupRoles();}
void StatisticResultListModel::setupRoles(){ m_roles[SectionRole] = "section"; m_roles[StatisticRole] = "statistic";}
void StatisticResultListModel::addStatisticResult(const QString& section, const QString& statistic){ beginInsertRows(QModelIndex(), rowCount(), rowCount()); StatisticResult result(section, statistic); m_results.append(result); endInsertRows();}
int StatisticResultListModel::rowCount(const QModelIndex& parent) const{ Q_UNUSED(parent); return m_results.count();}
QVariant StatisticResultListModel::data(const QModelIndex& index, int role) const{ if (index.row() < 0 || index.row() >= m_results.count()) return QVariant();
StatisticResult result = m_results[index.row()];
QVariant retVal;
switch (role) { case SectionRole: retVal = result.section; break; case StatisticRole: retVal = result.statistic; break; default: break; }
return retVal;}
QHash<int, QByteArray> StatisticResultListModel::roleNames() const{ return m_roles;}
void StatisticResultListModel::clear(){ beginResetModel(); m_results.clear(); endResetModel();}
// c'tor for StatisticResult structStatisticResultListModel::StatisticResult::StatisticResult(const QString& section, const QString& statistic): section(section), statistic(statistic){}// [Legal]// Copyright 2016 Esri.//// Licensed under the Apache License, Version 2.0 (the "License");// you may not use this file except in compliance with the License.// You may obtain a copy of the License at// http://www.apache.org/licenses/LICENSE-2.0//// Unless required by applicable law or agreed to in writing, software// distributed under the License is distributed on an "AS IS" BASIS,// WITHOUT WARRANTIES OR CONDITIONS OF ANY KIND, either express or implied.// See the License for the specific language governing permissions and// limitations under the License.// [Legal]
#ifndef STATISTICRESULTISTMODEL_H#define STATISTICRESULTISTMODEL_H
// Qt headers#include <QAbstractListModel>#include <QByteArray>#include <QHash>#include <QList>
class StatisticResultListModel : public QAbstractListModel{ Q_OBJECT
public: enum StatisticResultRoles { SectionRole = Qt::UserRole + 1, StatisticRole };
explicit StatisticResultListModel(QObject* parent = nullptr); ~StatisticResultListModel() override = default;
public: void addStatisticResult(const QString& section, const QString& statistic); void clear(); void setupRoles(); int size() { return m_results.size(); }
// QAbstractItemModel interface int rowCount(const QModelIndex& parent = QModelIndex()) const override; QVariant data(const QModelIndex& index, int role = Qt::DisplayRole) const override;
protected: QHash<int, QByteArray> roleNames() const override;
private: // Struct to keep track of the section and statistic strings struct StatisticResult { public: StatisticResult(const QString& section, const QString& statistic); ~StatisticResult() = default;
QString section; QString statistic; };
QHash<int, QByteArray> m_roles; QList<StatisticResult> m_results;};
#endif // STATISTICRESULTISTMODEL_H// [WriteFile Name=StatisticalQueryGroupSort, Category=Analysis]// [Legal]// Copyright 2017 Esri.//// Licensed under the Apache License, Version 2.0 (the "License");// you may not use this file except in compliance with the License.// You may obtain a copy of the License at// http://www.apache.org/licenses/LICENSE-2.0//// Unless required by applicable law or agreed to in writing, software// distributed under the License is distributed on an "AS IS" BASIS,// WITHOUT WARRANTIES OR CONDITIONS OF ANY KIND, either express or implied.// See the License for the specific language governing permissions and// limitations under the License.// [Legal]
import QtQuickimport QtQuick.Controlsimport Esri.Samples
StatisticalQueryGroupSortSample { id: rootRectangle clip: true width: 800 height: 600
StackView { id: stackView anchors.fill: parent
// Initial page is the OptionsPage initialItem: OptionsPage { id: statisticOptionsPage onStatisticButtonClicked: { // execute the query queryStatistics();
// show the results page stackView.push(resultsPage); } }
// The ResultsPage is shown when a query is executed ResultsPage { id: resultsPage width: parent.width height: parent.height statisticResult: rootRectangle.resultsModel onBackClicked: stackView.pop(); } }}